Climate Science Glossary

Term Lookup

Enter a term in the search box to find its definition.

Settings

Use the controls in the far right panel to increase or decrease the number of terms automatically displayed (or to completely turn that feature off).

Term Lookup

Settings


All IPCC definitions taken from Climate Change 2007: The Physical Science Basis. Working Group I Contribution to the Fourth Assessment Report of the Intergovernmental Panel on Climate Change, Annex I, Glossary, pp. 941-954. Cambridge University Press.

Home Arguments Software Resources Comments The Consensus Project Translations About Support

Twitter Facebook YouTube Mastodon MeWe

RSS Posts RSS Comments Email Subscribe


Climate's changed before
It's the sun
It's not bad
There is no consensus
It's cooling
Models are unreliable
Temp record is unreliable
Animals and plants can adapt
It hasn't warmed since 1998
Antarctica is gaining ice
View All Arguments...


Username
Password
New? Register here
Forgot your password?

Latest Posts

Archives

Medieval Warm Period: rhetoric vs science

Posted on 23 August 2010 by robert way

One of the most often cited arguments of those skeptical of global warming is that the Medieval Warm Period (800-1200 AD) was as warm as or warmer than today. Using this as proof to say that we cannot be causing current warming is a faulty notion based upon rhetoric rather than science. So what are the holes in this line of thinking?

Firstly, evidence suggests that the Medieval Warm Period was in fact warmer than today in many parts of the globe such as in the North Atlantic. This warming thereby allowed Vikings to travel further north than had been previously possible because of reductions in sea ice and land ice in the Arctic. However, evidence also suggests that some places were very much cooler than today including the tropical pacific. All in all, when the warm places are averaged out with the cool places, it becomes clear that the overall warmth was likely similar to early to mid 20th century warming. Since that early century warming, temperatures have risen well-beyond those achieved during the Medieval Warm Period across most of the Globe. This has been confirmed by the National Academy of Sciences Report on Climate Reconstructions. Further evidence (Figure 1) suggests that even in the Northern Hemisphere where the Medieval Warm Period was the most visible, temperatures are now beyond those experienced during Medieval times.

Secondly, the Medieval Warm Period has known causes which explain both the scale of the warmth and the pattern. It has now become clear to scientists that the Medieval Warm Period occurred during a time which had higher than average solar radiation and less volcanic activity (both resulting in warming). New evidence is also suggesting that changes in ocean circulation patterns played a very important role in bringing warmer seawater into the North Atlantic This explains much of the extraordinary warmth in that region. These causes of warming contrast significantly with today's warming, which we know cannot be caused by the same mechanisms.

Overall, our conclusions are:
a) Globally temperatures are warmer than they have been during the last 2000 years, and
b) the causes of Medieval warming are not the same as those causing late 20th century warming.


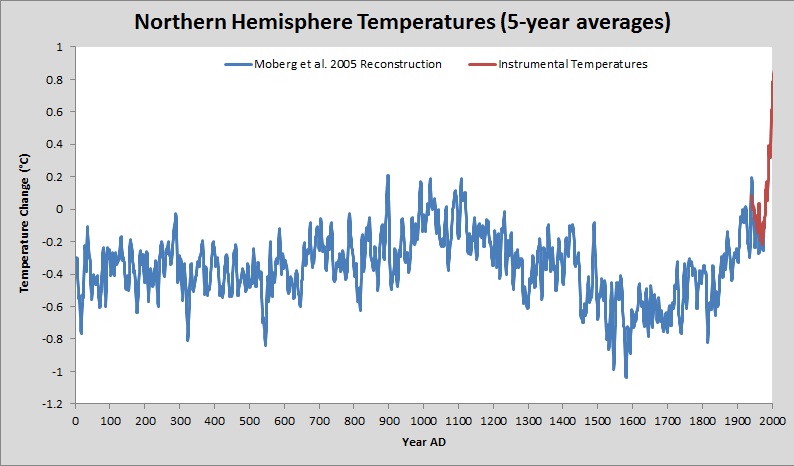
Figure 1: Northern Hemisphere Temperature Reconstruction by Moberg et al. (2005) shown in blue, Instrumental Temperatures from Hadley shown in Red.

Note: This post is the Basic version (written by Robert Way) of the skeptic argument "Medieval Warm Period was warmer". We're currently going through the process of writing plain English versions of all the rebuttals to skeptic arguments. It's a big task but many hands make light work. If you're interested in helping with this effort, please contact me.

0 0

Printable Version  |  Link to this page

Comments

Comments 1 to 41:

  1. Good post. One comment - I think the real reason skeptics make this argument is to argue that if it was warmer in Medieval times than it is now, then global warming must not be bad - not to argue that it isn't caused by people. An answer to that claim ought to be included as well.
    0 0
  2. WAG, that'd be perhaps better addressed in the rebuttal of the "It's not bad" argument. Although perhaps a comment pointing readers to that argument would be useful in here.
    0 0
  3. "It has now become clear to scientists that the Medieval Warm Period occurred during a time which had higher than average solar radiation and less volcanic activity (both resulting in warming)" Can you elaborate on the first one? As far as I can see reconstructions of solar radiation prior to 1978 are speculative. This even goes for the reconstructions from 1874 when high quality sunspot observations began. For example, Solanske & Fligge commented that their sunspot reconstruction relied on the assumption that the measured relationships have remained unchanged over more than a century - "Solar Irradiance since 1874 Revisited", Solanski & Fligge, Geophysical Research Letters (1998).
    0 0
  4. stevecarsonr, The Medieval Maximum of solar activity occurred during the MWP. This has been discussed in numerous papers. Some I just threw together in the last few minutes for your comment are below. There are many more. Also note that although we don't have year to year changes very effectively measured back as far as the MWP we do have many paleoclimatic proxies which give evidence suggesting a solar maximum. Ultimately the MWP can be viewed very similarly to an extended 1940s era warming. Tyson, P.D., Karlen, W., Holmgren, K. and Heiss, G.A. 2000. The Little Ice Age and medieval warming in South Africa. South African Journal of Science 96: 121-126. 30. Beryllium-10 measurements are from E. Bard et al., Earth Planet. Sci. Lett. 150, 453 (1997); E. Bard et al., Tellus B 52, 985 (2000). 31. M. Stuiver and T. F. Braziunas, Radiocarbon 35, 137 (1993). Crowley 2000. Science. Causes of Climate Change over the Past 1000 years. Jirikowic and Damon. (1994). The medieval solar activity maximum. Climatic change. Volume 26, Numbers 2-3.
    0 0
  5. The IPCC describes our level of scientific understanding of the pre-1978 solar activity data as “very low”. (Graph and comments at Here comes the sun ). Crowley (2000) is a paper matching modeled results with solar activity estimates derived from Lean et al (1995) and Bard et al (2000). It's not a paper validating solar output (except by matching model results). Bard (2000) says "The concomitant production variations of 14C and 10Be can be used as a proxy for the TSI by assuming a linear relationship between magnetic activity and irradiance following previous workers.." and notes the familiar sunspot papers including Solanski and Fligge. This S&F paper notes that their sunspot relationships *assumes* the measured relationship between sunspots and output over 20 years is then matched for the previous 100. It's nice to assume a relationship and I think it's a good starting point given no other information. However, that doesn't mean it has been validated. Which is why the IPCC says that results back to 1600 "have a low level of scientific understanding" and claims less certainty before that..
    0 0
  6. Agreed. For the current warming cycle is likely to correspond to 2.5 thousand. years, + 4.2 thousand years, maybe six thousand. years. MWP is only responsible for a cycles of Millennium. see here. The current solar activity is the Grand Maximum - Solar cycle variations on the millennial times scale: a challenge for solar dynamo theory, Usoskin, 2010.. The MWP in NH, however, was much warmer than today. The logical conclusion: still waiting for us so much bigger natural warming, than is now and was in the MCA. Currently, the Earth is getting warmer just unevenly - as in the MWP - as usually happens in the Millennium cycles: Most of Antarctica is cooling, like for example central and N. China ( Characteristics of cold–warm variation in the Hetao region and its surrounding areas in China during the past 5000 years, Li, 2010.), Fennoskandia (Grud, 2008.), and Western Europe is warming much faster than expected.): “The MODEL [including anthropogenic GHG] simulates a factor 1.24±0.09 faster warming than the global mean, but the OBSERVATIONS have a trend A=2.50 ± 0.39.” This is 0.75 (global) to 0.94 deg. C (W. E.) in secular scale. IPCC report: “The Working Group I (WGI) WGI FAR noted that past climates could provide analogues. Fifteen years of research since that assessment has identified a range of variations and instabilities in the climate system that occurred during the last 2 Myr of glacial-interglacial cycles and in the super-warm period of 50 Ma. These past climates do not appear to be analogues of the immediate future, yet they do reveal a wide range of climate processes that need to be understood when projecting 21st-century climate change ...”
    0 0
  7. On your first point. How do we get a global average temp for the MWP when the best multi-proxy reconstructions reply on as little as 6 data point for the whole of the SH at that time? There has to be a huge level of in-filling. That in-filling is dependant on the theories that support AGW. Secondly, I've read articles recently that suggest again that much of the high latitude NH warming is again due to ocean circulation. What's wrong with accepting this as part of the picture today? Fianlly I'm still unconvinced that pasting the thermometer record on the end of a proxy reconstruction is totally valid. I agree it's very appealing but is it valid?
    0 0
  8. HumanityRules writes: That in-filling is dependant on the theories that support AGW. Can you explain what you mean by that? As far as I can tell, the questions of whether N proxies are sufficient for a hemispherical temperature reconstruction, and how best to spatially weight those N proxies, are mostly statistical in nature. How exactly is the interpolation or weighting of proxies "dependent on the theories that support AGW"? Which theories? Also, could you cite what you're referring to as "the best multi-proxy reconstructions"?
    0 0
  9. Humanity Rules, You're building strawmen. No one says that oceans circulation changes cannot be contributing to current warming. The dominant forcing is CO2 and the secondary forcing today is the AMO. Who says that ALL warming is caused by CO2 and that there aren't natural contributors? Which reconstructions are the best? Personally I think Moburg et al. 2005 is the best. I've seen quite a bit of evidence to support this theory including Moburg (2008). The thermometer is valid at the end, proxies are calibrated against the thermometer in order to decide which ones to use. If you can calibrate against one then you are essentially saying that only proxies which correlate well with the instrumental record are being selected, thereby making it an appropriate choice. For the record also, Moburg et al. 2005 does not rely on 6 proxies and neither does Mann et al. 2008 or Mann et al. 2009 or Mann et al. 2003 or D'Arrigo et al. 2006 or Viau et al. 2006, or Kaufman et al. 2009. So perhaps it is best that you not regurgitate common skeptic arguments that are completely flawed ok? For the record also, notice many of these are hemispheric reconstructions and i'm sure you are mistaken in saying 6 points were used for a recent global reconstruction. You should consider keeping things to yourself if you are going to make clear errors in what you say.
    0 0
  10. Robert Way writes: For the record also, notice many of these are hemispheric reconstructions and i'm sure you are mistaken in saying 6 points were used for a recent global reconstruction. I think HumanityRules was specifically referring to the southern hemisphere ("... as little as 6 data point for the whole of the SH ...").
    0 0
  11. First of All, you cite a non-peer-reviewed article to illustrate your Grand Maximum theory. If this were in fact the case and we were currently in a grand maximum that explains climate change then I am sure that the authors will be publishing their results in a reputable journal. Perhaps journal of climate, nature geoscience, science, GRL, international journal of climatology, climatic changes, climate dynamics…etc… rather than the 1st issue of a solar magazine for solar enthusiasts including amateurs (as indicated by the website). Secondly, I understand there are different cycles which operate within the system and can likely explain some of the current warming. Viau et al. 2006 very much talks about this and shows a 1050 year cycle which can explain some of the warming. The conclusions though, are that those very same cycles CANNOT explain the amount of late 20th century warmth and can at the most explain 0.2-0.3 °C of the 0.8 °C warming. Thirdly, Most of Antarctica is not cooling. See Steig et al. 2009. Most is in fact warming. Fourthly, the MWP in the NH was not much warmer than today. Moburg et al. 2006, Viau et al. 2006, Mann et al. 2008, Mann et al. 2009, Kaufmann et al. 2009, and D’Arrigo et al. 2006. Lets see a peer-reviewed regional reconstruction which does not show warmer temperatures in NH late 20th century than during the MWP? Loehle 2008? Energy and Environment is not a real peer-review journal. GRL rejected his analysis immediately realizing it was poor quality. In summary, there are no hemisphere wide reconstructions which show greater warm. And even local reconstructions in many areas show that the MWP has been surpassed. Buntgen et al. 2008 is a good study for that which shows the European alps much warmer now (Tree-rings don’t diverge till after 2004 making it a landmark study). Fifth point, When the models overestimate warming then it can’t be GHG but when they underestimate then it can’t be GHG either? Lets be honest, you’re just a contrarian who will take any evidence you can and try and find a way to massage it to fit your idea that AGW is a fraud. Finally, No one argues there aren’t natural contributions. You can find it quite clearly on this website. The important delineation is that we have empirical evidence for an enhanced greenhouse effect. Until you can disprove physics and direct measurements you have no case. http://www.skepticalscience.com/Empirical-evidence-that-humans-are-causing-global-warming.html
    0 0
  12. Woops, I misread humanity Rules statement. I apologize for making an incorrect response. But my findings are still robust I think. Most have argued the NH was warmer during the MWP than the SH. Therefore the most important relevance is showing the NH temps now are above (which they are). SH is not irrelevant but is not as important in this particular argument.
    0 0
  13. The Moberg reconstruction is mainly based on tree-rings. The width of tree-rings depends on the temperature, precipitation and carbon dioxide concentration, so they are unreliable to reconstruct past temperatures. The best reconstruction is Craig Loehle's, using only non-treering proxies. The fact that this reconstruction was rejected by GRL does not mean that it is a poor analysis. It only demonstrates that GRL is not yet open for paradigm breaking views like Energy and Environment is. On the basis of Loehle's reconstruction we must conclude that the medieval period very likely was hotter than today, as was the Roman period and the earlier Holocene optimum. This could mean that the effect of greenhouse gas emissions has only made a small contribution to the recent warming.
    0 0
  14. Something else worth noting is that when a skeptic cites a large MWP as evidence of anything, you can always remind them that they are actually citing evidence of the Earth having a higher climate sensitivity, or warming more as a result of any given warming forcing, such as extra GHGs. That's not, I think, what they would otherwise have you believe.
    0 0
  15. fydijkstra wrote : "The fact that this reconstruction was rejected by GRL does not mean that it is a poor analysis. It only demonstrates that GRL is not yet open for paradigm breaking views like Energy and Environment is." I saw no facts in that sentence of yours there : only conspiracy theories, accusation of bias and dishonesty, and laughable belief concerning E & E. Let me remind you what the editor of E & E, Sonja Boehmer-Christiansen, has to say about her pet project : "I'm following my political agenda -- a bit, anyway," she says. "But isn't that the right of the editor?" Funny how so-called skeptics see conspiracy and bias everywhere, except when it is actually stated by organisations they need to believe in. Political posturing has no part to play in science, so E & E fails as a pertinent, relevant, reliable source of any sort of legitimate science.
    0 0
  16. fydijkstra, You are absolutely incorrect about the Moburg reconstruction. The Moburg reconstruction uses low-resolution proxies to do the heavy lifting and uses tree rings for only interannual variations. It was in fact criticized for not using tree-ring data enough by some dendro guys. They said it showed too much low frequency changes because of it. Moburg (2008) shows they were wrong. By the way, for the record. You have been proven wrong. You said it relies on tree rings. It doesn't. That's the novelty of this reconstruction. Craig Loehle's reconstruction is a very poor quality reconstruction. He does not do any weighting based upon area which invalidates his study right off the bat. Also Loehle mis-dates several of his proxies. Loehle made a multitude of errors with his proxy selection, calibration and validation. These are all discussed here: http://www.realclimate.org/index.php/archives/2007/12/past-reconstructions/ and here: http://web.archive.org/web/20071226051459/http://thatstrangeweather.blogspot.com/2007/11/loehle-reconstruction.html Energy and Environment is a crappy magazine (I won't even call it a journal)and the fact that they selected Loehle's original analysis is proof of that. Not even a map showing where the proxies were, let alone the obvious problems mentioned above. To call it the best reconstruction shows you obvious bias and lack of caring for the methodologies employed. You only support the reconstruction which follows your conclusion rather than the one which has the correct methodologies and proxies. It is a farce of you to sit here and say loehle is the best when it has so many glaring flaws. Even Climate audit admitted to many of them.
    0 0
  17. fydijkstra writes: On the basis of Loehle's reconstruction we must conclude that the medieval period very likely was hotter than today, as was the Roman period and the earlier Holocene optimum. "Today" in the Loehle reconstruction isn't actually "today", it's 1935 or so. As you can see, things have warmed quite a bit since then: Figure 2: Loehle 2008 temperature reconstruction with Hadley instrumental record. Aside from that, the Loehle reconstruction is really only a northern-hemisphere reconstruction (only a handful of SH proxies were included, as discussed by chris in this comment). If you compare current NH temperatures to Loehle's reconstruction, things are quite a bit warmer now than at any previous time.
    0 0
  18. The use of the phrase "faulty notion based on rhetoric" is itself a faulty notion, and one based on a misunderstanding of the meaning of the word 'rhetoric'. The phrase would make much more sense if it read, "faulty notion based on empty rhetoric'. Not all rhetoric is empty, after all.
    0 0
  19. The graph shown above (Figure 1) is remarkable. The data are available in the download link on this page. Moberg provides a low frequency component (labeled LF in the data file). It really didn't appear to be that low, so I created a really long period filter and plotted the original data, Moberg's LF (pink) and the long period curve (dark purple) in the graph below. Click for full size Moberg's data ended in 1979. Tacked on to the end is GISSTemp from that point forward (red), adjusted slightly down to merge. This really puts the MWP and LIA into perspective: Yes, there is an underlying long term 'natural cycle', with an apparent period of 1100 years. And yes, we started on the long, gradual upswing after 1650 or so. But the graph of temperature anomalies from 1850-2009 looks nothing like the natural cycle. That's a difference many seem to forget: the big-picture rate of change of recent temperature anomalies is much too fast to be 'natural'.
    0 0
  20. "That's a difference many seem to forget: the big-picture rate of change of recent temperature anomalies is much too fast to be 'natural'. " YES. And it is linked to ever growing CO2 concentrations resulting from increasing industrial activity relying on coal fired power stations (and massive volumes of cars). This blind spot about recent temperature rise always stuns me. If we had, a few hundred years ago, decided, as a planet, that we would only industrialise using renewable energy, and had kept CO2 constant, and we had still seen a slow rise in temps in recent times comparable to the MWP then, while we might be curious about the underlying mechanisms, and might also be concerned about the effects of a temp rise on a planet of 9 billion people instead of a few hundred million, we wouldn't be concerned about the longer term prognosis of temperature rise. That deniers don't appear to recognise that we are not in that latter fantasy scenario is evidence of a rigid mindset determined to prevent any action to save this little planet.
    0 0
  21. Correction: the original post and several of the comments refer to "Moburg". It should be "Moberg" (as used in later comments).
    0 0
  22. muoncounter, thanks for the comment, but I find this a bit hard to swallow: "Yes, there is an underlying long term 'natural cycle', with an apparent period of 1100 years. " I don't think one can confidently diagnose the existence of an 1100 year periodic cycle from 2000 years of data unless the repetition is very, very close to exact. That's less than two full cycles!
    0 0
  23. Ned, you are right. The bare minimum is to have a cycle with the length of the data span. This work only without any confonding factor. Maybe the thousand tears cycle comes from other data.
    0 0
  24. NH - MWP - or wants to Mann and Briffa - MCA. It's probably Spenser said: there was no MWP warmer than today? So it (probably) early medieval skeptics planted these trees, whose trunks are revealing Alpine glaciers, Alaska and Greenland ...
    0 0
  25. Well, if you had a few hundred years of hot climate you would have trees much higher than those in MWP. However, trees have yet to go up. This is a long process but it is documented to be ongoing.
    0 0
  26. Alpine glaciers tongue response lags temperature by several decades and nevertheless the great aletsch retreat is already greater than at medieval times, however some area are in equilibrium with decadal temperature fluctuation and the ice cover there is smaller than at any times in the last ~5.000 years. grosjean et al. 2007 "The critical point in the context of this paper is that leather requires permanent embedding in ice in order to stay preserved and, as it is observed today, deteriorates very quickly if exposed at the surface. In consequence, the finds at Schnidejoch suggest permanent ice cover at that site for the last 5000 years, more specifically from ca. 3000 BC until AD 2003. At first glance our conclusion differs from the conclusions drawn from exposed trees in the forefields of melting glacier tongues (Jorin et al.,2006). However, the conclusions by Jorin et al. (2006; see also by Hormes et al., 2006) refer to the AD 1985 level:‘glaciers in the Grimsel [and Alpine] area were smaller than at 1985 AD during several times for the last 5000 years’; while our conclusion reads: ‘in the year of 2003 AD, the ice field at Schnidejoch has reached the smallest extent since the last 5000 years’. This is not a contradiction. We argue that this difference is explained by the dissimilar response lags of the two types of archives compared: ice mass balance near the ELA (Schnidejoch) responds immediately to sub-decadal climate variations, while Alpine glacier tongues respond with a multi-decadal lag to climatology (20–60 years (Jorin et al., 2006); importantly this fact also applies to the study by Hormes et al. (2006)). Differences between the equilibrium states of fast and slowly responding climate archives are typically large during phases of rapid changes. Indeed while the ice field at Schnidejoch is in equilibrium with the state of the atmosphere of the most recent years, the glacier tongues have not yet fully responded to the excessively warm years of the last 15 years, when (1) solar radiation at the Earth’s surface has increased owing to brightening of the atmosphere (globally 6.6 W mÀ2 10 yrÀ1 between 1992 and 2002, Swiss Plateau 7.2 W mÀ2 10 yrÀ1; Wild et al., 2005), (2) anthropogenic greenhouse forcing with related strong water vapour feedback enhanced the downward longwave radiation in Europe (þ1.18 W mÀ1 yrÀ1, data 1995–2002; Philipona et al., 2005) which increased temperatures, and (3) negative trends in the specific mass balance of Alpine glaciers accelerated (Zemp, 2006). "
    0 0
    Moderator Response: Please don't paste such long quotes. Summarize, make the particular points of relevance, and provide the link. There is no hard and fast rule about how long is too long, just a rule of thumb that if readers can easily click a link to see some text, give them that link with instructions of where to look once they get there.
  27. wrong link, here is the correct one: grosjean et al. 2007
    0 0
  28. Re HR's comment "I'm still unconvinced that pasting the thermometer record on the end of a proxy reconstruction is totally valid" the thermometer record IS a proxy record, with the thermal expansion, electrical or optical properties of various materials used as a proxy to estimate the temperature of the atmosphere. They are, of course, very good proxies.
    0 0
  29. #22: "I don't think one can confidently diagnose the existence of an 1100 year periodic cycle from 2000 years of data" Point taken. I saw a low around 500 and another around 1600. Whether or not that repeats is not contained in these data. But if I was modeling these data, I'd start with that long period. I think its pretty certain that you would need higher frequencies to accurately describe what happened at the tail end. And then the question would be: what natural process provides those higher frequencies? And if not natural, then what man-made process?
    0 0
  30. Viau et al. 2006 uses 15,000 years of data and finds a 1050 year cycle with an amplitude of around 0.2°C I believe. Also pertaining to Arkadiusz Semczyszak's commentary. If you took the 1940s and kept the same temperatures as then for years and years then you would see the MCA/MWP. The same forcings and roughly the same amplitude. This is shown in numerous studies (same pattern of warmth even). But the current warming is beyond that of the 1940s and is much more global. I will have to find another reference I saw but they use cosmogenic exposure dating on surfaces revealed by glaciers in the Canadian arctic (on Baffin Island I think) and find that ice covered that area during the MCA/MWP.
    0 0
  31. For a more balanced perspective, one needs to compare Moberg's work that gives special weight to tree rings against Loehle's that uses the same data but assigns low weighting to tree rings. The contrast is astounding. According to Moberg the MVP anomaly is a "blip" of around 0.2 Kelvin. Furthermore, current temperatures appear to be higher than they were during the MWP. Loehle shows quite a different picture with an anomaly of around +0.6 Kelvin at 950 a.d., 0.3 Kelvin higher than today: http://climateaudit.org/2007/11/20/the-loehle-network-plus-moberg-trees/
    0 0
  32. GC - now why would we expect a "more balanced perspective" from a paper published in E&E and commented on at CA? The errors were such that Loehle published corrections in 2008. Wouldnt be hard to find other commentary. The only cite I could find in real peer-reviewed literature being by ... Scafetta. What a surprise. Now where was the skepticism in making a critical appraisal of this paper?
    0 0
  33. gallopingcamel at 14:12 PM on 25 August, 2010 oh dear gallopingcamel, that's simply wrong. I wonder whether you have made any attempt whatsoever to address a comparison of Loehle's and Moberg's reconstruction meaningfully. (i) The reconstruction of Loehle's you are referring to has an embarrassing howler. He didn't understand the convention of dating proxies, and so his "present" that he defined as near 2000 is actually near 1950. In fact his corrected analysis only goes up to 1935. Even taking his deficient analysis (remember he published this in a non-science magazine) at face value, current temperatures in the Northern hemisphere are well above the maximum of his MWP (by 0.3-0.4 oC). (ii) Loehle's baseline (zero oC anomaly) is not the same as those used by climate scientists, which is defined during a period where there is good overlapping proxy and direct temperature measurements. This is normally an average over a period between 1950-1990 (I think Moberg’s “zero” is a 1960-1990 average). Loehle’s “zero” was apparently set by averaging all the data over the entire near-2000 year period. So obviously to compare Loehle’s and Moberg’s temperature anomalies sensibly these have to be normalized to a common zero. You can easily do this by inspection (e.g. lining up the pre-MWP “baseline”; this is around -0.4 oC in Moberg and zero in Loehle). Rescaling Loehle to match Moberg’s zero, puts Loehle’s MWP maximum at an anomaly of ~ + 0.2 oC compared to Moberg’s of around zero. So actually, despite the dismal nature of Loehle’s reconstruction and the embarrassing errors in his analysis, Loehle’s reconstruction isn’t very different to the reconstructions done by scientists (e.g. Moberg). It shows a MWP that was ~ 0.4 (Moberg) to ~0.5-0.6 oC (Loehle) above the pre-MWP temperature anomaly, and around 0.3-0.4 oC (Loehle) to 0.5 oC (Moberg) cooler than current temperatures (in the NH).
    0 0
  34. The Norse Greenland colony, which was started in the 11th century and was abandoned in the 15th century, often comes up in connection with the Medieval Warm Anomaly. There is a very good account of it in Jared Diamond's Collapse. Diamond refers to several book-length accounts, but a shorter older account I have is Magnus Magnusson's Vikings (1980). Magnusson was an Icelander, a scholar and archaeologist woh made it quite big on television in Britain in the 1970s and 1980s. Magnusson's book is an apologia for the Vikings, who (he claims) were misunderstood traders. Hence he emphasises peaceful relations with the Inuit, whereas Diamond suspects the Vikings and the Inuit had primarily an antagonistic relationship. Certainly, the Norsemen never adapted any Inuit technology, which was better suited to the environment than theirs. However, the colony was marginal from the start. It quickly ran short of wood and iron for tools, and used Labrador as a source for each. Farm animals overgrazed the pastures and the short summers made life harsh. Its main export(walrus ivory) was a long distance from the market (Norway) and a difficult journey away. In modern terms, the colony was tiny: about 4,000 people in an "Eastern Settlement", just near the southern tip of Greenland, and 1,000 more in a "Western Settlement" (really North-Western). Diamond suspects the Western Settlement was wiped out by Inuit. Then as now, most of Greenland was ice capped. The colonists and the Inuit eked out an existence from the sea and the coastal strip. As I said above, the Inuit (who were also recent arrivals) had the superior technology and survival skills for the tough environment. There is no need, therefore, to appeal to climate ALONE as the source of the difficulties experienced by the Norse settlements, after their early successes. Diamond makes that clear. Magnusson refers to climate as a suspect in the final collapse but, writing when he did, he calls it the "Little Climate Optimum". So "climate determinism" falls down when the Medieval Greenland colony is discussed - climate may have contributed to its short flourishing period and its demise, but there are multiple other factors which also affected that outcome.
    0 0
  35. #31: "According to Moberg the MVP anomaly is a "blip" of around 0.2 Kelvin. " No. The data graphed above is straight out of Moberg, which clearly shows the MWP was 0.4 deg above the earlier (0-600 AD) baseline. Why state something that is so blatantly false?
    0 0
  36. Toby #34 - excellent summary. I think you are giving the deniers too much credit though. They seem to believe that greenland had no ice on it 500 years ago and this is why it was called Greenland and there were Vikings all over it growing crops and then the LIA came and wiped them out. So we don't need to worry about current warming. There is no sense, in any denier comment I have ever seen, that the Viking colonies were restricted to little coastal enclaves for a small number of people and that the rest of Greenland, then as now, was covered with the immensely thick and immensely old ice sheet.
    0 0
  37. chris (#33), Scientists publish their ideas and the best way for their results to be assessed is for other people to reproduce their work independently. Steve McIntyre applied this test to Moberg's and Loehle's analysis and found fault with both. Here are McIntyre's reconstructions: http://climateaudit.files.wordpress.com/2007/11/moberg23.gif McIntyre commented: "The difference between Moberg’s results (in which the modern warm period was a knife-edge warmer than medieval) and these results rests entirely with proxy selection. The 11 series in the Moberg low-freq network are increased to 18, primarily through the addition of ocean SST reconstructions...."
    0 0
  38. I disagree with steve's take on Moberg versus loehle. Loehle was clearly flawed whereas Moberg brought something new to the field with his novel wavelet technique. I think anyone who would give loehle's analysis the same credibility as Moberg's clearly has an agenda as methodologically the difference is clear.
    0 0
  39. Surely it doesn't matter how hot the MWP was. Say, for the sake of argument, that we accept that it was warmer then than it is now. Then doesn't the skeptic's argument boil down to the equivalent of "Forest fires can happen naturally, therefore it is impossible for an arsonist to start a forest fire". Maybe the article could make that point more clearly.
    0 0
  40. fydijkstra at 00:37 AM on 24 August, 2010 It seems no-one noticed (or commented) that my light hearted effort here was really a subtle poke at the Loehle methodology? (but with tree rings and 50 proxies) I tried taking the tree ring data out, - not much difference. With the 50 proxies and simple averaging that Loehle used the MWP appears slightly less warm than now. I could however easily cherry pick several proxy data sets and show a slightly warmer MWP... However every indication is that the late 20th Century multi-decadal warming trend will continue.
    0 0
  41. Regarding the MWP, a reconstruction from borehole temperatures [no treerings] is A late Quaternary climate reconstruction based on borehole heat flux data, borehole temperature data, and the instrumental record - Huang, Pollack and Shen (2008) "The reconstructions show the temperatures of the mid-Holocene warm episode some 1–2 K above the reference level, the maximum of the MWP at or slightly below the reference level, the minimum of the LIA about 1 K below the reference level, and end-of-20th century temperatures about 0.5 K above the reference level. [1961-1990 mean of the instrumental record]" Which it seems essentially would appear to confirm Moberg.
    0 0

You need to be logged in to post a comment. Login via the left margin or if you're new, register here.


The Consensus Project Website

THE ESCALATOR

(free to republish)


© Copyright 2024 John Cook
Home | Translations | About Us | Privacy | Contact Us