Climate Science Glossary

Term Lookup

Enter a term in the search box to find its definition.

Settings

Use the controls in the far right panel to increase or decrease the number of terms automatically displayed (or to completely turn that feature off).

Term Lookup

Settings


All IPCC definitions taken from Climate Change 2007: The Physical Science Basis. Working Group I Contribution to the Fourth Assessment Report of the Intergovernmental Panel on Climate Change, Annex I, Glossary, pp. 941-954. Cambridge University Press.

Home Arguments Software Resources Comments The Consensus Project Translations About Support

Twitter Facebook YouTube Mastodon MeWe

RSS Posts RSS Comments Email Subscribe


Climate's changed before
It's the sun
It's not bad
There is no consensus
It's cooling
Models are unreliable
Temp record is unreliable
Animals and plants can adapt
It hasn't warmed since 1998
Antarctica is gaining ice
View All Arguments...


Username
Password
New? Register here
Forgot your password?

Latest Posts

Archives

Muller Misinformation #1: confusing Mike's trick with hide the decline

Posted on 29 March 2011 by John Cook

The most cited 'Climategate' email is one from Phil Jones discussing a graph he produced for a World Meteorological Organization (WMO) report, where he discusses "Mike's trick" and "hide the decline". A number of misconceptions have arisen concerning this email. Unfortunately a prominent source of 'hide the decline' misinformation Professor Richard Muller from Berkeley. One of Muller's errors is confusing several separate techniques, blurring them into a single "hide the decline". Muller commits this error in a public lecture (emphasis added):

"A quote came out of the emails, these leaked emails, that said "let's use Mike's trick to hide the decline". That's the words, "let's use Mike's trick to hide the decline". Mike is Michael Mann, said "hey, trick just means mathematical trick. That's all." My response is I'm not worried about the word trick. I'm worried about the decline."

Muller uses the phrase "Mike's nature trick to hide the decline" as if it's Phil Jones's actual words. In a lecture recorded last weekend at Berkeley, Muller continues to expound on how Michael Mann's trick was used to hide the decline (emphasis added):

"What they said is "how can we hide the decline?" And the suggestion came back from Phil Jones at the UK, "Let's use Mike's trick to hide the decline". Mike's trick consisted of erasing that data, calling it unreliable, and then substituting the temperature data from thereon."

However, the original text from Phil Jone's email indicates otherwise:

"I’ve just completed Mike’s Nature trick of adding in the real temps to each series for the last 20 years (ie from 1981 onwards) and from 1961 for Keith’s to hide the decline."

It's clear that "Mike's Nature trick" is quite separate to Keith Briffa's "hide the decline". Muller has taken different sections of Phil Jone's emails and morphed them into a single phrase. To understand how this is a misleading characterisation, it's helpful to examine exactly what "Mike's Nature trick" and "hide the decline" refer to.

What does "hide the decline" refer to?

Phil Jones' email is often cited as evidence of an attempt  to "hide the decline in global temperatures". This is incorrect. The decline actually refers to a decline in tree-ring density at certain high-latitude locations since 1960. However, Muller doesn't make this error - he clearly understands that global temperatures have been rising in recent decades as indicated by the instrumental record.

Tree-ring growth has been found to match well with temperature, and hence tree-ring width and density is used to plot temperature going back hundreds of years. However, tree-rings in some high-latitude locations diverge from modern instrumental temperature records after 1960. This is known as the "divergence problem". Consequently, tree-ring data in these high-latitude locations are not considered reliable after 1960 and should not be used to represent temperature in recent decades.

In Phil Jones' original email, he refers to a graph produced for the cover of a 2000 WMO report.

WMO graph by Phil Jones

Figure 1: Northern Hemisphere temperatures were reconstructed for the past 1000 years (up to 1999) using palaeoclimatic records (tree rings, corals, ice cores, lake sediments, etc.), along with historical and long instrumental records (WMO 2000).

To construct the green line, Jones took tree-ring density data from Annual climate variability in the Holocene: interpreting the message of ancient trees (Briffa 2000). Note - the reason the paper was eventually published in 2000, not 1999, was due to a publication delay. We can see the original tree-ring density data in the figure below, taken from Briffa 2000. The green line represents Low Frequency Density (LFD) and diverges from the instrumental temperature record (the thick black line), as noted by Briffa in the caption.

Briffa tree-ring density

Figure 2: An indication of growing season temperature changes across the whole of the northern boreal forest. The LFD curve indicates low-frequency density changes. Note the recent disparity in density and measured temperatures.

In creating the WMO graph, Jones cut off the tree-ring density curve around 1960 when it diverged from instrumental temperature and grafted the instrumental temperature onto the green line. This technique has been rightly criticised for failing to distinguish between reconstructed temperature and the instrumental temperature in a graph. However, the decline in tree-ring density is not a hidden phenomena - it's been openly discussed in the peer-reviewed literature since 1995 (Jacoby 1995) and was also discussed in the IPCC Third Assessment Report (TAR) and Fourth Assessment Report (AR4).

Lastly, it bears remembering that other research finds tree-ring density is reliable before 1960. Briffa 1998 finds that tree-ring width and density show close agreement with temperature back to 1880. The high-latitude tree-rings that show divergence after 1960 also match closely with other non-diverging proxies going back to the Medieval Warm Period (Cook 2004). This indicates the divergence problem is restricted to modern times.

What is "Mike's Nature trick"?

This refers to a technique (in other words, "trick of the trade") used in a paper published in the journal Nature by lead author Michael Mann (Mann et al 1998). The "trick" is the technique of plotting recent instrumental data along with the reconstructed data. This places recent global warming trends in the context of temperature changes over longer time scales. This graph is commonly known as the hockey stick.

Mann's 1998 paper in Nature plotted temperature back to 1400 AD. The temperature reconstruction was extended back to 1000 AD and published in Mann et al 1999 which was reproduced in the IPCC Third Assessment Report (TAR). The IPCC TAR version of Mann's hockey stick is shown below:

Hockey Stick

Figure 3: Northern Hemisphere mean temperature anomaly in °C (IPCC TAR).

There is nothing secret about "Mike's trick". Both the instrumental (red) and reconstructed temperature (blue) are clearly labelled in Mann's 1998 Nature article, the follow-up Mann et al 1999 and the IPCC Third Assessment Report.

A common and broadly held misconception is that Mann's hockey stick hides the decline. There is no "decline" in Mann's reconstructions. As we shall examine shortly, the source of "the decline" come from temperature reconstructions calculated from tree-ring density at high northern latitudes (Briffa 1998). There are very few of these in Mann's proxy data and hence his reconstructions never required removal of any declining tree-ring density.

Thus it's clear that "Mike's Nature trick" has nothing to do with Briffa's "decline". There is no "decline" in Mann et al 1998 and Mann et al 1999. To conflate two separate techniques via the phrase "Mike's Nature trick to hide the decline" is adding to the glut of 'Climategate' misinformation.

0 0

Printable Version  |  Link to this page

Comments

1  2  3  4  Next

Comments 1 to 50 out of 200:

  1. I have made this comment before, but I wonder if this continual defence of Phil Jones and Michael Mann is doing more harm than good? The public know there have been several inquiries and no heads have rolled. I know deniers like McIntyre are still harping on about the e-mails (and on and on and on ....) but does it really help to issue lengthy rejoinders every time the subject comes up? It sounds defensive and plays into the belief that there is something questionable about the content of the mails. Would it be better just to say "Case Closed!" or simply shout "Boring!" and move on? PS No problem with the content of the post, which is excellent as usual. Well done, Johh, but I am concerned about the wider point above.
    0 0
  2. And did you notice how Prof. Muller [--snip--] the WMO graph by adding the legend 'Tree Ring Data'? Of course it's not a graph of 'tree ring data', it's a temperature reconstruction. Not to mention that he chose to use the relatively obscure WMO graph rather than the clearer and more widely publicized IPCC graph. To me the most ironic part of the (mis)quote was his (non)reference to "... Mike's Nature trick...", as in, the peer-reviewed journal Nature. To Prof. Muller, though, "the justification would not have survived peer review in any publication that I'm willing to publish in." Hm. (This section of the lecture is at 34:05 in the link in the main post.)
    0 0
  3. Shoyemore - the problem is that Muller seems to be trying to position himself as some sort of climate expert, and yet his lecture is absolutely riddled with fundamental mistakes and misinformation. So we think it's important, if he's going to become this go-to climate expert (he's already been invited to testify before Congress on the subject on Thursday), someone needs to keep him honest and get the facts right, even if the subject is one which has been re-treaded over and over. It's just all the worse that "experts" are still getting these facts wrong.
    0 0
  4. And for the record, as a Berkeley alumn myself, it really irritates me how fast and loose Muller is playing with the facts, to put it nicely. He's not representing the university well at all.
    0 0
  5. For those trying to keep the various issues separate, there seems to be at least three. 1. Splicing instrumental data onto the end of tree ring based temperature reconstructions for the WMO cover. 2. Deleting post 1960 data, both WMO cover and peer reviewed papers. 3. Deleting the pre-1550 data in Briffa and Osborne 1999 article in Science and other peer reviewed articles. There may be others, but those seem to be the main ones. An example of item #3 is the annotated version of Briffa and Osborne Figure 1 from Science 1999 article. 
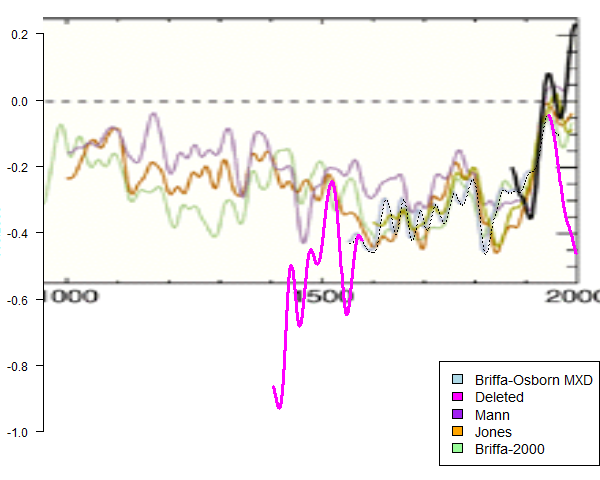
For more discussion, see Hide the Decline, Science magazine version
    0 0
  6. Shoyemore#1 I think it's important for non-scientists like me to be Absolutely Clear In Our Minds about matters that are likely to be thrown at us in conversations and on-line. We can't fall back on something like a denialist mantra - just reciting and repeating a form of words. As it happens, we're all different. Some things turn on the lightbulb for me that leave others bemused or confused. Many people need, as any teacher knows, several exposures and different explanations before all the elements fall into place for everyone. At =that= point, further details or work or discussion are needed to get the student or interested person to understand well enough to be able to describe or discuss the issue or the phenomenon in their own words. It's not enough to get it. You have to 'own' it in a form suitable to share. So I'd disagree. It might be old hat or boring to someone who's been involved for a long time. For novices or those who've only just begun to grasp why there's a fuss about a particular matter, a new reference or an explanation in a new form of words might be just the ticket.
    0 0
  7. Unfortunately for the [--snip--], even Muller's own BEST study appears poised to confirm everyone else's temperature reconstructions:
    Their preliminary results sit right within the results of NOAA, NASA, and HadCRU, confirming that prior analyses were correct in every way that matters. Their results confirm the reality of global warming and support in all essential respects the historical temperature analyses of the NOAA, NASA, and HadCRU.
    Kind of moots the whole hide the decline non-issue. http://climateprogress.org/2011/03/20/berkeley-temperature-study-results-global-warming/
    0 0
  8. Besides playing fast and loose with the facts, Muller’s presentation utilizes the Wattsoid technique of carefully crafting straw men from the worst of the MSM.
    0 0
  9. John, Dana, Thank you very much for your hard work in the area of separating the truth from….other. It would appear to me that this (Muller Misinformation #1: confusing Mike's trick with hide the decline) is an ongoing series concerning Muller’s upcoming anticipated presentation before congress. I humbly suggest that you hold off on critiquing him until after he has exposed himself to congress. Don’t help him polish his presentation or find new ways to deceitfully misrepresent the science. Suggestion for the next person who watches the Berkeley video: Count the times Muller says he thinks climate change is a problem (I don’t want to watch it again). Thanks again, arch
    0 0
  10. Arch - thanks, but we'd prefer if Muller began examining the facts more carefully, particularly when speaking to Congress. This is meant as motivation for Muller to start being more careful and accurate with his statements.
    0 0
  11. Charlie A:
    An example of item #3 is the annotated version of Briffa and Osborne Figure 1 from Science 1999 article.
    Let me see if if I get this right: they discard proxy data that doesn't calibrate with the modern temperature record and proxy data that doesn't calibrate with proxy data pre-1550. This seems like the right thing to do, indeed. D'oh.
    0 0
  12. This is exactly the kind of information a non scientific person like myself needs to see to de-jigsaw puzzle the stuff that makes me so suspicious. Thank-you. Why was muller [--snip--] things.? To increase potency of his skeptical argument it would seem. That is the ongoing problem for us average Joes. Too many [--snip--] written in scientific language.(thinking non scientific folk are too stupid perhaps) And I hope Muller knows he is being held accountable for what he says as should all in this debate. I hope you realize just how important your site is.Thanks again.
    0 0
  13. Dana (10) I hope he does also. Keep up the good work.
    0 0
  14. Charlie A at 10:26 AM on 29 March, 2011 "3. Deleting the pre-1550 data in Briffa and Osborne 1999 article in Science and other peer reviewed articles." I don't think going to climate audit will give you the best opinion on this subject. They seem to believe that not showing data where the sample density is too low and the spatial distribution is low equates to a "trick". What they don't tell you is that going back to 1400 there are only 8 proxies so they do not include the data past 1550 because of the substantial reduction in the number of proxies. An example I can point to is here: http://treesfortheforest.files.wordpress.com/2010/05/ghcn_global_temp_area_1961-1990_5x51.png Are scientists "hiding the decline" by not using data going past 1880s in global temperature records? Of course not, the distribution is not accurate. Using less data=noisier data and the authors chose to show when they had confidence in their datasets. No story here.
    0 0
  15. If the proxy data didn't correlate with temperature data after 1960, then why did Briffa make the claim that the tree proxy data was in error without looking at a possible error in the instrument data? From the paper here there were many theories floated as to why the tree ring data diverges after 1960 but many of them point to a drought condition. Other suggestions include global dimming, polution, strataspheric ozone levels, insect infestation, etc. While all of these might be real, that is a fairly complex set of conditions that must come together to cause this error and surely another obvious answer could come from the temperature measurements. Maybe this was thouroughly investigated and shown not to be a cause in a paper and if someone has a link to that I'd appreciate you sharing it. This graph from that paper also highlights the divergence over the last couple of decades. And correct me if I'm wrong but over the past couple of decades we've seen a large drop out of the number of weather stations, especially in the northern latitudes where the tree ring data diverges. Could this be another possible explanation? How close were the temperature stations to the tree ring samples? Were they at similar elevations and does that matter? #14 Robert Way - If 8 data points aren't sufficient to justify a large enough sample size why is it ok to have 8 data points (i.e. temperature stations) to represent a global region composed of a circle with a 1,500 km radius (which is what the GISS data does for the north pole area)? If you look at the dark red area on the picture below and then go click on the center of that region on the GISS site you'll only find 8 sites that have continuous measurements over the past several decades.
    0 0
    Moderator Response: If you want to discuss the reliability of the temperature record, please take your discussion to the temperature record thread.
  16. #14 Robert Way says @13:48 29 March "What they don't tell you is that going back to 1400 there are only 8 proxies so they do not include the data past 1550 because of the substantial reduction in the number of proxies" So why two years later in 2001 does Briffa choose to show a similar reconstruction extending back to 1400, with only 2 (TWO!) sites in 1402, 8 sites in 1500 and 19 sites in 1550? Perhaps because this reconstruction came out as desired? Figure 2. From Briffa et al 2001 (JGR) Plate 3, also showing the pre-deletion data used in Briffa-Osborn 1999 (magenta). The Briffa 2001 version ends in 1960 and has been extended using data from Climategate emails (showing the decline). ref: HIde the Decline, the Other Deletion
    0 0
  17. garythompson at 14:52 PM on 29 March, 2011 This is the spatial distribution of proxies from the CA stuff pre-1500 http://www.skepticalscience.com/pics/Sites.png If you call that an adequate spatial distribution then you are fooling yourself. 87% of pre-1500s data comes from 2/5 regions from the study. It is obvious to those who pay attention that this is a good reason to consider that the reconstruction pre-1500 does not accurately represent the entire region. Furthermore, show me the 8 station to which you refer? I can count more than 8 on greenland alone so tell me where you get these numbers? Actually you're also wrong on the 1500 km part, it is 1200 km not 1500 so get your facts straight. Also consider that stations at high latitudes are highly correlated (0.5) at 1200 km as presented by Hansen and Lebedeff (1987). Finally, the assessment presented by GISS is supported by NCEP Reanalysis, and ECMWF reanalysis datasets which include satellite, weather balloon and station data. NCEP in fact shows greater warming than GISS (supplemented by Environment Canada stations) as shown in my previous post. http://www.skepticalscience.com/pics/ArcticTC1880-2010NCEP.png Your argument is just wrong. Sorry.
    0 0
  18. Charlie A #16 - please take a look at the site Comments Policy, particularly the very first policy - no accusations of deception. This is actually my biggest beef with McIntyre and co. If you want to know why Briffa made a certain decision, why not try, hmm, I dunno, asking Briffa? Instead of immediately leaping to the conclusion that he's "hiding" something, or only showing data when it comes out "as desired". Personally I find that when people assume others are dishonest, they're projecting their own behavior.
    0 0
  19. For you Charlie A, More support for my interpretation from Briffa 2001 “Bias might be introduced in cases where the spatial coverage is not uniform (e.g., of the 24 original chronologies with data back to 1500, half are concentrated in eastern Siberia) but this can be reduced by prior averaging of the chronologies into regional series (as was done in the previous section)… Eight different methods have been used… They produce very similar results for the post-1700 period… They exhibit fairly dramatic differences, however, in the magnitude of multidecadal variability prior to 1700… highlighting the sensitivity of the reconstruction to the methodology used, once the number of regions with data, and the reliability of each regional reconstruction, begin to decrease. The selection of a single reconstruction of the ALL temperature series is clearly somewhat arbitrary… The method that produces the best fit in the calibration period is principal component regression… “…we note that the 1450s were much cooler in all of the other (i.e., not PCA regression) methods of producing this curve…”
    0 0
  20. sorry but (again), something is still unclear for me : what is the calibration period and what is the validation period of Briffa's dendro series ?
    0 0
  21. Dana1981, #3 I have watched Muller in action twice on video, and both times found myself fuming at his misinformation and calumnies against other scientists. I also noted his obvious ego-driven presentation and love of the spotlight. Here is someone who not only wants to undermine Jim Hansen, he wants to BE Jim Hansen or be the new Hansen figure. On the credit side, Muller correctly identifies anthropogenic climate change as a major threat. But the way he uses his scientific disagreements as cloaks for personal attacks is unacceptable. He certainly deserves refutation on his many "errors" (deliberate or otherwise), more so than Monckton. I would just not have started with this point! I think the Mann-Jones issue has been thrashed to death and few people will be swayed either way by coverage of old ground.
    0 0
  22. There are other examples of the term "trick" being used in the emails, which denialists oh so conveniently ignore even when, as they themselves say, they have read the emails in their entirety. This one explains quite clearly what a trick is... #1200162026 “I would note that the distribution of rejection rates is like the distribution of precipitation in that it is bounded by zero. A quick-and-dirty way to explore this possibility using a “trick” used with precipitation data is to apply a square root transformation to the rejection rates, average these, then reverse transform the average. The square root transformation should yield data that is more nearly Gaussian than the untransformed data.” Perhaps Dr Muller would like to accuse the sender of that email of something ansty.
    0 0
  23. adelady, #6, Different strokes, I guess. I just refer people to Skeptical Science whenever this comes up!!
    0 0
  24. J. Bowers #22, I read your post just as I was putting Christopher M. Bishop's tome Pattern Recognition and Machine Learning (Springer, 2006) into my briefcase. In the index under "k" is kernel trick, 292. The page elaborates "The concept of a kernel formulated as an inner product in a feature space allows us to build extensions of many well known algorithms by making use of the kernel trick, also known as kernel substitution." Bishop is an employee of Microsoft, and I am sure no one is going to accuse him (or anyone who uses the kernel trick) of scientific skulduggery.
    0 0
  25. 22 : the problem is not in the use of the word "trick", it is in the fact that data have been deleted when they could have shed some doubt about the validity of the method. I assume that everybody who supports faithfully the use of dendro data knows perfectly the answer to question #20 - but i don't, may I have this answer ?
    0 0
    Moderator Response: [Dikran Marsupial] If there is good reason to believe data is unreliable, it is standard statistical operating procedure to exclude it from the analysis (c.f. outliers). The problem with the data is openly discussed in the litterature, and whether you mention it or not depends on the level of detail appropriate for the particular discussion - those who want to look into it in more detail can find out about the divergence problem by following the references given in the report. That is what the references are for. The divergence problem doesn't cast doubt on the method, only on the reliability of the method for the recent period covered by the "divergence problem".
  26. One note. According to the latest research does not exist - however - something like: "divergence problem". A critical evaluation of multi-proxy dendroclimatology in northern Finland, McCarroll et al., 2011.: “Of the individual proxies, δ13C performs best, followed by maximum density. Combining δ13C and maximum density strengthens the climate signal but adding ring widths leads to little improvement. Blue intensity, an inexpensive alternative to X-ray densitometry, is shown to perform similarly. Multi-proxy reconstruction of summer temperatures from a single site produces strong correlations with gridded climate data over most of northern Fennoscandia.” Spatial and temporal stability of the climatic signal in northern Fennoscandian pine tree-ring width and maximum density, Tuovinen et al., 2009.: “At all four sites, the correlation between maximum density and June to August mean temperature is lowest in the latter half of the 20th century, but split sample tests with strong verification statistics (RE and CE) show that this represents a quantitative change in the strength of the correlation with climate, rather than a qualitative change in the nature of that relationship, and thus does not invalidate climate reconstructions.” In many regions, the high-latitude NH the “modern warming” - it is just very small ... However, tree-rings in some high-latitude locations diverge from modern instrumental temperature records after 1960. - so: this sentence, that is - quite simply - wrong. P.S. By the way tree rings (the stable carbon isotope ratios of pine treerings) talks a lot about the reasons for the old warming: Cloud response to summer temperatures in Fennoscandia over the last thousand years, Gagen et al., 2011.: “A negative shortwave cloud feedback is indicated at high latitude. A millennial climate simulation suggests that regionally low temperatures during the LIA were mostly maintained by a weaker greenhouse effect due to lower humidity.” Not a word about CO2 ... So the question arises: who "sows" disinformation more ...
    0 0
  27. No matter how 'hide the decline' is rationalized by the details of the 'trick', the issue here is **intent**. And the intent is clear - to 'hide'. To hide what?? 'The decline' - a piece of proxy temperature data which did not fit with instrumental temperatures which were rising - not declining. Overheard private conversations (or emails) have a strong ring of truth. The players here wanted to 'hide' a bit of data (whatever its quality) which did not fit the script. When this is accepted as the only logical explanation for using the term 'hide' - then one has to ask why leaders in their field of science would need to do that. One explanation is that they really believed that their case was already weaker than they would like and any contradictory data needed to be 'hidden'. Another is the judgement that the public must be shown a consistent story and hiding the dubious data is justified on that basis. Either way, the intent to 'hide' anything in a scientific publication is a perversion of the scientific method.
    0 0
  28. My apologies for being OT on the last portion of my post here. I have taken that discussion as well as the answer to Robert Way's question about the 1,500 km and the number of stations to the proper page.
    0 0
  29. Under the title of "Hide the Decline" Steve McIntyre blogged a few days ago that Briffa and Osborn deleted some data from their 1999 Science article. So far only McIntyre and WUWT and have written about this, and their posts have made understanding the science behind this unsuccessful. I wonder is this is related? Do you intend to address this?
    0 0
  30. Dennis@29: Nick Stokes has just done a useful post on this at http://moyhu.blogspot.com/.
    0 0
  31. Ken@27: If your'e reconstructing a temperature record and you looked at your temp proxy data -- from tree rings or whatever else -- and found that it did not agree with instrumental data for the same period, which would you present to the world as the most likely accurate representation of temperature? Replace "hide the decline" with "hide the inaccurate data." Clearly the intent is to present the most accurate depiction. The proxy doesn't agree with the actual measurements -- so why present the proxy? It's a reconstruction of a long period. Use the most accurate data for each portion of the timeline. Further, this reconstruction as been replicated with more than two dozen other proxy reconstructions (with error bars, of course). Good grief! There's a difference between seeking honest clarification and being deliberately obtuse. In my mind, those who refuse to acknowledge that, while the phrasing in the email may not have been perfect, the intent is utterly clear in context.
    0 0
  32. Yeah I don't think there is any rationalizing the "hide the decline" comment. The fact that they told each other to delete emails is too incriminating.
    0 0
  33. Ken @ 27... You seem to forget that the issue of post 1960 tree ring divergence ("the decline") is discussed openly in the literature. If you are objecting that the scientists are hiding something and accusing them of "perversion of the scientific method" as you are... well I have to say they aren't doing a very good job of hiding anything by publishing papers on it. And how publishing papers on something you are supposedly hiding is a perversion of the scientific method... you're going to have to explain that one to me.
    0 0
  34. Jay @ 32... Hm, but no emails were deleted. Those damn scientists just can do anything right.
    0 0
  35. I honestly do not think that "skeptics" or deniers of AGW on this thread have even bothered to invest some time reading the main post. Let me help, it is about Muller conflating certain issues, getting horribly confused and consequently drawing demonstrably false conclusions. Sadly, quite typical behaviour of most "skeptics" it seems. In the absence of any evidence to the contrary, I can only conclude that the "skeptics" on this thread support Muller's errors and his propagation of said errors/misinformation. Worse yet, they are now trying to use this thread to uncritically propagate yet more misinformation and innuendo, about papers written more than a decade ago, sourced at disreputable "skeptic" blogs such as CA. The divergence issue has been explained ad nauseum to the "skeptics" since the emails were hacked back in late 2009. Now in the spring of 2011 (!) they apparently are (quite unbelievably) still incapable of grasping the science and facts of this particular matter. Moderators : Please, I urge you to limit the discussion on this thread to Muller's faux pas, nothing more, nothing less, otherwise "skeptics" will hi-jack this thread and it will degenerate into a circus-- alas it may be too late.
    0 0
  36. Sorry Rob, Eugene Wahl said he did. Furthermore, do you have full access to Michael Mann's computer? That's a pretty arrogant claim to make that he didn't delete any emails unless you are privy to special knowledge which wouldn't surprise me.
    0 0
    Moderator Response: [muoncounter] Accusations of arrogance are pushing the envelope towards deletion.
  37. "A common and broadly held misconception is that Mann's hockey stick hides the decline. There is no "decline" in Mann's reconstructions." Yeah okay, there's no decline if you believe the MWP was not as warm as today's temperatures. I believe the MWP was warmer than the current temperatures so I see a pretty big discrepancy.
    0 0
    Moderator Response: [DB] "I believe the MWP was warmer than the current temperatures" Please take discussion of the MWP to a more appropriate thread.
  38. Dr. Cadbury, With respect, you are wildly off topic and now engaging in innuendo. Are you here to defend Muller (who is the subject of this thread)? Either defend Muller or concede that he is wrong, or please take your OT discussion elsewhere. Sincerely, Dr. Albatross, PhD Meteorology :)
    0 0
  39. @Albatross, @moderator I think this is the best moderated climate site by a long shot. I appreciate and respect that even though many of my comments are in opposition to the moderator's viewpoints, they allow me to post and provide feedback on what they want me to avoid posting. Albatross, I hope your comment was not aimed at me. I'm not trying to hijack anything. I think it is good that 2 opposites like ourselves can come here and analyze the information for ourselves.
    0 0
  40. Albatross I am not going to attack or defend anybody. I think everyone has had a different perspective on this topic. I think if Mann and his colleagues had a second chance, they would have approached the issue in a different way.
    0 0
    Moderator Response: [DB] No more on the MWP or Mann on this thread. See Albatross' links in the next comment for direction if you wish to pursue your interest.
  41. Dr. Cadbury @37, You continue to remain off topic. The MWP has been discussed here, and here, and here
    0 0
  42. Okay Albatross. So I see that Muller paraphrased a quote and tried to connect 2 of the emails together as part of the same. So he is mistaken in this instance. What do you think though? I noticed all your doing is complaining that I am off topic.
    0 0
  43. @dhogaza What are you referring to? What is item 3?
    0 0
    Moderator Response: [DB] He was referring to Charlie A's comment earlier in this thread.
  44. Please, Dr. Albatross, we Drs. are very important and all knowing are we not ?:) And please spare us the attempt at sincerity-- you have been "attacking" Mann on this thread and going off topic. Are you familiar with the term "concern troll" Dr. Cadbury? You and Muller are entitled to you own opinions, but not your own facts. As it happens the reality and the facts show that Muller is wrong. Sad that you and other "skeptics" cannot, will not recognize that.
    0 0
  45. Dr. Cadbury, I agree with John Cook, who invested a lot of time researching this story to unravel Muller's confusion and to get the facts straight. I might suggest that you do the same using the helpful search function on the top LHS of the page. Muller's confusion and misdeeds run deeper than the (equivocal) concession that you have just made @42.
    0 0
  46. The problem with this sort of analysis is that it doesn't really matter to most 'skeptics'. Think about it. Let's pretend for the moment that Muller's claim of Mann having used a 'trick to hide the decline' were completely true in all its nefarious implications. Applying logic we would then conclude that this was evidence that Mann was not to be trusted and we should question his work... but in doing so we would then examine other results and discover that every paleo-temperature reconstruction done since, even those by 'skeptics' who denounce him venomously, validates the original 'hockey stick' results. Ergo, a >logical< approach would lead us to the conclusion that even if Mann was a complete fraud it would have no impact on global warming science, because all available studies confirm Mann's results. Yet skeptics will insist both that Mann is a fraud (despite this accusation being groundless) and that therefor the 'hockey stick' and indeed global warming as a whole must also be frauds... even though all his contributions have been independently confirmed many times over. This is not logical reasoning, but rather emotional reasoning. Thus, no amount of proof of misdeeds on Muller's part or innocence on Mann's is going to make a bit of difference. If logic worked then the fact that Mann's work has been confirmed would already have made this a non-issue. That said, there is still value in documenting false statements by the 'skeptics' because it allows people who do use logic to see that once you eliminate 'skeptics' spreading misinformation there aren't any skeptics left. However, in the long run we're going to have to come up with a way to address the people who 'think' emotionally. Otherwise they'll still be debating global warming at their Antarctic beachfront property.
    0 0
  47. CBDunkerson @46, A great synthesis of a sad situation. Appeal to emotion is what Muller is trying to do here.
    0 0
  48. Dennis #29 - we're looking into McIntyre's claims and may do a blog post on the subject. It's a complicated issue, and unlike certain other blogs, we prefer to get the facts straight before posting about them.
    0 0
  49. CBDunkerson, even granting arguendo that you are correct the reason this is still a big deal is that it speaks to the credibility of the climate science community. I don't think that a reasonable person can look at the use of trees as temperature proxies and conclude that they are very poor proxies that should not be used in reconstructions. The issue for the non-climate science community is why do we need to rely on outsiders to find this sort of stuff? An effective scientific community would go to great pains to make sure that EVERY time this work is discussed that the flaws with it are also pointed out. Clearly, this has been a major failure on the part of the mainstream climate community. Many supporters of the mainstream position want to have it both ways - essentially saying that one should accept the consensus position even though said consensus does not have a vigorous self-policing function. Cheers, :)
    0 0
  50. shawnhet: "it speaks to the credibility of the climate science community." Precisely the sort of thing I was talking about. The supposed actions of two or three people speak to the credibility of thousands of researchers all over the planet? Calls into question science stretching back about two hundred years? That isn't logical. The only basis for such a claim is emotional... 'if we can paint one of them as wrong then the whole thing must be a fraud'. "The issue for the non-climate science community is why do we need to rely on outsiders to find this sort of stuff?" Because people who would lie and misrepresent Jone's e-mail in the way that Muller has are inherently going to be 'outsiders'? "An effective scientific community would go to great pains to make sure that EVERY time this work is discussed that the flaws with it are also pointed out. Clearly, this has been a major failure on the part of the mainstream climate community." Given that they do go to great pains to point out flaws and limitations I'm sorry but that is just untrue. Climate science has extensive self-checking and policing. You'll note that even 'skeptics' like Lindzen and Spencer are taken seriously and studied even after they have been found to have shown clear biases and false statements... because they are at least doing actual research and presenting actual theories which can be checked and evaluated as part of the ongoing process. After those there are large numbers of actual skeptics (no 'square quotes') who continually challenge various parameters and findings of the science. Thus we get different views on, for instance, how much mass loss Greenland is experiencing and further study is performed to figure out who is right. This claim that 'climate scientists are all in lockstep and do not check each other' is just another flat out deception that the 'skeptics' spread. There are constant disputes and re-evaluations going on in climate science... on the matters which haven't been settled by overwhelming evidence. The problem for the 'skeptics' is those areas of remaining doubt are vastly smaller than they would like to pretend.
    0 0

1  2  3  4  Next

You need to be logged in to post a comment. Login via the left margin or if you're new, register here.


The Consensus Project Website

THE ESCALATOR

(free to republish)


© Copyright 2024 John Cook
Home | Translations | About Us | Privacy | Contact Us