


 Arguments


Sea Level Isn't Level: This Elastic Earth
Posted on 18 August 2012 by Rob Painting
Continued from: North Carolina Lawmakers Turning a Blind Eye to Sea Level Reality?
Although sea level rise might, at first glance, seem to be a relatively easy subject to grasp, much of the misunderstanding that exists in the blogosphere (and elsewhere) can be put down to the flawed notion that the sea behaves like water in a swimming pool, or bathtub. In reality the Earth's surface (lithosphere) is elastic and deformable which contributes to a complicated picture where local sea level might be somewhat different than the global sea level trend. In order to make sense of this it's necessary to cover some of the fundamentals of sea level rise - starting with Glacial Isostatic Adjustment (GIA).
What is Glacial Isostatic Adjustment?
The term describes the deformation of Earth's surface from the growth and decay of giant ice sheets over time, or more specifically, from the exchange of mass, in the form of water or ice, between the continents and ocean during the ice age cycles. The planet-wide changes which result from this loading and unloading are due to the Earth's lithosphere wanting to reach equilibrium (isostasy).
In the last several million years the Earth's climate has been dominated by the ice age cycles - alternating cold and warm periods driven by small changes in Earth's orbit and tilt as it circles the sun. During the much longer cool periods (glacials) global temperature dropped sufficiently for gigantic ice sheets to grow upon Antarctica and the Northern Hemsiphere land masses. As water was evaporated off the ocean and dumped upon the colder land masses (at, or near the poles) in the form of snow, this in turn lowered global sea level.
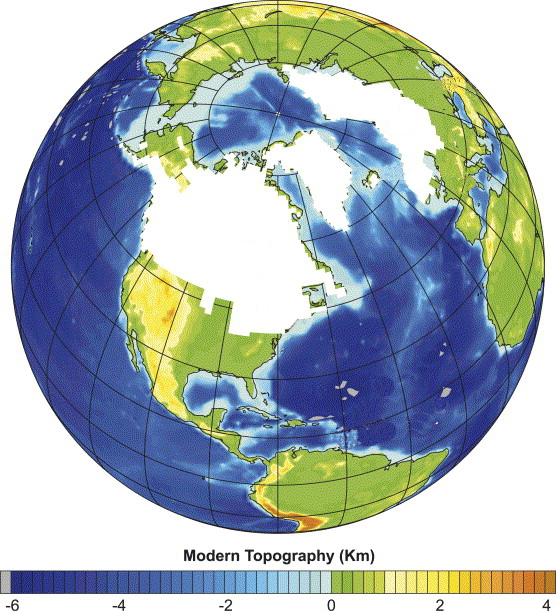
Figure 1 - Ice sheet coverage (white) at the last ice age maximum. Image adapted from Peltier & Fairbanks (2006).
At the height of the last ice age (glacial maximum) global sea levels were a remarkable 120 metres lower than today (Clark & Mix [2002], Peltier [2002]) . For comparison, at most there is around 65-70 metres worth of global sea level rise volume currently locked up in the ice sheets of Greenland and Antarctica, so the ancient ice sheets were much larger than the land-based ice which currently remains. The vast Laurentide ice sheet which once sat over modern-day Canada, was at least 3 kilometres thick at its highest point (Dyke [2002], Peltier [2004]), and contained around 80 metres of global sea level volume, which gives some idea of how enormous it was.
During the warm intervals (interglacials - such as today) the giant ice sheets began to disintegrate and melt, losing mass. Not only did Antarctica and Greenland lose a lot of ice, but the great Laurentide and Fennoscandian (Northern Europe) ice sheets disappeared entirely. The upshot of these changes is so significant that the long-vanished ice sheets, from the last glacial maximum, are still affecting global sea level rise today, some 7-8000 years after their demise.

Figure 2 - animation (by Skeptical Science's jg) depicting the local effects of the growth and decay of a giant ice sheet. The curvature of the depression under the ice sheet is exaggerated in the animation, but is a function of the local thickness of the Earth's crust. Animation is definitely not to scale.
Of ice, isostasy and viscosity
The physical characteristics of the solid rocky surface of Earth change as one descends down toward the centre of the planet. With increasing pressure and temperature the Earth layer behaves less like a solid material, becomes more plastic, and eventually transitions to a more fluid-like one. In essence the outer rocky shell of the Earth is floating upon the malleable and fluid layers beneath.
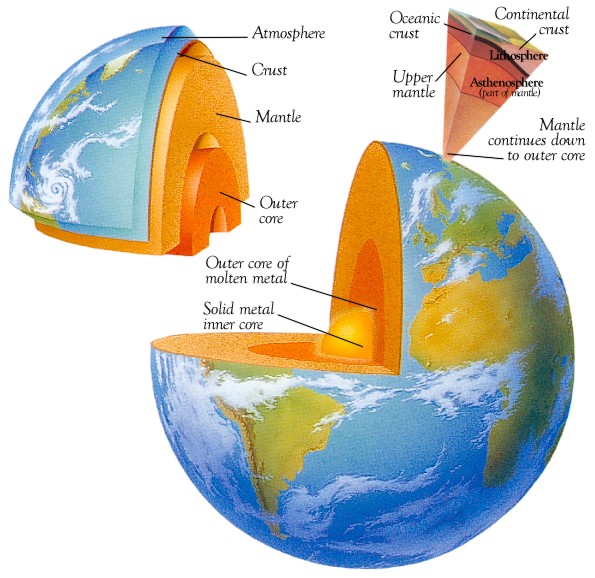
Figure 3 - Cut-away illustration of the Earth layers. Image via library thinkquest org
Isostasy can be understood by considering Archimedes Principle which, simplified, means that the weight of a body, or object, immersed in a fluid displaces an equal weight of fluid. Loading the Earth surface with a giant ice sheet therefore causes the upper solid layers to sink down and displace the viscous layer below. If one considers the typical densities for ice and the mantle (i.e the equivalents in terms of weight), the 3 kilometre-thick portions of the Laurentide ice sheet would have depressed the Earth beneath them almost a kilometre.
As in the reverse of Archimedes Principle, the removal of the loading as the ice sheets melted allowed the Earth surface to return toward its former state. This is a long drawn out process due to the viscosity of the mantle, and explains why de-glaciation models incorporate the contributions of viscosity and elasticity in simulating the Earth response to ice loading/unloading.
A pressing issue - analogy time
The combination of the crust's flexibility and rigidity and the sideways displacement of plastic mantle gives rise to the crustal deformation shown in figure 2. With sufficient loading of ice mass, the crust flexes downward underneath the icesheet, displacing the malleable rock beneath it and, because of the crust's flexural strength, areas around the periphery of this icesheet are levered upward a little.
One way to appreciate this ice sheet-levering phenomenon, and the role the crust's rigidity plays in it, is to place two drinking glasses and a plastic/wooden ruler on your desktop, or table. Support the ruler at each end with the glasses and then gently push down on the middle which is unsupported. Now, assuming you haven't gotten carried away with the pressure applied and have broken the ruler, what you will observe is that the ends of the ruler are levered upwards.
It's not worth obsessing over the physical details of this, but a similar mechanism is at work in the Earth's crust. The giant ice sheets which formed during the ice ages levered up the regions just outside the ice sheet-loading, and with the ice sheets now gone, these regions are still slowly sinking - returning to their pre-ice age state. The entirety of the contiguous United States is one such region of crustal subsidence (see figure 1 in Horton [2009]), and due to this subsidence relative sea levels are rising in the US, England, and the Netherlands, regardless of any human-caused climate change effects.
Post glacial rebound from the last ice age is still occuring
The important point to note here is one of time scales. Although this warping of the Earth's crust by ice loading takes place over many thousands of years in the same way it takes for the giant ice sheets to grow, the post glacial rebound (the unloading phase) occurs over many thousands of years too - quickly at first, but gradually slowing over time. This rebound phase goes on long after the ice sheets have vanished, the length of which depends on how viscous is the nature of the Earth's mantle (Peltier [1996], Paulson [2007]). It is generally thought to be in excess of twenty thousand years before equilibrium is reached.
As might be expected, uplift is taking place today in ice-loaded regions that are currently losing ice - a whopping 39mm of rise per year in parts of South American Patagonia for instance, but uplift is also still able to be observed where the giant Laurentide and Fennscandian ice sheets once were. By piecing together satellite measurements it is possible to construct a topographical-like map of this process, and thereby identify where the greatest concentration of ice mass once was at the peak of the last ice age (eg Johansson [2002]) This, however, is no simple task. Amongst other contaminating influences, modern-day exchanges of ice and water mass are superimposed on top of the post glacial rebound muddying the picture. But once these complications are accounted for the following trend emerges:
Figure 4 - rates of crustal uplift (Glacial Isostatic Adjustment/postglacial rebound) based on data and modeling from Paulson (2007).
This post has focused only on one aspect of Glacial Isostatic Adjustment - the downward flexing of the Earth's crust in the vicinity of loading by giant ice sheets, but there's much more to the story than that.
Next: Ocean siphoning, levered continents and the Holocene sea level highstand


 0
0  0
0


Comments