


 Arguments


Watts, Surface Stations and BEST
Posted on 4 November 2011 by logicman
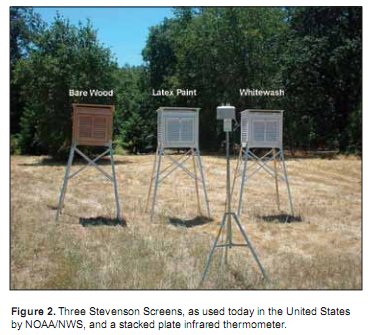
The Berkeley Earth Surface Temperature (BEST) project - was set up to address criticisms of land temperature records. It has been known since its invention that when using a thermometer to record weather, siting is of vital importance. It was also known that a thermometer could not measure air temperature accurately unless it was shielded from precipitation and direct sunlight. One device used to shield thermometers is the Stevenson Screen.
Stevenson Screens need to be mounted in locations where they are in ambient air with the thermometer bulb or other sensor 2 meters above the ground. There are various other norms: such as ensuring the door opens away from the Sun.
The so-called surface temperature stations actually record near-surface air temperatures. As early as 1938, G.S. Callender, in writing of the effects on temperature of atmospheric CO2, made it clear that the siting and quality of surface temperature stations must be considered.
The most comprehensive survey of alleged flaws - microsite influences - in the construction and siting of surface stations is the SurfaceStations.org project begun by meteorologist Anthony Watts. in cooperation with Dr. Roger Pielke Sr. In a 2009 article published by the Heartland Institute think tank, Watts claimed to show that US surface station records could not be relied on, so why trust any others?
"The reliability of data used to document temperature trends is of great importance in this debate. We can't know for sure if global warming is a problem if we can't trust the data."
'Debate' is a contest of orators: science is a contest of evidence. Watts ignores how scientists handle the data: using strong statistical techniques to remove bias. A study using Watts' own data - Menne 2010 - found that station exposure does not play an obvious role in temperature trends, the same conclusion reached by a team including Watts in a later paper, Fall et al 2011.
Most recently, the Berkeley Earth Surface Temperature Project re-examined the surface station data. Four papers have been published on the BEST web site with all the data and software code so anyone can check.
Watts is on record as having said that he would accept the results of the BEST study. This is what he posted in his own blog:
Briggs on Berkeley’s forthcoming BEST surface temperature record, plus my thoughts from my visit there
Posted on March 6, 2011 by Anthony Watts
... I’m prepared to accept whatever result they produce, even if it proves my premise wrong. I’m taking this bold step because the method has promise. So let’s not pay attention to the little yippers who want to tear it down before they even see the results.
Anthony Watts' response to this very high degree of transparency is that the papers are of no value because they have not been peer reviewed: we agree with Watts that you should be sceptical of non-peer reviewed work, and wish he would apply this scepticism elsewhere, even to things he wants to believe. In the case of BEST the criticism is not warranted: the papers are in peer review and are available on the web so that more people can assist in improving their quality. Watts et al’s criticism has mostly been to insult the authors, as noted here at SkS, rather than help with public reviewing.
Is there a real problem with surface stations?
Judging from Watts' writings on his surface stations project, it seems common sense to him that badly sited surface stations will produce bad data. However, independent studies have shown that the sites studied by Watts and his volunteers do not affect the finding of a real global warming trend. Which is most likely to be flawed, the data, or ‘common sense’? Let’s critically examine the assertions made in Watts' 2009 article Is The US Surface Temperature Record Reliable?
On the front page of the pdf, Watts asks two questions:
"Is the U.S. Surface Temperature Record Reliable?"
"How do we know global warming is a problem if we can't trust the U.S. temperature record?"
The 2nd question carries the implication that if the US temperature record is unreliable, then global warming isn't happening. Is it possible that Watts' intention is to disprove global warming? If so, is it possible that in his pursuit of station bias he fails to take precautions against observer bias?
Early in the paper Watts compares three different coatings on Stevenson Screens and finds a difference.
"This test showed that changes to the surface coatings did make a difference in the temperatures recorded in these standard thermometer shelters, shown in Figure 3. I found a 0.3° F difference in maximum temperature and a 0.8° F difference in minimum temperature between the whitewash- and latex-painted screens. This is a big difference, especially when we consider that the concern over anthropogenic global warming was triggered by what these stations reported was an increase of about 1 .2° F over the entire twentieth century."
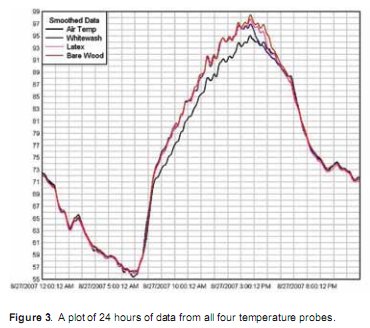
The graph shows a record of actual temperatures over a 24 hour period. Watts compares these temperatures to an entire century of recorded trend, i.e. temperature change.
The experiment was a single study of one sample of each coating type in a single location over a single day. Watts went on to check temperature stations near his home.
"... there were three stations near my town of Chico, California within easy driving distance. I set out to check the paint on the Stevenson Screens at these locations to see if they had indeed been converted to latex from whitewash. The first station, at the Chico University Experiment Farm, had been converted to latex, but it also contained a surprise. It had two screens, one of which was converted to automated radio reporting. I was surprised to find NWS had installed the radio electronics just inches from the temperature sensor, inside the screen, (See Figure 4.) Surely this station's temperature readings would be higher than the actual temperature of ambient air outside the screen."
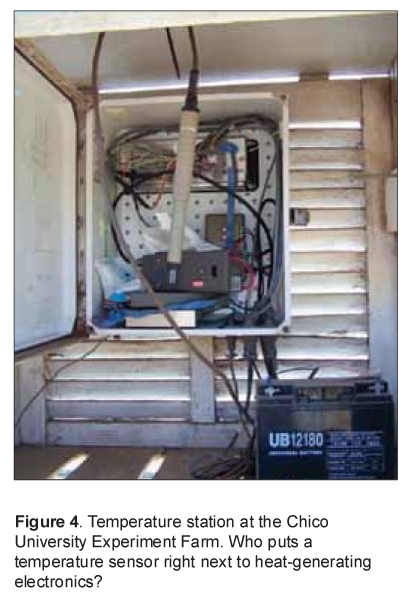
To the casual observer, this image shows a temperature probe hanging next to some electronic components. It is obvious that the NEMA box has been opened by or for the photographer. When the box is closed, the probe is not inside but some 6 to 8 inches away, as noted by Watts in his own site survey. The probe is held in place by what looks like a tie-wrap, so that the sensing tip is at the center of volume of the Stevenson Screen. The chance that the temperature measured by the probe will be significantly affected by the trivial heat dissipation of electronic components in a sealed box some inches away is likely to be vanishingly small.
The rest of Watts' article consists of descriptions and photographs of what he considers to be factors which will influence temperature records. He includes some false color infra-red photographs to draw attention to heat sources near thermometers.
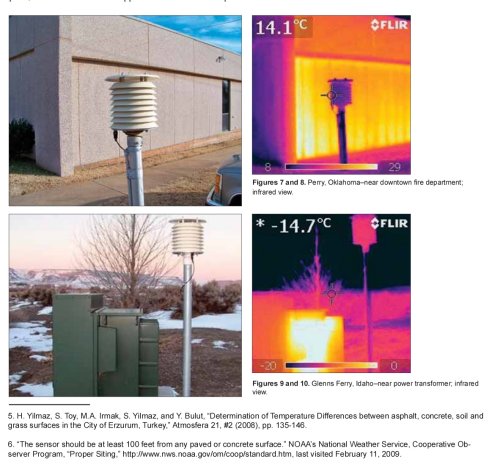
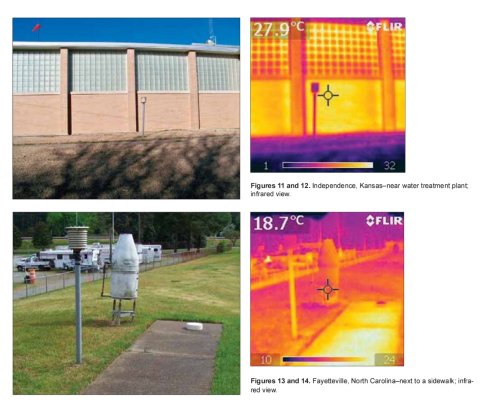
Rather than draw readers' attention to the hot spots, I would invite readers to compare the color (temperature) of the instrument housing with the color (temperature) of the general surroundings. In each case, the temperature station casing is - despite being near a source of heat - at the same temperature as the nearby land.
The whole purpose in screening a temperature sensor is to shield it from radiant heat. The photographs serve only to show the infra-red sources from which the temperature sensors are being shielded – and these shields are probably part of the reason why neither Menne nor Watts found a warming bias.
Summary
It has been known since the invention of the thermometer that for accurate measurement of air temperature the thermometer must be shielded from radiant heat. The lack of overall bias in the surface station records would seem to demonstrate what is seen in the infra red photographs: the stations are adequately shielded against influence from local sources of radiant heat.
It seems likely that the average reader of Watts' articles will have gaps in his or her knowledge of how scientists handle weather station data. Arguments which rely on those knowledge gaps will fail to impress anyone who has read articles like this SkS series on how weather station data is handled.
Although homogenisation can smooth out some flaws in the data, the data must be free from overall bias in order to produce scientifically valid findings. One must conclude from the lack of significant bias proven by multiple studies that the surface stations project shows, not factors found to actually cause bias but things which the casual observer thinks ought to cause bias.
-Patrick Lockerby
Credit is due to SkS contributors who have helped to make this article more readable, especially MarkR who contributed a major revision in layout.


[DB] Updated link, thanks!