Working out climate sensitivity from satellite measurements
Posted on 26 May 2010 by John Cook
Climate sensitivity is a measure of how much our climate responds to an energy imbalance. The most common definition is the change in global temperature if the amount of atmospheric CO2 was doubled. If there were no feedbacks, climate sensitivity would be around 1°C. But we know there are a number of feedbacks, both positive and negative. So how do we determine the net feedback? An empirical solution is to observe how our climate responds to temperature change. We have satellite measurements of the radiation budget and surface measurements of temperature. Putting the two together should give us an indication of net feedback.
One paper that attempts to do this is On the determination of climate feedbacks from ERBE data (Lindzen et al 2009). It looks at sea surface temperature in the tropics (20° South to 20° North) from 1986 to 2000. Specifically, it looked at periods where the change in temperature was greater than 0.2°C, marked by red and blue colors (Figure 1).

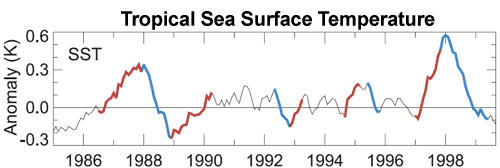
Figure 1: Monthly sea surface temperature for 20° South to 20° North. Periods of temperature change greater than 0.2°C marked by red and blue (Lindzen et al 2009).
Lindzen et al also analysed satellite measurements of outgoing radiation over these periods. As short-term tropical sea surface temperatures are largely driven by the El Nino Southern Oscillation, the change in outward radiation offers an insight into how climate responds to changing temperature. Their analysis found that when it gets warmer, there was more outgoing radiation escaping to space. They concluded that net feedback is negative and our planet has a low climate sensitivity of about 0.5°C.
However, a response to this paper, Relationships between tropical sea surface temperature and top-of-atmosphere radiation (Trenberth et al 2010) revealed a number of flaws in Lindzen's analysis. It turns out the low climate sensitivity result is heavily dependent on the choice of start and end points in the periods they analyse. Small changes in their choice of dates entirely change the result. Essentially, one could tweak the start and end points to obtain any feedback one wishes.

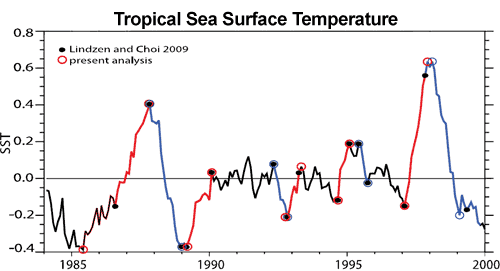
Figure 2: Warming (red) and cooling (blue) intervals of tropical SST (20°N – 20°S) used by Lindzen et al 2009 (solid circles) and an alternative selection proposed derived from an objective approach (open circles) (Trenberth et al 2010).
Another major flaw in Lindzen's analysis is that they attempt to calculate global climate sensitivity from tropical data. The tropics are not a closed system - a great deal of energy is exchanged between the tropics and subtropics. To properly calculate global climate sensitivity, global observations are required.
This is confirmed by another paper published in early May (Murphy 2010). This paper finds that small changes in the heat transport between the tropics and subtropics can swamp the tropical signal. They conclude that climate sensitivity must be calculated from global data.
In addition, a paper published last week reproduced the analysis from Lindzen et al 2009 and compared it to results using near-global data (Chung et al 2010). The near-global data find net positive feedback and the authors conclude that the tropical ocean is not an adequate region for determining global climate sensitivity.
A full understanding of climate requires we take into account the full body of evidence. In the case of climate sensitivity and satellite data, it requires a global dataset, not just the tropics. Stepping back to take a broader view, a single paper must also be seen in the context of the full body of peer-reviewed research. A multitude of papers looking at different periods in Earth's history independently and empirically converge on a consistent answer - climate sensitivity is around 3°C implying net positive feedback.

Arguments


This is a very well done presentation and because it is short, to the point, and loaded with facts, it should be very effective.
It appears that as more research gets published, climate sensitivity appears to converge on 3C with 2C being a very constrained lower bound. And, of course, 3C is not going to be pleasant at all (HUGE understatement).
Scott A. Mandia, Professor of Physical Sciences
Selden, NY
Global Warming: Man or Myth?
My Global Warming Blog
Twitter: AGW_Prof
"Global Warming Fact of the Day" Facebook Group
How was CO2 included there?
How was sensitivity to CO2 calculated from periods of just a couple of years? Doesn't the Charney sensitivity have a multi-decade lag?
a) that most recent estimates of sensitivity based on past climate suggest it is rather more than the model consensus of around 3 C (eg Pagani 2009)
b) that the reason for this is that models include only fast feedbacks ie Charney sensitivity
you can view the full version Lindzen et al 2009 here:
http://www.drroyspencer.com/Lindzen-and-Choi-GRL-2009.pdf
The brief mention of CO2 therein is much the same as here (example of energy imbalance from CO2 doubling).
to evaluate climate sensitivity you need not know any specific forcing provided that you measure the total energy imbalance. Afterall, this is just (one of) the definition of climate sensitivity, the response to a energy imbalance.
Roy Spencer has found Strong Negative Feedback from the Latest CERES Radiation Budget Measurements Over the Global Oceans between 60N and 60S. That covers 87% of the Earth's surface and almost all the ice free oceans.
Spencer, R. W., and W. D. Braswell (2010),
On the Diagnosis of Radiative Feedback in the Presence of Unknown Radiative Forcing
J. Geophys. Res., doi:10.1029/2009JD013371, in press. (accepted 12 April 2010), paywalled.
I don't think so. Measured in the long runs, energy-in equals energy-out. Whatever energy the earth receives is radiated off in time. This is true whether the earth is approximately stable in a snowball state or approximately stable in a hothouse state. A snowball state is possible when relatively more of the energy received is radiated back out at wavelengths more or less transparent to the atmosphere. A hothouse state occurs when there is relatively more of an asymmetry between wavelengths received and wavelengths emitted. An imbalance only tells you how much energy is being added or subtracted from the system at that time, or over the course of of whatever history you have. I don't think it can tell you what the future will bring. It can give you a good idea of the current rate of change, but since it doesn't tell you anything about the mechanics involved, I don't see that it can tell you if that rate will increase or decrease over time. The integral of the rate of change over time will absolutely tell you the total amount of change, but if you don't know anything about how long a rate of change will persist, you can't say anything about what the total change will be. Climate sensitivity generally refers to the amount of temperature change when a new point of equilibrium is reached.
If someone can explain how a current radiative imbalance can be used to predict the sum of future radiative imbalance, I'd be glad to hear it.
I kind of skimmed the article Barry linked. Two things struck me: Lindzen et al specifically state that they are aware of the shortcoming of only using tropic data; there's no need to hammer them on it. They apply a lot of linear tests for feedback effects while the historical proxy data indicate that they tend to be non-linear.
I guess I still have the same basic problem with Lindzen that I've had for a while: If the climate sensitivity to forcings is so low, how did the climate change so much in the past?
If someone can explain how a current radiative imbalance can be used to predict the sum of future radiative imbalance, I'd be glad to hear it.
We are talking about Charney sensitivity right now. Most of it is supposed to come from atmospheric water (vapor+cloud) feedback. As tropospheric H2O turnover time is short (~9 days) and even for the stratosphere it is on the order of one month, it is a fast feedback.
If it is found to be strong negative, all other longer term feedbacks can only operate on an already attenuated signal.
No I think we'll find that Spencer hasn't found anything of the sort Peter. In any case he (and Braswell) are quite explicit in stating that the parameter they pulled out of their analysis doesn't have any necessary realtionship to the climate sensitivity as it is commonly understood (i.e. the Earth surface equuilibrium temperature response to a radiative forcing equivalent to a doubling of atmospheric [CO2]).
I described this in some detail here. I'm surprised you're commenting on a paper that you haven't read...
OK, if you assume that there are only fast feedbacks and you can detect a reduction in the rate of energy flux, then you can make an educated guess as to where equilibrium will be reached. However, since they only used SST from 1985-1999, SSTs have changed a lot since then, the ice extent has change dramatically in the last decade, and the composition surely has not remained static, I don't see that these are realistic assumptions.
if......if......
I suspect the fast feedbacks will be found not to be negative, Peter. All the dodgy attempts to winkle out something with the appearance of a negative feedback (flawed analyses by Spencer and Braswell, and by Chylek, and by Schwartz, and by Lindzen and Choi) have turned out to be scientifically deficient.
In any case, there are a couple of obvious flaws to the notion that fast feedbacks are negative. The first of these relates to the numerous direct measurements of enhanced tropospheric humidity in response to atmospheric warming. It's very difficult to come to a conclusion that this (a) doesn't exist, and (b) isn't a positive feedback.
The second is the observation that we've had around 0.8-0.9 oC of global warming since the mid-19th century. It's easy to calculate that a radiative forcing from the known enhanced [CO2] with zero feedbacks should give a warming at equilibrium of around 0.4 oC (see point (v) here). Since we know that we aren't yet near equlibrium with the current forcing, and that a substantial aerosol load has offset some of the warming from enhanced anthropogenic [CO2], and that solar variability has made no more than around 0.1 oC contribution to this warming, it seems very unlikely indeed that the feedbacks to [CO2]-induced primary atmospheric warming are not positive and substantial (one should also factor in contributions from black carbon and non-CO2 greenhouse gases). And that's without considering the abundant evidence from paleotemperature/[CO2] relationships that indicate a climate sensitivity near 3 oC of warming at equilibrium per doubling of atmospheric [CO2].
Incidentally, it's worth looking at Foster and Gregory 2006, which does a very good job of highlighting the issues associated with attempting to use direct measures of TOA radiation to estimate climate sensitivity.....
Incidentally (b!) Spencer and Braswell certainly are not talking about Charney sensitivity. They state this explicitly in their paper (see my post just above and the link therein). Lindzen would like to "sell" the pretence that his analysis is about Charney sensitivity, but it turns out not be...
A few points:
The global data is too imcomplete to make a definitive conclusion about climate sensitivity, especially in the higher latitudes. However, most of the data I have seen does suggest the tropics don't warm as fast as other regions when the earth warms (which also means Hurricanes and Cyclones shouldnt increase in frequency with warming, because of the lower T difference and greater stability between the tropics and temperate regions).
The papers looking at Earths history sensitivity, some of which you have presented on this site (eg Little Ice Age), are not definitive for climate sensitivity either. They are generally models which insert C02 to explain longer term trends, and leave out other factors, such as clouds and changes to ocean currents.
The reason they 'converge' is because they use essentially the same causal explanations. They are not really that 'independent' (eg many papers refer to each other to provide eg back up to uncertainties in the data, like using the same dataset for proxy temperatures). Essentially, the models use the same assumptions to come up with the same conclusions.
he (and Braswell) are quite explicit in stating that the parameter they pulled out of their analysis doesn't have any necessary realtionship to the climate sensitivity as it is commonly understood
Of course they state that as it is true. The paper is about short term water (vapor+cloud) feedback and they do find a low sensitivity here. There may be any number of feedbacks operating on longer timescales, some of them strong positive.
However, current computational climate models can't project much warming with no fast & strong positive water feedback.
Here is an earlier presentation by the same authors on this topic, 16 December 2009 AGU Meeting, San Francisco, CA
did I say anything about the future? I just gave the "standard" definition of sensitivity which could in principle be used to evaluate it using past data. Maybe John's response to Alexandre #2 is clearer than mine.
Incidentally, it's worth looking at Foster and Gregory 2006
The paper is available here.
"The paper is about short term water (vapor+cloud) feedback and they do find a low sensitivity here."
No they don't Peter. I wonder whether you've read the paper. In a scientific paper your interpretations have to be consistent with the data you present and its analysis.
In this case Spencer and Braswell fiddle around with various ways of plotting globally averaged anomalies in CERES net fluxes and find "considerable scatter". They try higher time resolution and find negative regression slopes (flux vs surface temperature) which they suggest cannot represent the real sensitivity. They try restricting the analysis to the global oceans (60 oN to 60 oS latitude) with daily resolution comparisons of flux with sea surface temperatures...however they find the correlations are negative. They try extending the time scales of intercomparisons (radiation flux and SST). They try phase space plotting of the data...
Eventually they come up with "evidence of linear striations". These have slopes of around 6.2 W.m-2.K. Spencer and Braswell state: "These striations are significantly different from a similar plot of two time series of random numbers, shown in Fig. 3b, suggesting that the striations are due to some underlying physical process."
Does that sound like they've "found low sensitivity here"? I don't think so. The paper has some interesting comparisons of a simplified model with GCM's. It's quite good at highlighting the difficulties of identifiying fast feedbacks in the presence of external forcinsg. What it doesn't present evidence of is "low sensitivity".
Of course Spencer may say otherwise on his blog (a bad habit). But if you can't justify an interpretation in a scientific paper, then that interpretation is unlikely to be scientifically valid.
Basics of general circulation models. Free to read, no need to speculate.
"The recomputed slopes after removing the estimate of the Pinatubo radiative forcing (open circles in Figure 1d) are generally between 1.25‐2.0 W m−2 K−1 and more similar to the values of the AMIP model simulations."
They also state
"The computed values are consistently smaller than the value of the no‐feedback case (3.3 W m−2 K−1)"
The relationship is:
Del(Teq) = Q/Y
where Del(Teq) is the equilibrium climate sensitivity [note that this relates to the fast (water vapour/cloud) feedback. The real (Charney) sensitivity incorporating albedo feedbacks, for example, should be somewhat larger].
Q is the radiative forcing due to doubled [CO2] which is normally taken to be 3.7 W.m^-2 (not sure why 3.3 was chosen in your example).
Y is the feedback parameter (in your example 1.25 - 2.0 W.m^-2.K-1)
so putting in your values, the fast component of the climate sensitivity is ~ 1.9 - 3 oC at equilibrium per doubling [CO2]
"Eventually they come up with "evidence of linear striations". These have slopes of around 6.2 W.m-2.K. Spencer and Braswell state: "These striations are significantly different from a similar plot of two time series of random numbers, shown in Fig. 3b, suggesting that the striations are due to some underlying physical process."
Does that sound like they've "found low sensitivity here"? I don't think so. The paper has some interesting comparisons of a simplified model with GCM's. It's quite good at highlighting the difficulties of identifiying fast feedbacks in the presence of external forcinsg. What it doesn't present evidence of is "low sensitivity". "
While S&B doesn't necessarily demonstrate low sensitivity, it is definitely consistent with *lower* sensitivity. If the short-term response to, for example, an increase forcing is a rapid warming followed by a reduction in temperature according to the pattern S&B found, then an increase in forcing will have a much smaller effect than if the response to forcing does not include such a short term response. If one assumes a given set of feedback where the short term response is consistent with Spencer's results one will have a less sensitive climate than if the short term response was consistent with the Stephan-Boltzmann relationship.
Cheers, :)
If....if...if...
I don't think so shawnhet. If you play around with the data sufficiently, eventually you might get something that seems to support the notion that you're trying to advance. Lindzen's conjuring up of a similar conclusion by cherrypicking convenient time points in analyzing TOA radiation in response to surface temperature variation is another example of this sort of numerology.
There's a very interesting psychology going on here! The devotion that these celebrity crowdpleasers (e.g. Spencer and Lindzen) have in some circles is rather touching (if also a bit scary). Spencer's paper hasn't been published (I've read the in-press version on the AGU website), but already Berenyi Peter has referred to it twice on this site without having read it, and it's been publicised all over the web. Never mind that the two things that we can be fairly certain of in relation to Spencer's work are (i) there's a high probability that it will be wrong (he has a near 20-year record of getting things hopelessly wrong) and (ii) he will publicise overblown interpretations of his "analyses" on his blog and elsewhere.
It can't be about science I think. After all if we want to understand the methodology, analyses, problems and interpretations of estimating fast feedbacks by regressing TOA net radiation variation in response to surface temperature fluctuations, there's quite a rich scientific literature. We can look at Tsushima et al 2005, Foster and Gregory 2006, Gregory and Foster, 2008, Murphy et al, 2010, Chung et al 2010, Trenberth 2010, and so on, to help us understand the science. But all that stuff is like lead balloons to those who need to have the issue filtered through some Lindzen/Spencer hokey.
In fact Spencer's paper is not a big deal, and his conclusions are rather divorced from what he says on his website. He's fiddled around and found some linear striations. He doesn't know what they mean but observes that they're different from similar plots of random number series so they might have a physical basis. We can then put in place a train of "if's" as in your post. But it's much more satisfying to address the science rather than build castles in the air (at the top of the atmosphere?) based on conjecture......
....if we had some ham we could make ham and eggs....if we had some eggs!
However as the period covered by both studies cover virtually one whole positive phase of the IPO just how relevant are either of them?
Any such study should cover at least one full cycle of both phases, especially given the acknowledgement given to the ENSO influence, but unfortunately we will possibly have to wait a couple of decades at least before the next IPO negative phase passes under the watchful eye of the satellites.
What processes do you think governs the climate *on the timeframe* Spencer is dealing with? What predictions can be made about the short term effects of changes in forcing?
Cheers, :)
It's really uninteresting to conjecture upon ill-defined observations of unknown significance shawnhet. If Spencer and Braswell don't know what their linear striations relate to, I'm not very interested in speculating. You'd really have to know what the relationship actually is before considering what it might mean if it was "robust"! There is lots of interesting science on the relationships between TOA radiation variation and surface temperature luctuatins (see the papers cited in my post just above), and I've found this really interesting to read. Spencer and Braswell not so much...
What processes do (I) think governs the climate *on the timeframe* Spencer is dealing with? Noise, surely. What else governs climate on the monthly timescale (other than massive volcanic eruptions and extraterrestrial impacts). That's leaving aside seasonal influences on local climate obviously...
What predictions can be made about the short term effects of forcing? Well I would say that there is good evidence that the water vapour responds in the direction of a positive feedback as has been determined empirically in several studies, on both short and long time scales. Of course it depends on the strength of the change in forcing. A large volcanic eruption or an extraterrestrial impact can have a dramatic short term effect! It also depends on what you mean by "short term".
Frankly, Chris, I don't know how you can intelligently comment on S&B if you don't understand what the linear striations mean. It is pretty clear that they relate to coefficient of the short-term feedback process that seems to operate on changes in radiative forcing.
"What processes do (I) think governs the climate *on the timeframe* Spencer is dealing with? Noise, surely. What else governs climate on the monthly timescale (other than massive volcanic eruptions and extraterrestrial impacts). That's leaving aside seasonal influences on local climate obviously..."
Noise alone won't work because it can't explain the existence of the linear striations in the data.
Cheers, :)
Clouds would have to be the most obvious process that governs climate on both short and longer term timeframes, I'm surprised you didn't include them.
Are they part of what you left aside as seasonal influences on local climate?
If so, that would be neglecting that whilst local conditions may vary from clear to overcast, globally the amount of coverage could vary roughly in the range of 1/3 to 2/3 coverage at any one time, not only providing significant influence, but significant variation over both short and longer timeframes.
Clouds are acknowledged as being the least understood of all climate factors, but that is not sufficient reason for them not to be included or ignored at any point of the process of climate study.
Shawnhet, I suspect you're doing what Spencer wants you to do - he's playing "fast and loose" with some numerological analyses of TOA radiation data and climate models and interpreting these (on his website, not in the paper) within an unrealistic simplified climate heat transfer model.....you're running with his insinuations with your extrapolated conjecture "If that relationship turns out to be robust, then the climate sensitivity will be less than, for instance, a system where the short-term response is governed by some other process."
ONE: However Spencer and Braswell state explicitly in their paper that their analysis doesn't have anything neccesarily to do with climate sensitivity at all. So you are basing your conjecture on a dismissal of S&B's assessment. Why do you consider that they are wrong?
TWO: This statement of yours is also incorrect:
"It is pretty clear that they relate to coefficient of the short-term feedback process that seems to operate on changes in radiative forcing."
Again it would help if you were to read the paper before making assumptions (even if Spencer does try to lead you to false interpretations). The "coefficient of the short term feedback process" [which I'll call f(s) for short a la Lin et al (2010) - see "FOUR:" and "FIVE:" below] isn't "operat(ing) on changes in radiative forcing". It's operating on changes in surface temperature (climate perturbations).
THREE: You don't like my response to your question "What processes do you think governs the climate *on the timeframe* Spencer is dealing with?". I suspect that the reason is that you meant something other than what you asked. Clearly it's only noise and massive virtually instantaneous changes in forcing (volcanoes; extraterrestrial impacts) that can impact climate in such short timescales. I wonder if you really meant to ask "what processes do you think governs net TOA radiation transfer on the "timeframe" Spencer is dealing with"? If that's what you meant (please let me know) then I could answer that question.
FOUR: Being careful with meaning is important in science. This is relevant to points TWO: and THREE: above. Let's take the situation that there is a change in sea surface temperature (SST) arising from an internal fluctuation in heat distribution (e.g. El Nino, so the SST temperature rises a bit). What happens to this excess heat? I would say that it will be radiated away, quite likely rather quickly. It's not going to be particularly affected by the radiative imbalance arising from the enhanced greenhouse effect. The latter sets the average background temperature which is the temperature that results from the greenhouse forcing and the particular state the the climate system has reached in response to the forcing at that particular time on its slowish trajectory towards a new climate equilibrium. So there's nothing really "opposing" the dissipation of the enhanced heat to space. On the very short term the climate system will always tend towards the state that the climate happens to be in, and so we aren't surprised if there's a very rapid dissipation of energy out of the system. That coefficient [f(s)] has got nothing whatsoever to do with the climate response to radiative forcing arising from a radiative imbalance at the top of the atmosphere (and to be fair to Spencer and Braswell, they say as much in their paper, even if you choose not to believe them).
FIVE: Another way of thinking of this is that the climate system has inertia to change and thus has a memory. Under the general case of persistent TOA radiative imbalance, the excess energy that accumulates in the climate system as a result of the imbalance isn’t radiated away. It’s only energy (positive or negative) that rises or falls above the energy compatible with the TOA forcing and climate inertia or “memory” that is rapidly dissipated, since the system will always tend towards the background state around which these internal fluctuations are “dancing”. Lin et al have just published a a couple of papers [**] in which they have taken Spencer and Braswell’s “striations” at face value, assigned S&B’s value to the coefficient f(s) and used this in a model that is more realistic than S&B’s by adding a term for the climate “memory”. When they do this, S&B’s purported value for what might be f(s) is entirely compatible with rather well-established estimates of the real climate sensitivity.
SIX: Apologies for the very long post (and I’ve answered the question I suspected you meant to ask anyway!). I might just add that once again the difficulties of estimating the true (Charney) climate sensitivity from contemporary real world measurements boil down to uncertainities of the true climate response times (inertia/memory etc.). Unfortunately, the system simply isn’t accessible to quick and easy answers…at least do far…
[**] Lin, B. et al (2010) Can climate sensitivity be estimated from short-term relationships of top-of-atmosphere net radiation and surface temperature? J.Quant. Spec. Rad. Trans. in press (can’t seem to link to the abstract).
you need to use forcing instead of CO2 concentration.
For example, between 1970 and today CO2 went from 325 ppm to 390 ppm. The forcing is F = 5.35*lnC2/c1 ~ 1 W/m^2; temperature increase has been about 0.5 °C and the sensitivity λ would be λ = 0.5/1 = 0.5 °C/Wm^-2. Double CO2 means 3.7 W/m^2 which translates to about 1.85 °C per doubling CO2, lower than the most probable value of 3 °C.
"ONE: However Spencer and Braswell state explicitly in their paper that their analysis doesn't have anything neccesarily to do with climate sensitivity at all. So you are basing your conjecture on a dismissal of S&B's assessment. Why do you consider that they are wrong?"
I don't consider them wrong they aren't making the point that you are making. S&B (and I)are not talking about the long-term feedback response(ie climate sensitivity), they are talking about short-term feedback response. S&B doesn't *necessarily* say that long-term sensitivity must be negative because it doesn't measure that. However, for a given set of long-term feedbacks S&B predict a less sensitive climate than if short term variations are governed by noise(in S&B's terms).
"THREE: You don't like my response to your question "What processes do you think governs the climate *on the timeframe* Spencer is dealing with?". I suspect that the reason is that you meant something other than what you asked. Clearly it's only noise and massive virtually instantaneous changes in forcing (volcanoes; extraterrestrial impacts) that can impact climate in such short timescales. I wonder if you really meant to ask "what processes do you think governs net TOA radiation transfer on the "timeframe" Spencer is dealing with"? If that's what you meant (please let me know) then I could answer that question. "
In S&B's context clearly "noise" random perturbations in the relationship btw forcing and temperature. EArlier you quoted this from S&B "These striations are significantly different from a similar plot of two time series of random numbers, shown in Fig. 3b, suggesting that the striations are due to some underlying physical process.". FYI, the plot of random numbers would be noise per S&B.
"FIVE: Another way of thinking of this is that the climate system has inertia to change and thus has a memory. Under the general case of persistent TOA radiative imbalance, the excess energy that accumulates in the climate system as a result of the imbalance isn’t radiated away. It’s only energy (positive or negative) that rises or falls above the energy compatible with the TOA forcing and climate inertia or “memory” that is rapidly dissipated, since the system will always tend towards the background state around which these internal fluctuations are “dancing”. Lin et al have just published a a couple of papers [**] in which they have taken Spencer and Braswell’s “striations” at face value, assigned S&B’s value to the coefficient f(s) and used this in a model that is more realistic than S&B’s by adding a term for the climate “memory”. When they do this, S&B’s purported value for what might be f(s) is entirely compatible with rather well-established estimates of the real climate sensitivity."
Yes, Lin's approach is quite interesting. You'll note that they had to "add" something to make sense of what Spencer found. They did not call him names or try to say that everyone who disagreed with them did not "read the paper". No, they set out to actually try and explain the behavior of the real world.
My brief reading of Lin's paper here doesn't allow me enough understanding of how the memory is supposed to work to comment much on it. i will read bit more and see what I think. Here it is for anyone who is interested.
http://www.atmos-chem-phys.net/10/1923/2010/acp-10-1923-2010.pdf
Cheers, :)
The forcing would be from the changes in the amount of sunlight, not CO2, but I understand that the sensitivity should be the same to at least first order.
Also the heat transport from one hemisphere to the other should not be as great an effect as just using the tropics.
There could also be interesting hemispheric differences because of the differing land to ocean ratios and the amount of surface snow affecting albedo.
Am I totally off base?
Thanks.
on a yearly bases you would need to account for the internal movements of heat, someone (inappropriately, in my opinion) calls them "internal forcings". For example, think about downwelling and upwelling and mixing of ocean waters. These movements are not well know and may produce a large unaccounted variability in the short run but tend to average out over longer periods.
For example, think about downwelling and upwelling and mixing of ocean waters. These movements are not well know and may produce a large unaccounted variability in the short run but tend to average out over longer periods.
But we have a hundred years of data to average over. The change in energy from the sun between summer and winter over a hemisphere (N or S) is approximately constant and much larger than most other factors and the consequent temperature change is also large (I would guess about 20C - much more at the poles and less near the equator -) and also roughly constant but with more variability for the reasons you mentioned.
I guess I should just try to calculate it. I recall Open Mind had a few blogs on how much various orbital factors affected how much sunlight a hemisphere received.
You haven’t really addressed my points shawnhet, except (incorrectly) point #5. Perhaps I can make my points clearer. It’s also helpful to address this paper in its wider context since (as we both know) while we’re ostensibly addressing a scientific paper, there’s some interesting “non-science” stuff going with this work and how it’s publicised blogospherically! I’m going to do the latter in a second post – that way if the moderators consider that I’m straying from the science or my post induces a series of follow up non-science posts, it (and they) can be deleted.
ONE: Your first point is confused isn’t it? One the one hand you say:
”S&B (and I)are not talking about the long-term feedback response (ie climate sensitivity),…”
...which we can all agree with, since that’s obvious by reading the paper and Spencer and Braswell (S&B) state this explicitly. But then you say:
”However, for a given set of long-term feedbacks S&B predict a less sensitive climate than if short term variations are governed by noise(in S&B's terms).”
That odd dichotomy (the paper both isn’t and is about climate sensitivity) is a good example of the confusion that can arise from Spencer’s style of “science by insinuation” (where you say one thing in a scientific paper, and something different on a blog?) I can’t think of another reason how you can simultaneously conclude two incompatible things – one certainly can’t arrive at that conclusion from reading S&B’s paper.
TWO: Your first point is correct. S&B state that their “linear striations” don’t have anything necessarily to do with climate sensitivity (the equilibrium surface temperature response to radiative forcing). They find some “linear striations” in an analysis of short term TOA radiation/temperature relationships but don’t quite know what they mean, although they consider that they might have a physical basis. That’s fine. The next step, scientifically-speaking, is to establish what these “striations” are and what they really mean (if anything) in relation to TOA radiative transfer.
THREE: I’d say that’s where the science stands on S&B(2010). However it’s perfectly acceptable (scientifically-speaking) to make a presumption about what this might mean, and within that model to assess potential consequences. Lin et al (2010) do this in a couple of papers (cited here). They use S&B’s “linear striations” to parameterize a fast feedback parameter [f(s)] of a radiative transfer model and find that if one uses a model that bears some realism to the real world (i.e. one in which there is a non-zero “inertia” or “memory” in the climate system), that S&B’s “linear striations” are entirely compatible with a real world climate sensitivity consistent with the wealth of independent data (Lin et al find a “best” value for the climate sensitivity of 3.1 oC). Your assertion "You'll note that they had to "add" something to make sense of what Spencer found." isn’t correct. They’aren’t “making sense of what Spencer found”. They are taking an interpretation of S&B’s “linear striations” at face value and addressing how this might affect real world climate sensitivity
“Year zero science” [*]. It’s a little unfortunate to have to consider this, but it’s also sad that the efforts by scientists working in this area are apparently of effectively zero import once a couple of “celebrity crowdpleasers” enter the arena. The studies of Spencer and Braswell (2010) [and Lindzen and Choi (2009)] are two out of dozens of papers that address TOA radiative transfer, and the issue of estimating climate sensitivity from short term radiative response to temperature fluctuations (e.g. see papers cited in John Cook’s top article and here). Outside of proper science forums and quality science blogs (like this one), all of that other work is essentially invisible.
Much like Lindzen and Choi (2009), S&B(2010) is already building up a head of blogsphere “steam” and if one looks at the presentations on the subject at a curious climate change politicisation get-together in Chicago a couple of weeks ago, for example, one might think that L&C and S&B is the entire science on this subject! In fact L&C(2009) is the only study that S&B(2010) explicitly refer to as support of one interpretation of their “analysis” [S&B state ” This is similar to the feedbacks diagnosed by Lindzen and Choi [2009] from interannual variability in recently recalibrated Earth Radiation Budget Satellite data…”]. And yet the analysis of Lindzen and Choi (2009) has been shown to be horribly flawed (see top article of this thread). Pretending that the wider science doesn’t exist and that the subject can thus be interpreted in its entirety through a couple of flawed analyses isn’t a good way to understand scientific issues!
The real world makes sense. In much the same way that a paper can’t at the same time be about climate sensitivity and not be about climate sensitivity, so the climate sensitivity (let’s say the Charney climate sensitivity) can’t be both significant and insignificant at the same time. The earth’s climate as it stands now does respond to enhanced radiative forcing with a surface temperature that rises to a new equilibrium compatible with this forcing. This sensitivity cannot at the same time be very small (~0.5 oC of warming for a radiative forcing equivalent to 2xCO2) and considerably larger (~2-4.5 oC of warming for 2xCO2).
Since (outside of “year zero” “philosophies” of “science”) there is a rather large scientific evidence base that supports the latter climate sensitivity, one needs to provide some strongish evidence if one wants to make headway with scenarios of low climate sensitivity. Likewise if one wishes to pursue very low climate sensitivities, one really needs to explain their fundamental incompatibility with real world observations. After all the rise in atmospheric [CO2] since the mid-late 19th century (290 then to 390 ppm now) is associated with a global temperature rise of 0.8-0.9 oC. We know that the earth’s temperature hasn’t yet risen to the equilibrium temperature compatible with the enhanced greenhouse forcing. We know that atmospheric aerosols have offset some of this warming. And yet within a “year zero” philosophy where everything we know about the real world is thrown out in favour of a cherry-picked selection of data points or wild extrapolation from observations of “linear striations” we are “led” to believe that the huge rise in atmospheric [CO2] has only contributed ~0.15 oC of global warming during the last 150 years. So with all the aerosols we've pumped into the skies the world really should have cooled somewhat during this period, polar, glacier and sea ice should have expanded somewhat, and sea level rise stopped or even started to reverse. Something doesn’t add up….
[*]”Year zero science” could also be termed “clean slate science”, and refers to the “philosophy” whereby a single measurement or analysis is created or selected, and publicised as if it constitutes the essential evidence that bears on a subject while pretending that the wider knowledge base doesn't exist.
”S&B (and I)are not talking about the long-term feedback response (ie climate sensitivity),…”
...which we can all agree with, since that’s obvious by reading the paper and Spencer and Braswell (S&B) state this explicitly. But then you say:
”However, for a given set of long-term feedbacks S&B predict a less sensitive climate than if short term variations are governed by noise(in S&B's terms).”
Respectfully, Chris, it is you who is confused. Let's say we have a forcing that instantly raises the temperature(T1) by 1C. Under S&B, that instant feedback is then acted on by a feedback(SF) that drops the temperature by 0.5C(T2), finally T2 is acted on by a series of long-term feedacks(LF) that multiply it by 3 ie T3=T1*SF*LF. Think about it. If SF is <1, then T3 *must be* less than if SF=1 *where everything else is equal*.
Hopefully, now, you can understand where S&B are coming from.
" The real world makes sense. In much the same way that a paper can’t at the same time be about climate sensitivity and not be about climate sensitivity, so the climate sensitivity (let’s say the Charney climate sensitivity) can’t be both significant and insignificant at the same time. The earth’s climate as it stands now does respond to enhanced radiative forcing with a surface temperature that rises to a new equilibrium compatible with this forcing. This sensitivity cannot at the same time be very small (~0.5 oC of warming for a radiative forcing equivalent to 2xCO2) and considerably larger (~2-4.5 oC of warming for 2xCO2)."
Just FYI, now that you hopefully understand what S&B are saying, there is no contradiction btw assuming a short-term feedback of 0.5C to CO2 forcing, which is **then** multiplied by 2-4.5 by long-term feedback effects.
If you combine such a framework with an ocean cycle effect(eg PDO), you have a perfectly sensible explanation of the real world.
Cheers, :)
Nope. You're saying stuff that simply isn't true shawnet.
It's very difficult to escape the interpretations from Spencer & Braswell's own words that their "linear striations" have no necessary relationship to climate sensitivity (enhanced earth temperature in response to radiative forcing).
So their analysis has nothing whatsoever necessarily to do with climate sensitivity. It’s tedious to keep saying this, and I wish you would hunker down and read their paper before insisting on interpretations that S&B patently don't make.
The equation you present "T3=T1*SF*LF" (what are "SF" and "LF"?) doesn't make any sense in the context of S&B's analysis. Even 'though S&B are not sure of the physical basis or significance of their "linear striations", we can make a model of the real world response to radiative forcing making the preliminary assumption that they (the "striations" relate to a fast response to forcing [f(s)]. An appropriate equation to estimate the temperature change arising from radiative forcing, incorporating both a fast feedback [f(s)] and a feedback term in recognition that the real climate system has an "inertia" or "memory" [f(m)] is of the form:
T (t→ ∞) = −F(t→ ∞)/(fs + fm)....Lin et al (2010) cited in a post above.
In this case realistic values of f(m) indicate that the climate sensitivity has rather little dependence on f(s). Lin et al show this directly, and state:
So even if S&B's "striations" relate to a fast feedback parameter (we don't know), and whether or not these "striations" have any relation to climate sensitivity (S&B say they don't necessarily have any), and even if we nevertheless model the climate response to forcing making the preliminary assumptionthat they can be used to parameterize a fast feedback [f(s)] , the effect on calculated climate sensitivities is small.
And remember that the real world makes sense, shawnhet. Just as you can't simply invent equations out of thin air, nor can you invent phenomena out of thin air. You can't obtain a "perfectly sensible explanation of the real world", by inventing a non-existent ocean cycle effect (eg PDO) that magically creates thermal energy. If the PDO (or other "ocean cycle effects") are ocean cycle effects then they can't possibly contribute to secular surface temperature trends (persistent temperature rise) since they are cycles. We don’t have to “guess” at this, or pretend that we don’t know what we do know (“year zero science”!). These issues have been studied at great length. A recent study indicates for example that “ocean cycles” have made essentially zero contribution to the warming of the last 100-odd years. So like your equation, your "sensible explanation of the world" is simply incompatible with what we know of the real world.
Frankly, this is tiresome. You, by your own admission, did not understand the central point(the linear striations) of the S&B paper, but you have been pontificating about it as though you are an expert.
Since you like Lin's framework, I will show you how it works using that system.
T (t→ ∞) = −F(t→ ∞)/(fs + fm)....Lin et al (2010) cited in a post above.
Using, the above formula *hold everything constant except fs*, now vary fs. Start by assuming that it is nonexistant(ie 0) and then calculate what the value of T (t→ ∞) is when you change the value of fs to the value assumed by SPencer & Braswell.
After doing that, then re-read my posts here. If you can do that and have further issues with *what I've written* I'll try and address them. Please refer to the answers you've gotten for T, as there is no point continuing this until I'm sure that you get the math.
Cheers, :)
In fact Spencer and Braswell don't really understand the "linear striations" (as I've pointed out umpteen times now); e.g. they state:
and
and:
You disagree strongly withe S&B and apparently feel sure that you know what the "striations" mean even if S&B don't. You're certain that they can be related to climate sensitivity in the commonly accepted understanding of the term (equilibrium surface temperature response to radiative forcing), when S&B explicitly caution against that extrapolation. Fair enough, but I don't find your assertions very convincing.
Still, we can, if we want, make a preliminary assumption that the striations relate to a feedback parameter [f(s)]. If we do so, and parameterize a realistic climate heat capacity model with S&B's estimate of a possible f(s), we find (see my post just above), that the value of the climate sensitivity is rather little influenced by f(s).
Since Lin et al (2010) [see citation in my posts above] have published this analysis, why not just look at their paper shawnet?
IAC, can you do the math question I posted above? It involves an expression that you posted, so you should be able to do it. Once you do the math, it will be easy to see where you are going wrong. I won't need to keep repeating myself, I will just be able to point you to *the math*.
If you can't do the math, I can walk you through it.