Climate Science Glossary

Term Lookup

Enter a term in the search box to find its definition.

Settings

Use the controls in the far right panel to increase or decrease the number of terms automatically displayed (or to completely turn that feature off).

Term Lookup

Settings


All IPCC definitions taken from Climate Change 2007: The Physical Science Basis. Working Group I Contribution to the Fourth Assessment Report of the Intergovernmental Panel on Climate Change, Annex I, Glossary, pp. 941-954. Cambridge University Press.

Home Arguments Software Resources Comments The Consensus Project Translations About Support

Twitter Facebook YouTube Mastodon MeWe

RSS Posts RSS Comments Email Subscribe


Climate's changed before
It's the sun
It's not bad
There is no consensus
It's cooling
Models are unreliable
Temp record is unreliable
Animals and plants can adapt
It hasn't warmed since 1998
Antarctica is gaining ice
View All Arguments...


Username
Password
New? Register here
Forgot your password?

Latest Posts

Archives

Arctic methane outgassing on the E Siberian Shelf part 1 - the background

Posted on 15 January 2012 by John Mason

Reports of extensive areas of methane - a powerful greenhouse gas - bubbling up through the shallow waters of the East Siberian Arctic Shelf (ESAS) have been doing the rounds in the media recently, with some articles taking the apocalyptic approach and others the opposite. So what IS going on in the far North? In this two-part post we will first examine the data available to date and then in part two we go on to discuss the findings of 2011 with the research team who have been doing the work on the ground.

Background

To understand the goings-on up at the ESAS in context, we need to go back to the time of the last glacial maximum, some 20,000 years ago. Although the climate was cold, much of Siberia remained unglaciated for the simple reason that the climate was also extremely dry: the main area of glaciation was in the Verkhoyansk Range in the east, which rises to nearly 2500m. The low-lying plains of central Siberia saw the development of permafrost - defined as soil that remains at below freezing point for two or more years. The prolonged cold of the last glacial period saw permafrost develop to great depths - over 1000m in places.  Extensive areas of this old permafrost, albeit thinner than at the last glacial maximum, exist at the present day. On land, permafrost occurs several metres below surface, and is overlain by the so-called active layer, soil which seasonally thaws out and in which the Siberian flora grows.

Map of the Arctic showing the East Siberian Shelf

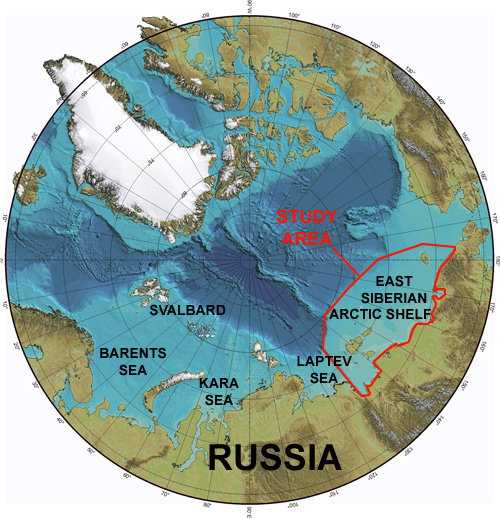
Above: Bathymetric map (source - NOAA) of the Arctic with key features noted and the subject area highlighted in red.

During the last glacial maximum, global sea levels fell by over a hundred metres, with the result that the shallow seas of the ESAS became dry land, which allowed permafrost to develop there. Climate warming in the Holocene melted the big ice sheets in N America and NW Europe, leading to sea level rise and flooding of the ESAS, which once again became an extensive shelf sea, averaging some 45 metres in depth. The incoming seawater raised the temperature of the seawater-seabed interface dramatically so that it is considerably (>10C) warmer today than the annual average temperature over the adjacent land permafrost areas. This warming led to a certain amount of seabed permafrost degradation but until recently the remaining subsea permafrost layer was thought to be relatively stable, acting as a cap or lid to the methane that was expected to be present in and beneath it.

Permafrost degradation and methane release on land are things that most people will be familiar with: footage of people igniting methane on frozen Siberian lakes has been broadcast many times. This is primarily biogenic methane - formed via microbial decay of organic matter such as plant-debris. As permafrost degrades due to the warming climate, the organic matter, trapped in the frozen ground for thousands of years, is freed and bacterial decay rapidly sets in, releasing methane to the atmosphere.

At greater depths in the sedimentary column, methane may exist in a second form, trapped in clathrate molecules. A clathrate is a naturally-occurring chemical substance which consists of one type of molecule forming a cage-like crystalline lattice  - the host - which traps a second type of molecule - the guest. In the case under discussion here, the host is water and the guest is methane, hence the commonly-used term 'methane hydrate'. Methane hydrate looks just like ice: it is a white, crystalline solid but is only stable at low temperatures and/or high pressures: otherwise it decomposes, liberating its methane content.

Specimen of methane hydrate in marine sediment

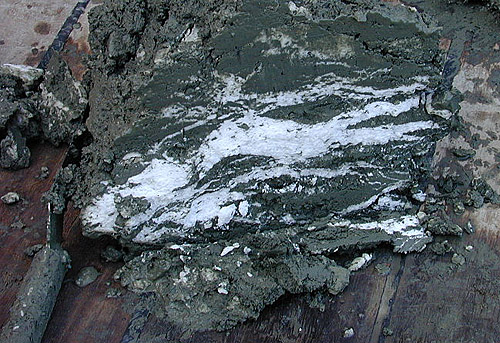
Above: methane hydrate forming irregular white masses embedded in the marine sediment of Hydrate Ridge, in the Pacific Ocean off Oregon.

This sensitivity to temperature and pressure means that outside of very deep water environments, methane hydrate typically occurs at considerable depths in the sedimentary column (ref. 1): values of 200-500m beneath surface are commonly cited as being within the 'gas hydrate stability zone' (GHSZ). Any deeper than that and temperatures tend to be too high due to the geothermal gradient; any shallower and temperatures are again too high - except, perhaps, where the hydrates are locked-in and kept at low temperatures by extensive, bonded permafrost. Within the GHSZ, methane hydrate occurs as pore-filling cements in coarse-grained sediment such as sand; conversely, in finer-grained sediment such as mud it forms pure masses of irregular shape. Typical concentrations in sandy sediment are a few percent of pore-volume. Estimates of the total amount present globally vary: although some very high values have been suggested, more commonly-cited figures are 10,000 Gt carbon or less. This is still a substantial figure when compared to e.g. estimates of carbon in global coal reserves.

Methane hydrate has been exploited on a limited scale as a fossil fuel. At Messoyakha, in western Siberia, the Soviets extracted methane trapped beneath a dome of permafrost 450m in thickness; at least a third of the resource, exploited over 13 years, was thought to exist as hydrate which was artificially destabilised by pumping hot water and solvents into the wells in order to collect the gas.

Recent observations on the East Siberian Arctic Shelf

That the sea in this area of the Arctic has warmed up significantly should come as no surprise to anybody who has been following the unfolding reductions in sea-ice and other developments in that region. A 2011 paper (ref. 2), citing hydrographic data collected since 1920, reported a dramatic warming of the bottom water layer over the ESAS coastal zone (<10 m depth), since the mid-1980s, of 2.1°C. The warming was attributed to atmospheric changes involving enhanced summer cyclonicity, reduction in ice extent, the consequent lengthening of the summer open-water season and - consequential to that - solar heating of the water column.

Until relatively recently, the subsea permafrost of the ESAS saw little or no attention compared to the onshore permafrost: it was simply assumed that it was unlikely to be a source area for methane because it was all frozen solid. That assumption was turned on its head in 2003 when the first of a series of field expeditions by scientists from the University of Alaska at Fairbanks took place and resulted in an ominous discovery: surface and especially bottom waters were super-saturated with methane, implying that outgassing from the sea-bed was occurring. Further fieldwork went on to discover plumes of methane gas bubbling up to the surface. In deeper waters, methane does not make it all the way up to the atmosphere - it all dissolves in seawater - but over the shallower waters of the ESAS this is not the case. Air sampling surveys over the ESAS revealed great variability in methane levels: against the global background level of 1.85ppm, they were elevated by typically 5-10% up to 1800m in height, with local spikes over gas-productive areas as high as 8ppm. The researchers calculated the annual total methane flux from the ESAS to the atmosphere to be 7.98Tg C-CH4, which in plain English is 10.64 million tonnes of methane per year, a figure similar to what, up until now, was thought to be the methane emissions of the entire world's oceans (ref. 3). This figure needs to be seen in the context of other sources, however: domestic animals emit about 80 million tonnes a year, for example.

More worryingly though, the same team made estimates of the methane present as free gas and methane hydrate beneath or within the ~1.5 million sq km of the submarine permafrost of the ESAS. The total came to >1000 Gt. The area of this permafrost affected by active fault zones and by open taliks - zones of permafrost that have melted - was stated to be 1-2% and 5-10% of the total area respectively. As such zones are exactly those through which buried methane can escape from under the permafrost, they went on to suggest that up to 50Gt of methane hydrate was at risk of destabilisation leading to "abrupt release at any time" (ref. 4).

That is a colossal figure, when put against annual anthropogenic methane emissions which in 2010 were approximately 275 million tonnes (or 0.275 Gt). Methane is a far more potent greenhouse gas than carbon dioxide - by a factor of 25 (global warming potential as stated in the IPCC AR4) - so that a 50 Gt methane release would be like releasing 40 years' worth of anthropogenic carbon dioxide emissions (at 2009 emission levels) all at once. However, there are some issues with cranking atmospheric methane levels up in this drastic way.

The first problem is that in none of the glacial-interglacial transitions of the past 400,000 years has a sudden large methane-spike been recorded. Ice-core data instead reveal transitions from 0.4ppm (glacials) to 0.8ppm (interglacials) and back. Such records would tend to suggest that no such releases occurred during this period of geological time despite drastic fluctuations in climate. Does that suggest that large-scale abrupt methane outbursts are rather unlikely? Leading on from that, the second problem is finding a physical mechanism by which such an abrupt release of that magnitude could actually happen: so far, on a subshelf environment where major undersea landslides are unlikely, nobody has proposed a detailed mechanism by which that could happen.

Furthermore, a recent permafrost modeling study (ref. 2) has indicated that permafrost melting lags behind changes in surface temperature: after 25 years of the summer seafloor warming reported above, in the model the upper boundary of the subsea permafrost deepened by only a metre. This is one of the current controversies associated with ESAS research: has the model accurately depicted the actual situation? The team who did the modelling study have attibuted the observed methane outgassing to "degradation of subsea permafrost that is due to the long-lasting warming initiated by permafrost submergence about 8000 years ago rather than from those triggered by recent Arctic climate changes". Although they accept that severe subsea permafrost degradation will occur in about a thousand years' time, they see the current degassing as nothing new. Which of these views will turn out to be correct?

Controversy, however, does not invite complacency. Any increased Arctic methane flux, tapping into vast stores of steadily destabilising methane hydrate, has the potential to keep going over a considerable time-period as a response to warmer (and rising) sea temperatures. We certainly do not need any feedbacks that bring additional natural sources of powerful greenhouse gases to the table, yet that is exactly what we risk up in the Siberian Arctic. The big questions that we now need the answers to are for how long has this outgassing been going on, does it appear to be intensifying and how might a colossal and rapid outburst occur. These are among the points we will be raising with the people on the ground and the answers from our interview with Dr Natalia Shakhova, part two of this post, will soon be appearing, here on Skeptical Science. In the meantime, David Archer, who has worked extensively with gas hydrates, looks at some release scenarios over at Realclimate, here and here.

References

1. Archer, D (2006): Destabilization of methane hydrates: a risk analysis. A Report Prepared for the German Advisory Council on Global Change (40pp). PDF

2. Dmitrenko, I.A., Kirillov, S.A., Tremblay, L.B., Kassens, H., Anisimov, O.A., Lavrov, S.A., Razumov, S.O. & Grigoriev, M.N. (2011): Recent changes in shelf hydrography in the Siberian Arctic: Potential for subsea permafrost instability. Journal of Geophysical Research, 116, C10027. Abstract

3. Shakhova NE, Semiletov I, Salyuk A, Yusupov V, Kosmach D, Gustafsson O (2010): Extensive methane venting to the atmosphere from sediments of the East Siberian Arctic shelf. Science, 327:1246-1250. Abstract

4. Shakhova NE, Semiletov I, Salyuk A, Yusupov V, Kosmach D (2008). Anomalies of methane in the atmosphere over the East Siberian shelf.  Geophysical Research Abstracts 10, EGU2008-A-01526. Abstract

0 0

Printable Version  |  Link to this page

Comments

Comments 1 to 27:

  1. What could possibly go wrong? I can't wait for part 2
    0 0
  2. Excellent summary of background to methane situation - thanks. DaveW
    0 0
  3. I think the text from the post (last graf) that perfectly summarizes the situation is: "We certainly do not need any feedbacks that bring additional natural sources of powerful greenhouse gases to the table, yet that is exactly what we risk up in the Siberian Arctic. The big questions that we now need the answers to are for how long has this outgassing been going on, does it appear to be intensifying and how might a colossal and rapid outburst occur." What worries me most (aside from the obvious) is how so much of the conversation tends to pendulum between "imminent doom" and "nothing to see here, move along". We are doing such a spectacularly bad job of curtailing our GHG emissions worldwide (not to mention the plans of China and India to built a massive number of new coal plants in the next 25 years, and the US' determination to embrace yet another fossil fuel, NG), that any non-trivial feedback is very bad news. The methane hydrate and permafrost contributions don't have to be something out of a cheesy disaster movie to be alarming; if they add up to "only" one or two billion tons of CO2eq/year, that's another wedge of emissions of that size we have to find a way to cut, even though we currently can't even make worldwide emissions level off.
    0 0
  4. How much does methane contribute to excess Arctic warming (relative to global warming) considering that the concentrations are somewhat higher there (1800 vs 1600 ppm)?

    Why there is not more global warming now considering that preindustrial methane was 650 ppm? Also considering the ice core record with higher temperatures in previous interglacials, why wasn't more methane released then?

    (click for larger)
    0 0
  5. A bit more about the GHSZ and GG (geothermal gradient), from the permafrost wiki: At mean annual soil surface temperatures below −5 °C (23 °F) the influence of aspect can never be sufficient to thaw permafrost and a zone of continuous permafrost (abbreviated to CPZ) forms. There are also “fossil” cold anomalies in the Geothermal gradient in areas where deep permafrost developed during the Pleistocene that still persists down to several hundred metres http://en.wikipedia.org/wiki/Permafrost
    0 0
  6. Eric (skeptic) @4, your first graph is a bit hard to read, so I thought this one might be useful for comparison (note the concentrations are in parts per billion for Methane): The formula for the radiative forcing of Methane is not as simple as that for CO2, so I shall simply consult the graph below, and inform you that the radiative forcing of Methane relative the the preindustrial era is 0.23 W/m^2, or just 13% of the equivalent forcing from CO2. David Archer discusses potential impacts of the release of Methane from thawing tundra. By his calculation a worst case impact would raise the radiative forcing to about 5 W/m^2 which we would expect to have a severe impact. However, in his (disputed) estimation, that worst case scenario is very unlikely, with more probably scenarios having much lower impacts.
    0 0
  7. To add onto Tom's comment above, one needs to keep the current levels of atmospheric methane in perspective. The man-made hockey stick rise in methane levels is documented here: [Source] Gives quite a different perspective than evident from Eric (skeptic)'s comment above. Shows what was missing from methane levels in earlier times: the man-made hockey stick component. Like an ice rink without a puck...
    0 0
  8. More intelligence and estimates from the draft paper by Shakhova and Semiletov http://www.americanwx.com/bb/index.php/topic/30926-this-is-not-good/page__pid__1278205__st__455#entry1278205
    0 0
  9. @ Eric 4 : that's ppBillion for methane
    0 0
  10. I think Eric's first graph is meant to convey that there's more CH4 in the high latitudes. Since there's also more warming in the high latitudes, is the high CH4 related to this?
    0 0
  11. Pressurized laboratory experiments show no stable carbon isotope fractionation of methane during gas hydrate dissolution and dissociation ..measured δ13C-CH4 values near gas hydrates are not affected by physical processes, and can thus be interpreted to result from either the gas source or associated microbial processes http://onlinelibrary.wiley.com/doi/10.1002/rcm.5290/full
    0 0
  12. So my comment in #11 relates to "The first problem is that in none of the glacial-interglacial transitions of the past 400,000 years has a sudden large methane-spike been recorded."
    0 0
  13. RE .." the second problem is finding a physical mechanism by which such an abrupt release of that magnitude could actually happen: so far, on a subshelf environment where major undersea landslides are unlikely, nobody has proposed a detailed mechanism by which that could happen" Page 5 - 34 Processes in methane release from the seabed and subsequently from sea to atmosphere The possible sources of CH4 in the Arctic coastal seas include sediment microbial activity, natural seeps, and gas hydrate destabilization (Kvenvolden et al., 1993). Methanogenesis can occur at any depth (Koch et al., 2009). The present understanding of the mechanisms that control the current thermal state and stability of submarine permafrost and of seabed CH4 deposits is mostly based on modeling results. These results are very controversial and suggest a wide range of possible current states of submarine permafrost (Soloviev et al., 1987; Kvenvolden et al., 1992, 1993; Kim et al., 1999; Delisle, 2000; Romanovskii and Hubberten, 2001; Romanovskii et al., 2005; Gavrilov, 2008). Saline waters affect permafrost formation (Osterkamp, 2001), and according to Osterkamp and Harrison (1985) the reduction in thickness of ice-bearing permafrost determined by the salinity of sub-permafrost waters can be hundreds of metres. In addition, Delisle (2000) predicted that open taliks can form under the warming effect of large river flows. However, Romanovskii et al. (2000) and Romanovskii and Hubberten (2001) argued against downward destabilization of subsea permafrost and suggested that upward warming through the geothermal heat flux predominated. Destabilization becomes evident by the formation of CH4 migration pathways through the seabed (Kvenvolden, 2002). They appear as pockmarks, mud volcanoes, funnels, chimneys, and pingo-like structures, and they might not be morphologically specified (Hovland et al., 1993; Judd, 2004; Paull et al., 2007). Additional pathways could be via submerged thaw lakes, which by the time of inundation were underlain by taliks, thereby providing a vent (Romanovskii et al., 2005). In addition, depressions found in the East Siberian Arctic Shelf bottom topography could be interpreted as a typical thermokarst terrain similar to the landscape characteristic of the Siberian Lowland (Schwenk et al., 2006; Rekant et al., 2009). Subsea permafrost does not necessarily represent a rocklike, ice-bonded layer but is sometimes ice free under negative temperatures due to freezing-point depression by salinity, which allows gases to escape (Himenkov and Brushkov, 2007). A number of additional factors allow temporary permeability of submarine permafrost, and these include permafrost breaks due to thermal contraction, settling and adjustment of sediments, and endogenous seismicity (Osterkamp and Romanovsky, 1999). Gaseous CH4 can escape through the seabed into the water by means of air voids, channels of unfrozen water, and fissures within the ice (Biggar et al., 1998; McCarthy et al., 2004; Arenson and Sego, 2006). http://amap.no/swipa/CombinedDraft.pdf
    0 0
  14. From above URL 5.3.4.3. Trace gas emissions from subsea permafrost Since the Arctic Climate Impact Assessment (ACIA, 2005), there have been recent advances in measuring and estimating large-scale emissions of carbon from the Arctic coastal seas (e.g., Shakhova et al., 2010a). These new studies have resulted in much higher estimates of carbon emissions than those from earlier studies, with more profound implications for feedback to the climate system. The destabilization of submarine permafrost has significant implications for global climate. Current estimates of the amount of CH4 that could be released from the Arctic continental shelf (7 million km2) during the short Arctic summer (100 days), based only on diffusive fluxes, is as high as 5 Tg of CH4 (Shakhova et al., 2010b). This is a considerable increase on the ~0.1 Tg previously estimated by Kvenvolden et al. (1993). The current estimate reflects the contribution of only a very small fraction of the total CH4 fluxes and other significant components exist. One such component is CH4 release during the deep autumn convection, which allows water from the East Siberian Arctic Shelf to mix from top to bottom (Kulakov et aal., 2003). A significant late-summer potential CH4 release to the Atmosphere might therefore occur during only a few weeks Another mechanism of CH4 ventilation is deep convection in the flaw polynyas (band-like ice-free areas), which form simultaneously with land-fast ice in November. Flaw polynyas reach tens of kilometres in width and migrate out of fast ice hundreds of kilometres northward (Smolyanitsky et al., 2003), providing a pathway for CH4 to escape to the atmosphere during the Arctic winter. Fluxes from the European Arctic polynyas are 20- to 200-fold higher than the ocean average and, as long as concentrations of dissolved CH4 in the bottom water do not exceed 50 nM, can reach 0.02 Tg CH4 a year A significant amount of CH4 could also be released during the ice break-up period from areas not affected by polynyas. In these areas, dissolved CH4 accumulates beneath the sea ice as it does in northern lakes (Semiletov, 1999). Additional release of CH4 via these mechanisms would contribute to an increase in the diffusive fraction of air-sea CH4 exchange, but the most important and still unmeasured component is ebullition. Assuming that ebullition might contribute to the total transport of CH4 in the East Siberian Arctic Shelf as much as it does in northern lakes (50% to 90%), the annual release might reach from 10 to 50 Tg of CH4. Note that this amount does not include non-gradual or sudden releases of CH4, which are likely to take place in some areas where hydrates decay (Leifer et al., 2006). The amount of CH4 that could theoretically be released in the future is enormous. The volume of gas hydrates that underlie the Arctic Ocean seabed is estimated at 2000 Gt of CH4 (Makogon et al., 2007). About 85% of the Arctic Ocean sedimentary basins occur within the continental shelf so that within the East Siberian Arctic Shelf alone, which comprises about 30% of the area of the Arctic shelf, hydrate deposits could contain around 500 Gt of CH4. An additional two-thirds of that amount (around 300 Gt) is stored in the form of free gas (Ginsburg and Soloviev, 1994). Because most submarine permafrost is relict terrestrial permafrost, the carbon pool held can be estimated from knowledge on current terrestrial carbon storage to include not less than 500 Gt of carbon within a 25 m thick permafrost body (Zimov et al., 2006a), 2 to 65 Gt of CH4 as hydrates (McGuire et al., 2009) together with a significant amount of non-hydrate carbon. The total amount of carbon preserved within the Arctic continental shelf is still debatable but it could be around 1300 Gt of carbon, from which 800 Gt is previously formed CH4 ready to be suddenly released when appropriate pathways develop. Release of only 1% of this reservoir would more than triple the atmospheric mixing ratio of CH4, probably triggering abrupt climate change, as predicted by modeling results (Archer and Buffett, 2005).
    0 0
  15. To clarify my post in #12 "The first problem is that in none of the glacial-interglacial transitions of the past 400,000 years has a sudden large methane-spike been recorded." Why should it? The glacial-interglacial are established through the periodical Milankovitch cycle, and methane values doubled.
    0 0
  16. Daniel Bailey, thanks for posting that graph, I didn't mean to suggest that there is not a large (over 2.5x) manmade hockey stick. But I was wondering how much is caused by our direct emissions perhaps in China and unconventional gas production (http://www.sustainablefuture.cornell.edu/news/attachments/Howarth-EtAl-2011.pdf) and how much from the rise in Arctic temperature as described in the article? It seems to me that direct methane production predominates for at least two reasons, the lack of prior interglacial rise and the recent pause perhaps corresponding to the decline of the former Soviet Union (http://165.91.85.82/class/atmo689-gs/lectureweek4/2003GL018126.pdf). But what about the more recent resumption?
    0 0
  17. For anthropogenic methane production, that is tracked by the EPA (along with other non-CO2 GHG and their sector emissions sources) and is available replete with projections through 2020 here: http://www.epa.gov/climatechange/economics/downloads/GlobalAnthroEmissionsReport.pdf The specific methane emissions data you wish are available in Appendix A-2, starting on page 155. Other useful info + eye-candy is here: http://www.globalmethane.org/documents/analysis_fs_en.pdf Apologies, but I lack the time to do the comparison you seek.
    0 0
  18. Eric#16, You raise an interesting point. In the graph of atmospheric methane concentration posted by Tom C in #6, the years 1999-2006 are conspicuously flat. Since 2006, there's an equally conspicuous change in trend. Compare that with the graph below, showing US natural gas production: --source advanced fracking technologies starting becoming available about five years ago and boosted domestic gas production by almost 25% since 2006. The boom in unconventional shale gas made America the world's No. 1 producer of natural gas, when it passed Russia in 2009. Your link to Howarth 2011 makes a strong case that methane emissions from hydro-fractured shale gas production is significantly higher than from conventional gas. ... 3.6% to 7.9% of the methane from shale-gas production escapes to the atmosphere in venting and leaks over the lifetime of a well. These methane emissions are at least 30% more than and perhaps more than twice as great as those from conventional gas. The higher emissions from shale gas occur at the time wells are hydraulically fractured—as methane escapes from flow-back return fluids—and during drill out following the fracturing. As you suggest, it would be a very interesting study (albeit off-topic here) to compare volumes released from these two sources. Is it possible that as new gas production continues increasing, we are doubling down on methane? The great science experiment in the sky continues.
    0 0
  19. Spikes in methane at the end of the last an previous ice periods withing the present 2.5m year ice age were not observed but spikes in Carbon dioxide were. Since the end of these ice periods was in sinc with Milankovitch obliquity, it is unlikely that the rise in CO2 was the cause of the start of the interglacials but rather the result. Since methane, on a geological time scale, is instantly converted to CO2, we would be unlikely to pick up a methane spike (in ice cores) but rater to observe it as a Carbon dioxide spike. The likely source of this methane would be the accumulation of methane clathrate under the continental ice sheets with the methane, over the 100,000 year life of the ice sheet coming from underground shale, coal and oil plus the anaerobic break down of organic material This would be "0ld" carbon and so carbon dating from the end of the most recent ice period might show some carbon dating anomalies. http://mtkass.blogspot.com/2011/08/end-of-ice-ages.html
    0 0
  20. 1 Gt of methane in the Arctic? What would be the impact of such a release?
    0 0
  21. Semiletov 2012 On carbon transport and fate in the East Siberian Arctic land–shelf–atmosphere system
    0 0
  22. Hi William, Carbon dioxide fluctuations from glacials to interglacials were only in the range of ~180-280 ppm, with multiple sources available including, yes, methane oxidation. We'd be looking for something a lot bigger in the event of a multi-gigaton CH4 release.
    0 0
  23. You quoted from the abstract of http://onlinelibrary.wiley.com/doi/10.1002/rcm.5290/full: "values near gas hydrates .... can thus be interpreted to result from either the gas source or associated microbial processes" The paper isn't saying samples found near a gas hydrate definitely came from the gas hydrate. It's discussing whether it's possible to tell that or not. Answer: maybe. A clearer description is in the Conclusion: "CONCLUSIONS ... These results suggest than any measured changes in the isotopic values of environmental samples are a direct result of some other fractionation process, such as a different gas source or microbial processes."j The word 'different' was omitted from the Abstract. The ratio may be useful to identify gas found in the water as originating either from gas hydrate or from "a different gas source or microbial process" -- but they found an unexpected change in ratio during formation of the hydrate which is going to take more lab work to characterize before this test can be relied on, if it can.
    0 0
  24. Re #19 William Huybers and Langmuir (2009) proposed that glacially induced volcanism, triggered by the depressurization of the upper mantle increased the frequency of volcanic eruptions worldwide, and thus plays a key role in the atmospheric CO2 balance and ice‐age cycles. A link between arc volcanism and the 41 ka Milankovitch periodicity also emerges from a statistical evaluation of macroscopically visible marine tephra deposits near circum‐Pacific arcs (Jegen et al., 2010). On a more immediate scale, Tuffen (2010) concluded that ongoing glacier recession likely will result in intensification of eruptions worldwide, with a corresponding increase in associated hazards. link
    0 0
  25. Hank #23, Thanks for flagging that paper up - it's been added to the pile for my next bit of investigation into the whole gas hydrates topic.
    0 0
  26. Two points.  1) Methane is only 25 times as potent a green house gas if it is being given out evenly over the years.  With an accelerated rate of release, it's potency approaches 140 times that of Carbon dioxide.  The rate looks to be accelerating now.

    http://mtkass.blogspot.co.nz/2013/03/the-real-strength-of-methane.html

    2) There is a reasonable chance that a sudden release of methane from under continental glaciers would not show up in bubbles in Antarctic and Greenland ice cores as methane.  The top 70 or so meters of accumulating ice sheets remains in difusion contact with the atmosphere and methane, with it's 7 year half life is reletively quickly oxidized.  An ice core could show a sudden methane pulse from under retreating ice sheets as Carbon dioxide.

    http://mtkass.blogspot.co.nz/2011/09/continental-glacier-meltdown.html

    0 0
  27. Is this the case?
    “Michael G. O'Brien
    James Charles
    What has happened during the past 125K years is uplift of the ESAS clathrate deposits from their formation and safe zone 700 meters deep to 50 meters deep by mantle convection . At that depth when the ice is gone latent heat takes two years to start the chain reaction of methane runaway. They were not import last interglacial because they were safely deep enough then. “
    www.facebook.com/JoseBarbaNueva/posts/10221619560135827

    I emailed Prof. D. E. Archer and he was kind enough to reply.

    "This doesn’t make much sense to me. Mantle convection does not move methane hydrate, because the hydrate is in the sediments on the crust, not in the mantle. There isn’t a chain reaction of melting; melting takes heat rather than giving it off, like regular ice.

    hope this helps. "

    0 0

You need to be logged in to post a comment. Login via the left margin or if you're new, register here.


The Consensus Project Website

THE ESCALATOR

(free to republish)


© Copyright 2024 John Cook
Home | Translations | About Us | Privacy | Contact Us