Climate Science Glossary

Term Lookup

Enter a term in the search box to find its definition.

Settings

Use the controls in the far right panel to increase or decrease the number of terms automatically displayed (or to completely turn that feature off).

Term Lookup

Settings


All IPCC definitions taken from Climate Change 2007: The Physical Science Basis. Working Group I Contribution to the Fourth Assessment Report of the Intergovernmental Panel on Climate Change, Annex I, Glossary, pp. 941-954. Cambridge University Press.

Home Arguments Software Resources Comments The Consensus Project Translations About Support

Twitter Facebook YouTube Mastodon MeWe

RSS Posts RSS Comments Email Subscribe


Climate's changed before
It's the sun
It's not bad
There is no consensus
It's cooling
Models are unreliable
Temp record is unreliable
Animals and plants can adapt
It hasn't warmed since 1998
Antarctica is gaining ice
View All Arguments...


Username
Password
New? Register here
Forgot your password?

Latest Posts

Archives

Is the CO2 effect saturated?

What the science says...

Select a level... Basic Intermediate Advanced

The notion that the CO2 effect is 'saturated' is based on a misunderstanding of how the greenhouse effect works.

Climate Myth...

CO2 effect is saturated

"Each unit of CO2 you put into the atmosphere has less and less of a warming impact. Once the atmosphere reaches a saturation point, additional input of CO2 will not really have any major impact. It's like putting insulation in your attic. They give a recommended amount and after that you can stack the insulation up to the roof and it's going to have no impact." (Marc Morano, as quoted by Steve Eliot)

At-a-Glance

This myth relies on the use (or in fact misuse) of a particular word – 'saturated'. When someone comes in from a prolonged downpour, they may well exclaim that they are saturated. They cannot imagine being any wetter. That's casual usage, though.

In science, 'saturated' is a strictly-defined term. For example, in a saturated salt solution, no more salt will dissolve, period. But what's that got to do with heat transfer in Earth's atmosphere? Let's take a look.

Heat-trapping by CO2 in the atmosphere happens because it has the ability to absorb and pass on infra-red radiation – it is a 'greenhouse gas'. Infra-red is just one part of the electromagnetic spectrum, divided by physicists into a series of bands. From the low-frequency end of the spectrum upwards, the bands are as follows: radio waves, microwaves, infrared, visible light, ultraviolet, X-rays, and gamma rays. Gamma rays thus have a very high-frequency. They are the highest-energy form of radiation.

As our understanding of the electromagnetic spectrum developed, it was realised that the radiation consists of particles called 'photons', travelling in waves. The term was coined in 1926 by the celebrated physicist Gilbert Lewis (1875-1946). A photon's energy is related to its wavelength. The shorter the wavelength, the higher the energy, so that the very high-energy gamma-rays have the shortest wavelength of the lot.

Sunshine consists mostly of ultraviolet, visible light and infra-red photons. Objects warmed by the sun then re-emit energy photons at infra-red wavelengths. Like other greenhouse gases, CO2 has the ability to absorb infra-red photons. But CO2 is unlike a mop, which has to be wrung out regularly in order for it to continue working. CO2 molecules do not get filled up with infra-red photons. Not only do they emit their own infra-red photons, but also they are constantly colliding with neighbouring molecules in the air. The constant collisions are important. Every time they happen, energy is shared out between the colliding molecules.

Through those emissions and collisions, CO2 molecules constantly warm their surroundings. This goes on all the time and at all levels in the atmosphere. You cannot say, “CO2 is saturated because the surface-emitted IR is rapidly absorbed”, because you need to take into account the whole atmosphere and its constant, ongoing energy-exchange processes. That means taking into account all absorption, all re-emission, all collisions, all heating and cooling and all eventual loss to space, at all levels.

If the amount of radiation lost to space is equal to the amount coming in from the Sun, Earth is said to be in energy balance. But if the strength of the greenhouse effect is increased, the amount of energy escaping falls behind the amount that is incoming. Earth is then said to be in an energy imbalance and the climate heats up. Double the CO2 concentration and you get a few degrees of warming: double it again and you get a few more and on and on it goes. There is no room for complacency here. By the time just one doubling has occurred, the planet would already be unrecognisable. The insulation analogy in the myth is misleading because it over-simplifies what happens in the atmosphere.

Please use this form to provide feedback about this new "At a glance" section. Read a more technical version below or dig deeper via the tabs above!


Further details

This myth relies on the use of a word – saturated. When we think of saturated in everyday use, the term 'soggy' comes to mind. This is a good example of a word that has one meaning in common parlance but another very specific one when thinking about atmospheric physics. Other such words come to mind too. Absorb and emit are two good examples relevant to this topic and we’ll discuss how they relate to atmospheric processes below.

First things first. The effect of CO2 in the atmosphere is due to its influence on the transport of 'electromagnetic radiation' (EMR). EMR is energy that is moving as x-rays, ultraviolet (UV) light, visible light, infrared (IR) radiation and so on (fig. 1). Radiation is unusual in the sense that it contains energy but it is also always moving, at the speed of light, so it is also a form of transport. Radiation is also unusual in that it has properties of particles but also travels with the properties of waves, so we talk about its wavelength.

The particles making up radiation are known as photons. Each photon contains a specific amount of energy, and that is related to its wavelength. High energy photons have short wavelengths, and low energy photons have longer wavelengths. In climate, we are interested in two main radiation categories - firstly the visible light plus UV and minor IR that together make up sunshine, and secondly the IR from the earth-atmosphere system.

The Electromagnetic Spectrum

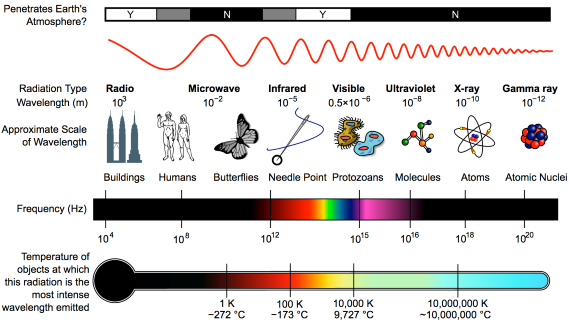
Fig. 1: diagram showing the full electromagnetic spectrum and its properties of the different bands. Image: CC BY-SA 3.0 from Wikimedia.

CO2 has the ability to absorb IR photons – it is a 'greenhouse gas'.So what does “absorb” mean, when talking about radiation? We are all familiar with using a sponge to mop up a water spill. The sponge will only absorb so much and will not absorb any more unless it's wrung out. In everyday language it may be described, without measurements, as 'saturated'. In this household example, 'absorb' basically means 'soak up' and 'saturated' simply means 'full to capacity'. Scientific terms are, in contrast, strictly defined.

Now let's look at the atmosphere. The greenhouse effect works like this: energy arrives from the sun in the form of visible light and ultraviolet radiation. A proportion reaches and warms Earth's surface. Earth then emits the energy in the form of photons of IR radiation.

Greenhouse gases in the atmosphere, such as CO2 molecules, absorb some of this IR radiation, then re-emit it in all directions - including back to Earth's surface. The CO2 molecule does not fill up with IR photons, running out of space for any more. Instead, the CO2 molecule absorbs the energy from the IR photon and the photon ceases to be. The CO2 molecule now contains more energy, but that is transient since the molecule emits its own IR photons. Not only that: it's constantly colliding with other molecules such as N2 and O2 in the surrounding air. In those collisions, that excess energy is shared with them. This energy-sharing causes the nearby air to heat up (fig. 2).

CO2 heat transfer

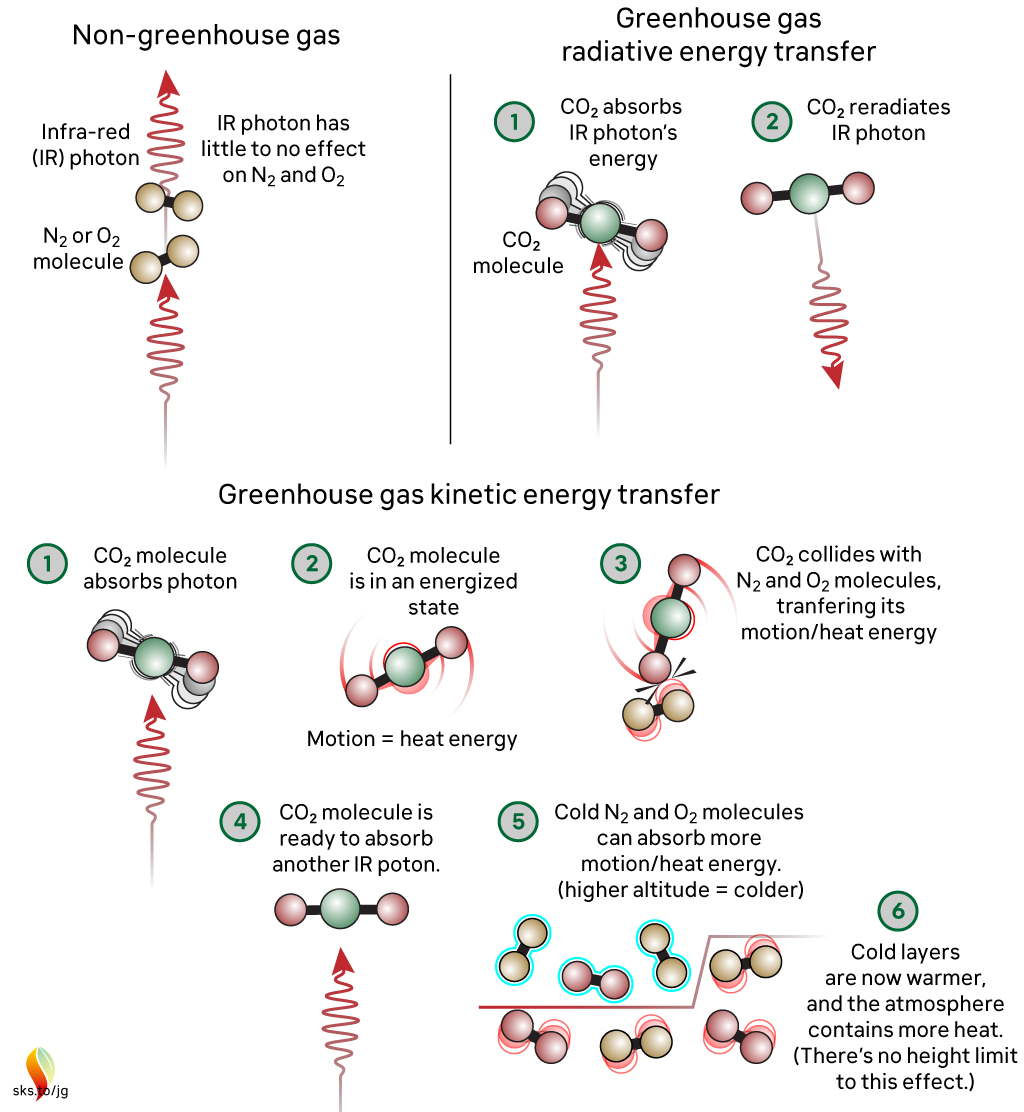
Fig. 2: The greenhouse effect in action, showing the interactions between molecules. The interactions happen at all levels of the atmosphere and are constantly ongoing. Graphic: jg.

The capacity for CO2 to absorb photons is almost limitless. The CO2 molecule can also receive energy from collisions with other molecules, and it can lose energy by emitting IR radiation. When a photon is emitted, we’re not bringing a photon out of storage - we are bringing energy out of storage and turning it into a photon, travelling away at the speed of light. So CO2 is constantly absorbing IR radiation, constantly emitting IR radiation and constantly sharing energy with the surrounding air molecules. To understand the role of CO2, we need to consider all these forms of energy storage and transport.

So, where does 'saturation' get used in climate change contrarianism? The most common way they try to frame things is to claim that IR emitted from the surface, in the wavelengths where CO2 absorbs, is all absorbed fairly close to the surface. Therefore, the story continues, adding more CO2 can’t make any more difference. This is inaccurate through omission, because either innocently or deliberately, it ignores the rest of the picture, where energy is constantly being exchanged with other molecules by collisions and CO2 is constantly emitting IR radiation. This means that there is always IR radiation being emitted upwards by CO2 at all levels in the atmosphere. It might not have originated from the surface, but IR radiation is still present in the wavelengths that CO2 absorbs and emits. When emitted in the upper atmosphere, it can and will be lost to space.

When you include all the energy transfers related to the CO2 absorption of IR radiation – the transfer to other molecules, the emission, and both the upward and downward energy fluxes at all altitudes - then we find that adding CO2 to our current atmosphere acts to inhibit the transfer of radiative energy throughout that atmosphere and, ultimately, into space. This will lead to additional warming until the amount of energy being lost to space matches what is being received. This is precisely what is happening.

The myth reproduced at the top – incorrectly stating an analogy with roof insulation in that each unit has less of an effect - is misleading. Doubling CO2 from 280 ppm to 560 ppm will cause a few degrees of warming. Doubling again (560 to 1130 ppm) will cause a similar amount of additional warming, and so on. Many doublings later there may be a point where adding more CO2 has little effect, but recent work has cast serious doubt on that (He et al. 2023). But we are a long, long way from reaching that point and in any case we do not want to go anywhere near it! One doubling will be serious enough.

Finally, directly observing the specific, global radiative forcing caused by well-mixed greenhouse gases has - to date - proven elusive. This is because of irregular, uncalibrated or limited areal measurements. But very recently, results have been published regarding the deep reinterrogation of years of data (2003-2021) from the Atmospheric Infrared Sounder (AIRS) instrument on NASA's Aqua Satellite (Raghuraman et al. 2023). The work may well have finally cracked the long-standing issue of how to make finely detailed, consistent wavelength-specific measurements of outgoing long-wave radiation from Earth into space. As such, it has opened the way to direct monitoring of the radiative impact (i.e. forcing + feedback) of greenhouse gas concentration changes, thereby complimenting the Keeling Curve - the longstanding dataset of measured CO2 concentrations, down at the planet's surface.

Note: Several people in addition to John Mason were involved with updating this basic level rebuttal, namely Bob LoblawKen Rice and John Garrett (jg).

Last updated on 31 December 2023 by John Mason. View Archives

Printable Version  |  Offline PDF Version  |  Link to this page

Argument Feedback

Please use this form to let us know about suggested updates to this rebuttal.

Related Arguments

Further reading

V. Ramanthan has written a comprehensive article Trace-Gas Greenhouse Effect and Global Warming.

Further viewing

Video by Rosh Salgado on his "All about Climate" YouTube channel in which he debunks Will Happer's claim that the CO2 effect is saturated in the atmosphere:

Comments

Prev  1  2  3  4  5  6  7  8  9  10  11  12  13  14  15  16  17  18  19  20  Next

Comments 126 to 150 out of 713:

  1. KR (RE: 125), "As has been said to you before, the windowing effect (where IR goes straight from the surface to space) is only part of the reduction in IR. The rest occurs in the full absorption bands (where IR from the surface makes it only 10's or 100's of meters before absorption)" When I refer to the "window", I mean transmittance - the amount of the whole spectrum of emitted surface power that passes through to space without being absorbed by the atmosphere (not just one particular band). This is the amount that should reduce by 7.4 W/m^2 if the referenced 3.7 W/m^2 is all incident on the surface as claimed when CO2 is doubled. There appears to be some confusion in regards to the definition or use of the term "window". Some refer to this as the mostly transparent region between about 8u and 13u, but this is not how I use the term. Nor do I believe this is how 'novandilcosid' is using the term either. You don't seem to understand that there are other parts of the spectrum besides the CO2 absorbing bands that are not completely saturated and a portion of surface emitted energy passes through them unabsorbed out to space. The aggregate amount that passes through the whole spectrum of emitted surface energy is the "window" or transmittance.
  2. KR (RE: 125), Trenberth et al 2009 has a transmittance or "window" of 70 W/m^2 (40 through the clear sky and 30 through the clouds). If when CO2 is doubled, the "window" decreases by 3.7 W/m^2 (or 7.4 W/m^2) and 1.85 goes up out to space and 1.85 goes down to the surface (or 3.7 goes up and 3.7 goes down) (*Trenberth actually has it being 52% up and 48% down).
  3. RW1 - Got it, you are going to continue to disregard the spectra between 600-750 microns, let alone around 450 microns, where IR from the surface cannot reach space unintercepted, and where increasing CO2 concentrations raise the effective emission to space to higher/colder altitudes. Quite frankly, I cannot take your discussion of the greenhouse effect seriously when you ignore major components like this.
  4. KR (RE: 128), I'm not disregarding any spectra. I'm also well aware there are bands that are saturated. I also agree that the CO2 absorbing bands are not saturated - there is room on the wings to expand and capture a little more outgoing surface power. This is where the additional 3.7 W/m^2 from 2xCO2 is coming from.
  5. RW1 @127, I don't want to buy into another fruitless conversation but, Trenberth 09 shows a 40 Watt/m^2 atmospheric window, and also shows 30 W/m^2 emitted to space from cloud surfaces, with another 169 W/m^2 emitted from the atmosphere other than from clouds. These three combine to make up the OLR.
  6. Tom Curtis (RE: 130), "RW1 @127, I don't want to buy into another fruitless conversation but, Trenberth 09 shows a 40 Watt/m^2 atmospheric window, and also shows 30 W/m^2 emitted to space from cloud surfaces, with another 169 W/m^2 emitted from the atmosphere other than from clouds. These three combine to make up the OLR." I don't see how this is possible. Think about it. How can the clear sky atmosphere emit 169 W/m^2 to space when surface only emits about 131 W/m^2 to the clear sky in the first place? We know this because the ISCCP data says clouds cover 2/3rds of the surface, which means 1/3rd of the surface is clear sky. 396 W/m^2 x 0.33 = 131 W/m^2 emitted from the surface to the clear sky.
  7. John Cook, Moderators - Might I suggest a thread on the Trenberth diagram and energy budget? This has been repeatedly misunderstood, misquoted, and misused for more instances of mathturbation than just about any graphic I can think of. - It's not a model, contains no information whatsoever about interdependent changes of climate elements upon perturbation. - It's a four layer accounting of energy interchanges between these layers (Sun, surface, atmosphere, space). Some of these exchanges (161 insolation, the 40 W/m^2 "window" from surface to space) skip a layer, most do not. - Energy entering a level of this accounting does not retain identity/sourcing with what goes out; it's all joules, all the way down, which for example is why the atmosphere can radiate 169 W/m^2. - If somebody disagrees with a number in the Trenberth budget, they should take it up with Trenberth, who has done a clearly sourced and researched work with plenty of references to look at for each individual number. "I don't see how this is possible" is not a valid objection; it's certainly not science.
  8. Tom Curtis (RE: 130), I might also add that Trenberth's "window" of 70 W/m^2 is not referenced in the paper. It appears to just be a rough estimate or guess. He also has greater than half of the surface power absorbed by the atmosphere being emitted up out to space, which is inaccurate. To get half up and half down requires a "window" of 82 W/m^2 with his numbers (396 - 82 = 314; 314/2 = 157; 239 + 157 = 396 at the surface). Even this site's hfranzen from first the link I posted in #124 has diagram on page 19 of his paper showing a "window" of 88 W/m^2. Take a look: "Flux balance on the Earth"
    Response: [muoncounter] We've been through the half up/half down bit before. By assuming that model, your argument is turning circular. You're also veering off topic (and it's hard to do both at the same time). This thread is on CO2 absorption band saturation.
  9. muoncounter, OK. Maybe KR is right and there should be a dedicated thread to the Trenberth diagram and energy budget.
  10. #130 Tom Curtis at 11:21 AM on 26 April, 2011 Trenberth 09 shows a 40 Watt/m^2 atmospheric window That 40 W/m2 is not substantiated anywhere in the paper. It was just pulled into Fig. 1. out of thin air.
    Response:

    [DB] "It was just pulled into Fig. 1. out of thin air."

    Please substantiate, or withdraw, this allegation.

  11. Berényi - The infrared atmospheric window was derived in 1918 from the H2O spectra, first estimated (by hand) in 1928. Now the value of transmitted energy is determined as a side product of the line-by-line radiation models, to distinguish between surface radiation actually transmitting directly to space and atmospheric radiation on the edges of the window also radiating to space. Trenberth may have thought that it wasn't necessary to to spend much time on a value that has been known for >80 years. A value you could have determined with a few moments of web search, I'll note. In my opinion, your language here is skating the thin edges of the Comments Policy regarding accusations of deception.
    Response:

    [DB] Sometimes, in the course of human events, it's necessary to reinvent the wheel.

    As you note, the fact that some then find it necessary to reinvent the flat tire is revealing.

  12. 131, RW1,
    which means 1/3rd of the surface is clear sky. 396 W/m^2 x 0.33 = 131 W/m^2 emitted from the surface to the clear sky.
    I won't get into Trenberth's diagram with you again (entirely). I'll repeat that you don't understand it, you are making invalid assumptions, you don't understand enough of the underlying physics of atmospheric heat transfer, and this is all leading to gross misinterpretations. However, concerning this particular statement of yours about "1/3rd ... clear sky"... First, you can't just assume that because 1/3 of the sky is clear then that the clear sky absorbs 1/3 of the radiation. The ability to absorb long wave radiation is dramatically different between clear sky and clouds (clouds probably absorb substantially more, being made up of a powerful greenhouse gas, but I've never really seen any numbers on this). Clouds and the radiative properties of the surface are also not evenly distributed over the globe, either in space or in time. Everything else is not homogeneous. Second, you cannot ignore the non-radiative components (thermals and the release of latent heat). Third, and most importantly, you cannot ignore a major element which is not included in the diagram, which is the transfer of heat between "clear sky" and clouds. What happens when a cloud dissipates? Does the heat vanish? Is it forced to instantly radiate up to space? Does it fall to the ground with the rain? Hint: When a cloud absorbs LW radiation, it is capable of transferring that heat to the surrounding and pervading atmosphere (remember, a cloud isn't a solid object, it coexists in space with the O2/N2 of the atmosphere). So it doesn't really matter which absorbs the radiation. The atmosphere (consisting of "clear sky" and clouds) absorbs the radiation, and the two cannot be separated into distinct components re this diagram. This diagram is not a GCM. It's just a diagram intended to help communicate the earth's energy budget to the casual viewer, and nothing more. You cannot read as much into it as you are attempting. So, again: 1) You need to study more before you can comment on or interpret Trenberth's diagram. 2) Trenberth's diagram is not the topic of this thread. [This will be my last post on the subject (here), so please don't come back with an angry list of "but what about this?" questions. I'm not biting.]
  13. #136 KR at 22:44 PM on 26 April, 2011 Trenberth may have thought that it wasn't necessary to to spend much time on a value that has been known for >80 years. A value you could have determined with a few moments of web search, I'll note. Really? I thought the proper way to determine values of physical quantities is to measure them. On the other hand Trenberth simply assumes it is 40 W/m2. We can get a deeper insight into his thought process if we consider an old paper of his where the problem is elaborated on briefly. Bulletin of the American Meteorological Society, 1997 Earth's Annual Global Mean Energy Budget J. T. Kiehl & Kevin E. Trenberth "Some of the radiation leaving the atmosphere originates near the earth's surface and is transmitted relatively unimpeded through the atmosphere; this is the radiation from areas where is no cloud and that is present in the part of the spectrum known as the atmospheric window, taken here to be the wavelengths 8-12 µm (Fig. 7). The estimate of the amount leaving via the atmospheric window is somewhat ad hoc. In the clear sky case, the radiation in the window amounts to 99 W m-2 , while in the cloudy case the amount decreases to 80 W m-2, showing that there is considerable absorption and re-emission at wavelengths in the so-called window by clouds. The value assigned in Fig. 7 of 40 W m-2 is simply 38% of the clear sky case, corresponding to the observed cloudiness of about 62%. This emphasizes that very little radiation is actually transmitted directly to space as though the atmosphere were transparent". Taken here to be & somewhat ad hoc, indeed. A value of 40 W/m2 would imply a broadband thermal infrared optical depth of 2.29 (which roughly means the average photon gets absorbed 2.29 times before it escapes to space). On the other hand this value averaged over the entire surface is below 1.9, that is, total thermal radiation flux escaping from surface to space unimpeded is above 60 W/m2. Trenberth's simple calculation makes two omissions. One is the polar window (above wavelength 16 μm), covered only by weak water vapor absorption lines, so in extremely dry regions (like polar ones) a considerable amount of radiation can get through in that frequency band. The other one is clouds. As clouds are always fractal structures, cloud covered surface has a fractal dimension less than 2 (and decreasing poleward). Cloud fraction is usually determined by counting cloudy vs. clear sky grid cells (pixels). However, the finer the grid resolution is, the less the ratio of cloudy pixels will be, because fractals are just like that. It means even in areas categorized as "cloudy" some thermal IR can get through to space unimpeded. Therefore thermal IR radiation flux originating near the earth's surface and transmitted relatively unimpeded through the atmosphere is measured to be more than 40 W/m2, Trenberth's back-of-the-envelope calculation is only good as a lower bound. An error on the order of ~20 W/m2 in one of the components is a serious one if an average planetary imbalance of less than 1 W/m2 is pursued.
  14. Berényi - Very good; looking up the references. Which, I'll note, support the value in the 2009 paper. Does this mean you are withdrawing your accusation of manufactured data? There are a lot of uncertainties in the numbers Trenberth presents, as is clearly discussed in the article: amounts of convective activity, latent heat numbers from precipitation, large scale estimation of the surface radiance covering sufficient points to cover variation, etc. Others are much more certain: backradiation, insolation, and so on. Taken together, they add up to 10's of watts. Does that matter? No. Trenberth's energy budget is not a GCM, not predictive, but rather an overview of the data available adjusted for internal consistency. Running off and arguing about differences within the range of error of individual element uncertainties is not productive. Such decimal point gaming certainly has no traction in proving/disproving any element of the radiative greenhouse effect. I'll note that this discussion is rather off topic - unless, as you seem to be arguing, that you are attempting to find more evidence for the fact that the CO2 effect is indeed not saturated.
  15. RE my comment in 137, I inappropriately said "clouds probably absorb substantially more." I should probably withdraw that assumption upon the realization that while clouds cover on average of 2/3 of the surface, they make up considerably less of the total volume of the troposphere (7%, Lelieveld et al., 1989; Pruppacher and Jaenicke, 1995). This means the atmosphere has opportunities to absorb that same radiation before it reaches the clouds (in the lower, denser part of the atmosphere where there is substantially more CO2 and water vapor), as well as above the clouds. Comparing the outgoing LW radiation by latitude and season versus the cloud distributions by latitude and season demonstrates an even greater imbalance that must be addressed. Obviously, things are a lot more complex, and such a brash, broad assumption was unwarranted. Apologies for the error.
  16. #139 KR at 02:33 AM on 27 April, 2011 Very good; looking up the references. Which, I'll note, support the value in the 2009 paper. No, it does not. It supports only a claim the value in the 2009 paper should be at least 40 W/m2, but it can be larger by a wide margin. Trenberth fails to mention this detail. Does that matter? Yes, definitely. According to Trenberth there is a net heat transport of 23 W/m2 from surface to atmosphere by thermal IR radiation. On the other hand if global average window radiation is more than 60 W/m2, this heat transport is negligible and any net heat transport between surface and atmosphere is mediated by thermals and evaporation. That's a big difference. It means the greenhouse effect is saturated indeed. Surface and atmosphere is in radiative equilibrium (as it should) except for the fraction of radiation that escapes directly to space. For example if effective temperature of the surface is 289 K (16 °C), effective temperature of the atmosphere as seen from the surface is 277 K (4 °C) and window radiation is 62 W/m2, the above relation holds. Value of net heat transport by radiation between surface and atmosphere has enormous physical consequences, so you can't miss it by 10's of watts and still claim the physics is understood.
    Response:

    [DB] Again, please substantiate, or withdraw, your allegation of manufactured data made against Dr. Trenberth.

  17. Berényi - You continue to use a tabulation summary as a model. I would suggest you obtain a modern copy of MODTRANS or other radiation modeling code and look at the results yourself. You should also (as Trenberth did) cross-examine satellite spectra, cloud coverage estimation on a global scale, and distribution of humidity over both ocean and land. Once you've done so, and backed up your calculations, your numbers can be taken seriously. If operating from a summary that has been adjusted for internal consistency, with considerable uncertainty on some items - not even close. Please cf. my last link in this post. Again - are you retracting your accusation of manufactured data? I don't believe I'm alone in finding that deeply insulting to Trenberth et al.
  18. 142, KR,
    I don't believe I'm alone in finding that deeply insulting to Trenberth et al.
    Agreed. Insulting, unfounded, and pretty far over the top (as if his energy budget diagram is or was intended to be anything more than a back-of-the-envelope presentation of energy flow in the system).
  19. 141, BP, I don't quite understand your comment. I think you just have some hurried mistakes in there. Perhaps you can correct them and re-post, or clarify things:
    ...net heat transport of 23 W/m2 from surface to atmosphere by thermal IR radiation...
    The 23 I see in the diagram is reflected visible spectrum radiation. There is also 17 W/m2, but that's for thermals, not "thermal IR radiation." It has nothing to do with radiated heat. Beyond this, you say:
    It means the greenhouse effect is saturated indeed.
    I don't follow you. That is, I don't follow how the proportion of energy from thermals to that escaping through the atmospheric window can have anything to do with whether or not the greenhouse effect is saturated, one way or the other. Honestly, I don't see how anyone could ever take any numbers from such a simple schematic and draw any conclusions whatsoever about the CO2 being saturated. Can you restate your logic more clearly?
  20. #142 KR at 06:04 AM on 27 April, 2011 Again - are you retracting your accusation of manufactured data? I don't believe I'm alone in finding that deeply insulting to Trenberth et al. Listen, I have not said data were manufactured. It just came from nowhere in that paper, that's all. And this claim is true, you can verify it for yourself. "That 40 W/m2 is not substantiated anywhere in the paper. It was just pulled into Fig. 1. out of thin air". Later on I have found the source in a paper written by the same author 12 years earlier, but the 2009 paper lacked any pointer to the source, window radiation is not even mentioned in the text. Also, the calculation in the 1997 paper is somewhat childish, to put it mildly. And presenting a lower bound as a best guess is misleading as well. More importantly, as the lower atmosphere is heated from below (by absorbed short wave radiation at the surface), most of it is either unstable or marginally stable. If there is excess heat at the bottom, it simply overturns the air column, possibly producing some precipitation (and releasing latent heat) as well instead of proceeding upward painfully by repeated radiation emission/absorption events. It is a well known fact thermal conductivity of gases is extremely low. When measuring this quantity, radiative and collisional heat transfer are not separated, so radiative heat transfer inside the atmosphere can't be substantial. Environmental lapse rate is 0.0065 K m-1 while thermal conductivity of air is 0.024 W m-1 K-1 (that of CO2 is even lower, 0.015 W m-1 K-1). It means upward heat transfer without mass exchange is about 0.16 mW/m2, which is negligible. If there is a ~23 W/m2 thermal flux in a substance along a 6.5×10⁻³ K m-1 temperature gradient (with no mass exchange), thermal conductivity is ~3.5 kW m-1 K-1, which is ridiculous. It is more than that of diamond (2.2 kW m-1 K-1), the best thermal conductor of all materials. In rare cases when there is a strong thermal inversion, radiative heat transfer may be somewhat larger, but still rather small compared to other fluxes (and its sign is just the opposite). If Trenberth's figures on surface radiation and back radiation are correct, physics tells us the global atmospheric window is some 50% larger than he claims.
  21. Berényi - You should, then, be aware that in English "pulled out of thin air" has extremely negative connotations with regard to numbers, namely "manufactured, made up, baseless". If you were not aware of the ramifications of that phrase, that's one thing. If you were intending it with the connotations attached, it's an accusation of data manufacture. Which is it?
  22. #145 - BP "It is a well known fact thermal conductivity of gases is extremely low." That is something of a cherry-pick, since it ignores the well-known effects of gases in motion. It is a well known fact that thermal conductivity of gases is extremely low, which is why gases make good thermal insulators if the possibility of convection is restricted, as in foams, wool fabrics, compressed straw, etc. It is a well known fact that thermal transfer rate of gases is extremely high if the refresh rate of air flowing over a surface is high, which is why CPUs, air-cooled engines, radiators of water-cooled engines etc. work so well at transferring heat. Fortunately, just like engineers, climate scientists know about convection and allow for it in their models.
  23. Berényi - Also note that in sea level pressure, in the saturated CO2 bands, absorption distance is ~10 meters, not zero, and this distance increases with altitude and reduced CO2 concentration. For unsaturated wavelengths this absorption distance is much further. Given that, I don't believe a simplistic thermal conductivity measure can incorporate radiative effects. Seriously, BP - you're obviously very intelligent. But a lot of very intelligent people have been working in this field for >100 years... if you think you have (once again - I recall about a dozen of these, in UHI, OHC, etc., that did not pan out) found an issue that all the bright people have missed, you might be correct. But it's far more likely that you've missed something.
  24. Sphaerica (RE: 137) "First, you can't just assume that because 1/3 of the sky is clear then that the clear sky absorbs 1/3 of the radiation." I'm not claiming the clear sky absorbs 1/3rd of the radiation. I'm saying that 1/3rd of the average surface radiation is emitted to the clear sky. This amount represents the theoretical maximum that can be emitted to space from the clear sky atmosphere, which is less than 169 W/m^2 emitted by the atmosphere depicted by the Trenberth diagram. "The ability to absorb long wave radiation is dramatically different between clear sky and clouds (clouds probably absorb substantially more, being made up of a powerful greenhouse gas, but I've never really seen any numbers on this)." I'm well aware of this. I don't see how this contradicts anything I've said. Using Trenberth's numbers, the cloudy sky absorbs 89% of the LW surface radiation emitted to it. The clear sky only absorbs 69% of the surface radiation emitted to it. "Clouds and the radiative properties of the surface are also not evenly distributed over the globe, either in space or in time. Everything else is not homogeneous." I never claimed it was. Relative to the energy balance, the averages (cloudy vs. clear sky) are what matter. "Second, you cannot ignore the non-radiative components (thermals and the release of latent heat)." I haven't. I'm well aware of them. "Third, and most importantly, you cannot ignore a major element which is not included in the diagram, which is the transfer of heat between "clear sky" and clouds. What happens when a cloud dissipates? Does the heat vanish? Is it forced to instantly radiate up to space? Does it fall to the ground with the rain?" No heat vanishes. It's either is radiated out to space, radiated down to the surface or returned to the surface in kinetic form mainly via precipitation. "Hint: When a cloud absorbs LW radiation, it is capable of transferring that heat to the surrounding and pervading atmosphere (remember, a cloud isn't a solid object, it coexists in space with the O2/N2 of the atmosphere). So it doesn't really matter which absorbs the radiation." What's your point? That the clear sky absorbs LW too? "The atmosphere (consisting of "clear sky" and clouds) absorbs the radiation, and the two cannot be separated into distinct components re this diagram." The average clear vs. cloudiness comes from the ISCCP data - not the Trenberth diagram. If, as you claim, the diagram is not depicting a 40 W/m^2 "window" through the clear sky and a 30 W/m^2 "window" through the cloudy sky with a total of 169 emitted by whole atmosphere, show me the power in = power calculations that demonstrate it. I have done so. "This diagram is not a GCM. It's just a diagram intended to help communicate the earth's energy budget to the casual viewer, and nothing more. You cannot read as much into it as you are attempting." I never claimed the diagram is a GCM. It's an energy budget diagram. With the exception of the ISCCP data on clouds, everything it taken directly from the diagram.
  25. 149, RW1,
    This amount represents the theoretical maximum that can be emitted to space from the clear sky atmosphere, which is less than 169 W/m^2 emitted by the atmosphere depicted by the Trenberth diagram.
    Wrong. You are discounting energy from other sources (such as thermals, latent heat, energy absorbed directly from the sun, and energy transferred from clouds to the "clear sky," as you call it). The input into the "clear sky" is 78 from the sun, 17 from thermals, 80 from latent heat, an unknown fraction of 396 from the surface, and an unknown amount transferred from clouds. You cannot separate the clouds from the clear sky with that diagram. You can't figure out how much energy the "clear sky" has to emit. You can't do it, except in the single, explicit case in the diagram where outgoing LWR is separated between clouds and "clear sky." You cannot back yourself into the numbers you'd like to see. You can't do it. You can't do it. (And even if you could, it has no bearing whatsoever on the topic of the post, i.e. whether the CO2 effect is saturated.)

Prev  1  2  3  4  5  6  7  8  9  10  11  12  13  14  15  16  17  18  19  20  Next

Post a Comment

Political, off-topic or ad hominem comments will be deleted. Comments Policy...

You need to be logged in to post a comment. Login via the left margin or if you're new, register here.

Link to this page


The Consensus Project Website

THE ESCALATOR

(free to republish)


© Copyright 2024 John Cook
Home | Translations | About Us | Privacy | Contact Us