


 Arguments


David Archibald Exaggerates the Solar Influence on Future Climate Change
Posted on 29 January 2012 by dana1981
 David Archibald is a climate "skeptic" who has been CEO of multiple oil and mineral exploration companies operating in Australia, and currently is part of the scientific advisory panel for the Australian Climate Science Coalition (ACSC) - a group of Australian fake skeptics which also includes Bob Carter, John McLean, David Evans, and Ian Plimer. Archibald is a major proponent of the "it's the sun" myth, and from time to time will publish a paper in Energy&Environment (the controversial journal which publishes "skeptic" research which is too erroneous to meet the standards in standard peer-reviewed journals), claiming that a decline in solar activity will lead to substantial cooling over the next few decades.
In this post we'll examine one such paper, Archibald (2009), in which Archibald claims that certain regions of the planet will cool 2.2°C over solar cycle 24, which began in December 2008, and is expected to be a relatively weak cycle (Figure 1).
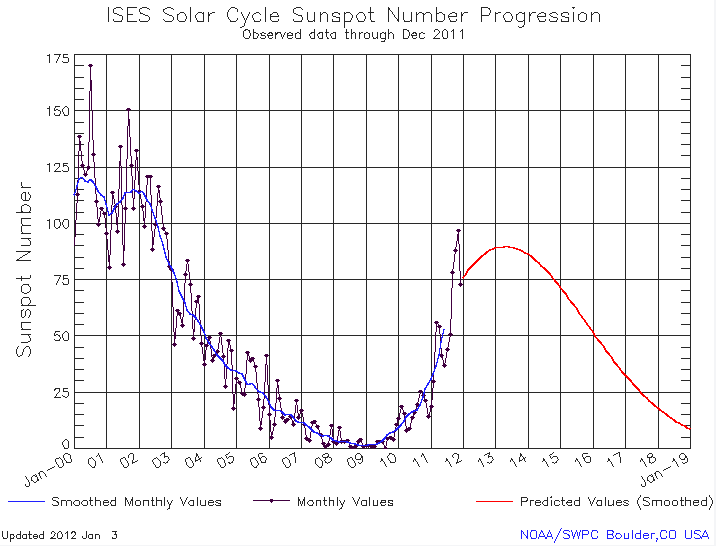
Figure 1: Smoothed monthly sunspot number over the second half of solar cycle 23 and beginning of cycle 24 (blue) and the predicted values over the rest of cycle 24 (red) (NOAA).
However, as fellow ACSC member John McLean did with the influence of La Niña, David Archibald has grossly overestimated the solar influence on global temperature.
The Claim
As we at SkS have previously noted, Archibald has a history of focusing on data from individual surface temperature stations such as Perth, Australia or Bridgeport, Washington. In his 2009 paper, Archibald similarly focused on temperature data from a single temperature station in Hanover, New Hampshire:
"If the month of minimum for the Solar Cycle 23 to 24 transition is July 2009, this would make Solar Cycle 23 over thirteen years long. This in turn would mean that it would be 3.2 years longer than Solar Cycle 22, and imply that the annual average temperature of Hanover, New Hampshire will be 2.2° C cooler during Solar Cycle 24 than it had been on average over Solar Cycle 23."
In this quote, Archibald repeats the myth that solar cycle length determines global temperatures - a quite unphysical argument which is based on correlation rather than causation - and specifically focuses on the temperature data from a single station.
Hanover, New Hampshire
The temperature data for Hanover are available via NASA GISS. The average temperature in Hanover over solar cycle 23, which began in May 1996 and ended in December 2008, was 7.9°C. Thus if Archibald is correct, over solar cycle 24, the temperature in Hanover should cool to 5.7°C. In fact, Archibald's prediction is based on the average temperature over the entire solar cycle, so his prediction is actually that the average temperature in Hanover from approximately 2009 through 2020 will be 5.7°C.
Thus far we are more than a quarter of the way into cycle 24, and Archibald's prediction is not looking good (Figure 2). And remember that we're currently headed upwards toward the solar cycle maximum (expected in 2013 or 2014), so any dramatic solar-caused cooling will have to happen in the second half of the solar cycle.
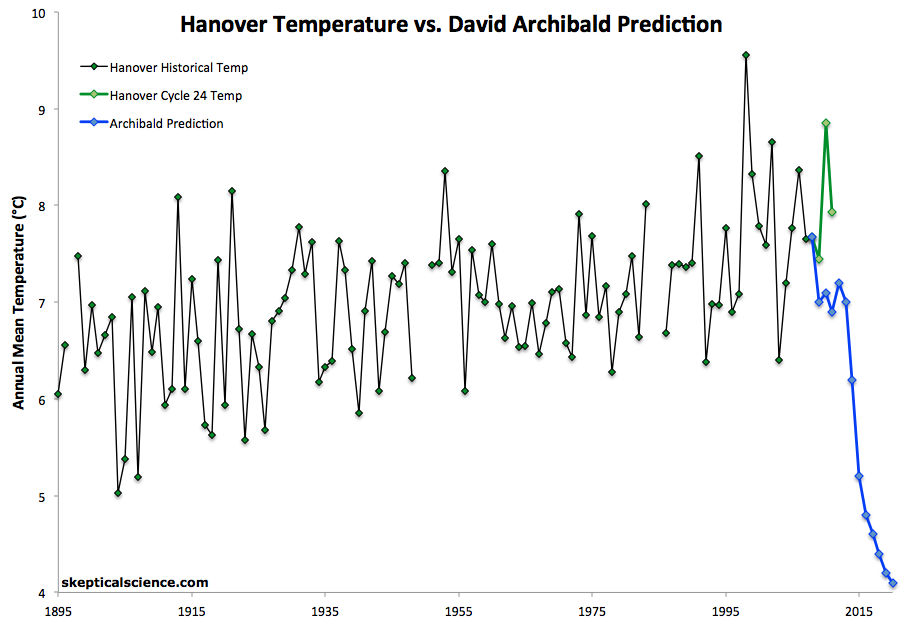
Figure 2: GISS temperature record for Hanover, New Hampshire (1895 through 2008, black), GISS Hanover data for solar cycle 24 (2009 through 2011, green), and an example of how Hanover temperatures would have to change for Archibald's prediction to be accurate (blue).
As with John McLean's failed temperature prediction, a simple cursory glance at the data is all that's necessary to conclude that Archibald's prediction has no basis in reality. However, we haven't yet seen the worst of Archibald's predictions.
Mid-Latitude Temperatures
In the abstract of his paper, Archibald extends the claim much further yet:
"As at late 2008, the progression of the current 23/24 solar minimum indicates that a severe cool period is now inevitable, similar to that of the Dalton Minimum. A decline in average annual temperature of 2.2° C is here predicted for the mid-latitude regions over Solar Cycle 24."
"Mid-latitude regions" refers to the area betwen latitudes of approximately 24° and 64° in both the northern and southern hemispheres, which accounts for nearly half of the Earth's surface. Such a large area exhibits much less temperature variability, on average, than a single station like Hanover, New Hampshire. Thus Archibald's prediction in this case becomes even worse yet (Figure 3).
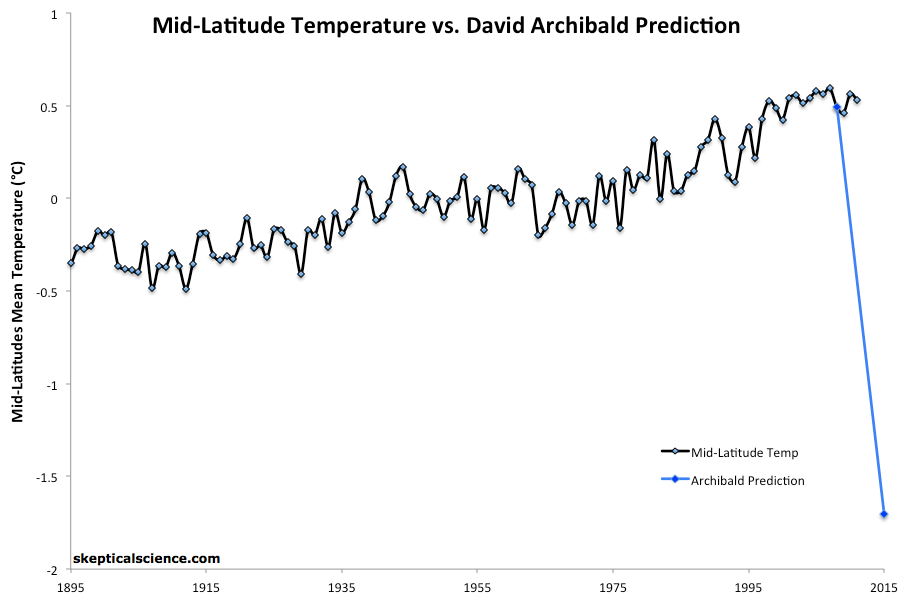
Figure 3: Mid-latitude (24 to 64°S and 24 to 64°N) GISS land-ocean temperature (black) vs. Archibald's prediction (blue).
The middle latitudes warmed approximately 0.77°C over the past 115 years, and Archibald has predicted that they will cool 2.2°C over the next 10 years. This prediction clearly has no basis in reality.
Manufacturing Controversy
A prediction of 2.2°C cooling for Hanover, New Hampshire may be unrealistic, but it also is of little consequence. However, 2.2°C cooling for nearly half the planet, or even the entire planet, would be quite noteworthy, to say the least. Towards the end of the paper, Archibald fuels speculation about such a possibility:
"Based on our understanding of the interaction of solar and terrestrial processes, the following projections are made for a number of climate-related physical processes:"
[...]
"Temperature Decline Solar Cycle 24: 2.2° C"
In this case, Archibald does not specify the geographic region to which his prediction applies, and it can easily be construed (or misconstrued) as referring to the planet as a whole. In fact, when the prediction inevitably fails, Archibald will undoubtedly claim that his assertion of 2.2°C cooling for "mid-latitude regions" was only intended to apply to very isolated regions like Hanover, New Hampshire.
However, imprecise assertions like "mid-latitude regions" and the unspecified "Temperature Decline" will allow fake skeptics to add David Archibald to the list of "scientists" who are "predicting global cooling," even though his research does not support this claim. In fact, 2.2°C is nearly half the average global temperature change during the transition between glacial and interglacial periods. If Archibald were predicting such a massive temperature change over a period on the order of a decade, he would deserve to be laughed out of the room.
Realistic Solar Influence
In reality, solar activity is generally quite stable. On a global scale, the sun has only contributed to less than 40% (0.3°C) of the observed global warming over the past century, and less than 15% (0.1°C) over the past 50 years, according to peer-reviewed global warming attribution research (Figure 4).
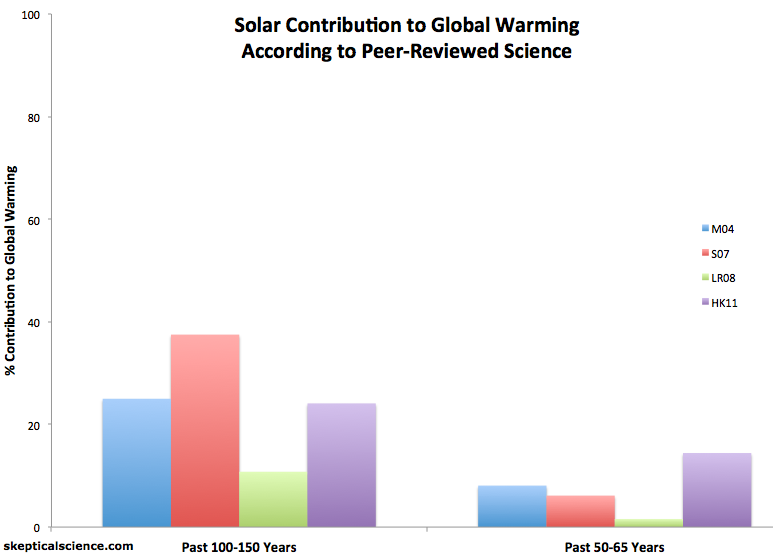
Figure 4: Solar contribution to global warming according to Meehl et al. 2004 (M04, blue), Stone et al. 2007 (S07, red), Lean and Rind 2008 (LR08, green), and Huber and Knutti 2011 (HK11, purple).
According to Fuelner and Rahmstorf (2010), even a grand solar minimum would cause no more than a 0.3°C cooling of average global surface temperatures. A recent study by Jones et al. (2012) concluded that similar to Archibald's assumption, solar activity will fall to levels similar to the Dalton Minimum during the 21st century, but unlike Archibald, found that this would only result in a minimal cooling effect of approximately 0.08°C on the average global surface temperature.
"...the likely reduction in the warming by 2100 is found to be between 0.06 and 0.1K, a very small fraction of the projected anthropogenic warming."
Bear in mind that according to various solar reconstructions (summarized in Jones et al. 2012), total solar irradiance (TSI) today is only between 1 and 2.5 Watts per square meter (W/m2) higher than during the Maunder Minimum, which was the period with the lowest solar activity in the past several centuries. The change since the Dalton Minimum is even smaller. The solar radiative forcing is estimated by multiplying the change in TSI by 0.25 and 0.7, to account for the sphericity and albdeo (reflectivity) of the Earth.
Thus a change in TSI from today's levels to Maunder Minimum levels would only cause a radiative forcing of 0.17 to 0.44 W/m2. This is the equivalent forcing to an increase of atmospheric CO2 from today's level of 390 parts per million (ppm) to between and 400 and 420 ppm - between 5 and 15 years of CO2 emissions at today's rates. A Dalton Minimum would correspond to just a few years of human CO2 emissions, and at most a couple tenths of a degree cooling of the average global surface temperature - a factor of 10 less than Archibald's claimed 2.2°C.
In short, Archibald has either dramatically overestimated the solar influence on global temperatures, or has worded his paper so poorly that his discussion of Hanover, New Hampshire temperatures can be misconstrued as referring to mid-latitude or global average temperatures. This sort of shoddy work is undoubtedly why Archibald was forced to settle for publication in Energy&Environment. The sun is simply not going to save us from the rapid global warming we have in store on our current emissions path.


[DB] Actually, that was Mauna Loa. Global is here (December not yet finalized): http://www.esrl.noaa.gov/gmd/ccgg/trends/global.html#global