Climate Science Glossary

Term Lookup

Enter a term in the search box to find its definition.

Settings

Use the controls in the far right panel to increase or decrease the number of terms automatically displayed (or to completely turn that feature off).

Term Lookup

Settings


All IPCC definitions taken from Climate Change 2007: The Physical Science Basis. Working Group I Contribution to the Fourth Assessment Report of the Intergovernmental Panel on Climate Change, Annex I, Glossary, pp. 941-954. Cambridge University Press.

Home Arguments Software Resources Comments The Consensus Project Translations About Support

Twitter Facebook YouTube Mastodon MeWe

RSS Posts RSS Comments Email Subscribe


Climate's changed before
It's the sun
It's not bad
There is no consensus
It's cooling
Models are unreliable
Temp record is unreliable
Animals and plants can adapt
It hasn't warmed since 1998
Antarctica is gaining ice
View All Arguments...


Username
Password
New? Register here
Forgot your password?

Latest Posts

Archives

Global Surface Temperature: Going Down the Up Escalator, Part 1

Posted on 5 November 2011 by dana1981

One of the most common misunderstandings amongst climate "skeptics" is the difference between short-term noise and long-term signal.  In fact, "it hasn't warmed since 1998" is ninth on the list of most-used climate myths, and "it's cooling" is fifth.

This myth stems from a lack of understanding of exactly what global warming is.  The term refers to the long-term warming of the global climate, usually measured over a timescale of about 30 years, as defined by the World Meteorological Organization.  This is because global warming is caused by a global energy imbalance - something causing the Earth to retain more heat, such as an increase in solar radiation reaching the surface, or an increased greenhouse effect.

There are also a number of effects which can have a large impact on short-term temperatures, such as oceanic cycles like the El Niño Southern Oscillation or the 11-year solar cycle.  Sometimes these dampen global warming, and sometimes they amplify it.  However, they're called "oscillations" and "cycles" for a reason - they alternate between positive and negative states and don't have long-term effects on the Earth's temperature.

Right now we're in the  midst of a period where most short-term effects are acting in the cooling direction, dampening global warming.  Many climate "skeptics" are trying to capitalize on this dampening, trying to argue that this time global warming has stopped, even though it didn't stop after the global warming "pauses" in 1973 to 1980, 1980 to 1988, 1988 to 1995, 1995 to 2001, or 1998 to 2005 (Figure 1).

skeptics v realists v3

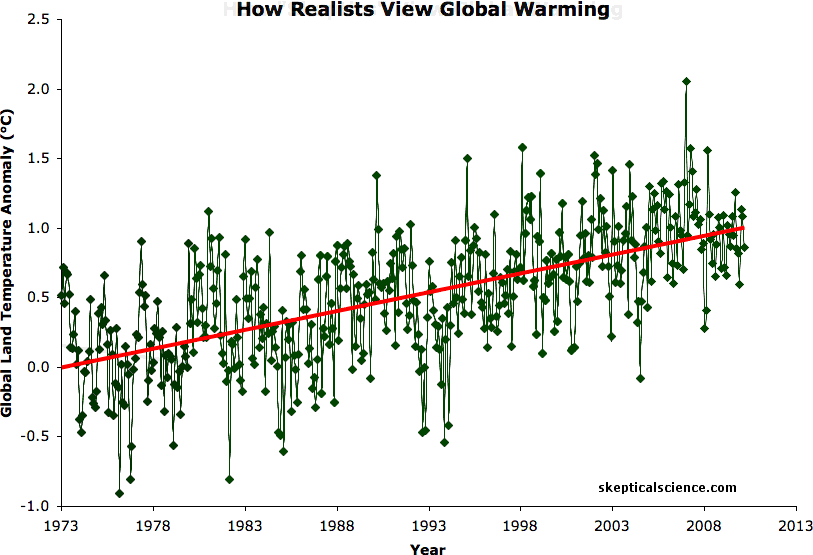
Figure 1: BEST land-only surface temperature data (green) with linear trends applied to the timeframes 1973 to 1980, 1980 to 1988, 1988 to 1995, 1995 to 2001, 1998 to 2005, 2002 to 2010 (blue), and 1973 to 2010 (red).  Hat-tip to Skeptical Science contributor Sphaerica for identifying all of these "cooling trends."

As Figure 1 shows, over the last 37 years one can identify overlapping short windows of time when climate "skeptics" could have argued (and often did, i.e. here and here and here) that global warming had stopped.  And yet over the entire period question containing these six cooling trends, the underlying trend is one of rapid global warming (0.27°C per decade, according to the new Berkeley Earth Surface Temperature [BEST] dataset).  And while the global warming trend spans many decades, the longest cooling trend over this period is 10 years, which proves that each was caused by short-term noise dampening the long-term trend. 

In short, those arguing that global warming has stopped are missing the forest for the trees, focusing on short-term noise while ignoring the long-term global warming signal.  Since the release of the BEST data which confirmed the global warming observed by all other global temperature measurements, climate "skeptics" have been scrambling for a way to continue denying that global warming is a problem, and focusing on the short-term noise has become their preferred go-to excuse.

The Noisy Group

Unfortunately, those making a lot of noise about the noise (and sweeping generalizations that global warming has magically stopped) include several "skeptic" and/or "lukewarmer" climate scientists, who really should know better.  One of these, Judith Curry, is actually a member of the BEST team whose data has been used by climate "skeptics" as "proof" that global warming has stopped.  Unfortunately, Dr. Curry herself fed these myths in a rather dismaying interview:

"There is no scientific basis for saying that warming hasn’t stopped...To say that there is detracts from the credibility of the data, which is very unfortunate...This is “hide the decline” stuff. Our data show the pause, just as the other sets of data do. Muller is hiding the decline"

Predictably, Dr. Curry's comments have been disseminated far and wide by climate "skeptics" who desperately want this myth to be true.

Dr. Roger Pielke Sr. has made similar claims in the comments on Skeptical Science:

"Since 2002, as shown in the lower tropospheric plot and in the upper ocean data, little of that heat has accumulated there. There is not enough melt of sea ice or glaciers to account for it there. "Global warming" has nearly stopped using these two metrics"

Dr. Roy Spencer has taken this argument to the extreme, claiming that based on one cool month in his University of Alabama at Huntsville (UAH) tropospheric temperature dataset, "the troposphere is ignoring your SUV" and that (perhaps sarcastically):

"While any single month’s drop in global temperatures cannot be blamed on climate change, it is still the kind of behavior we expect to see more often in a cooling world"

These climate scientists really should know the difference between short-term noise and long-term signal, and it's a travesty that they're misinforming the public, the media, and policymakers by conflating the two concepts.

The Signal Comes Through Loud and Clear

On the other hand, other scientists who understand statistics are doing an excellent job explaining the difference between signal and noise.  For example, when asked if BEST showed that global warming had stalled over the last decade in response to the interview with Dr. Curry, Dr. Richard Muller (the BEST team lead) said:

“That’s incorrect...I mean, what they have done is an old trick. It’s how to lie with statistics, right? And scientists can’t do that because 10 years from now, they’ll look back on my publications and say, ‘Was he right?’ But a journalist can lie with statistics. They can choose a little piece of the data and prove what they want, carefully cutting out the end. If I wanted to do this, I could demonstrate, for example, with the same data set that from 1980 to 1995 that it’s equally flat. You can find little realms where it’s equally flat. What that tells me is that 15 years is not enough to be able to tell whether it’s warming or not. And so when they take 13 years, and they say based on that they can reach a conclusion based on our data set, I think they’re playing that same game and the fact that we can find that back in 1980, the same effect, when we know it [was] warming simply shows that that method doesn’t work. But no scientist could do that because he’d be discredited for lying with statistics. Newspapers can do that because 10 years from now, nobody will remember that they showed that.”

What the Science Says

The peer-reviewed scientific literature confirms Muller's comments.  For example, Santer et al. (2011):

"Because of the pronounced effect of interannual noise on decadal trends, a multi-model ensemble of anthropogenically-forced simulations displays many 10-year periods with little warming.  A single decade of observational TLT data is therefore inadequate for identifying a slowly evolving anthropogenic warming signal.  Our results show that temperature records of at least 17 years in length are required for identifying human effects on global-mean tropospheric temperature."

and Easterling and Wehner (2009):

"Numerous websites, blogs and articles in the media have claimed that the climate is no longer warming, and is now cooling....We show that the climate over the 21st century can and likely will produce periods of a decade or two where the globally averaged surface air temperature shows no trend or even slight cooling in the presence of longer?term warming."

Not only are these short-term "pauses" just noise in the data, but observations show that they are entirley expected, and predicted by climate models (i.e. see Meehl el al. 2011).

Other Physical Evidence of Continued Warming

It's also important to point out that global temperature measurements aren't our only evidence of the long-term global warming trend.  We've observed many physical indicators of global warming (Figure 2).

warming indicators


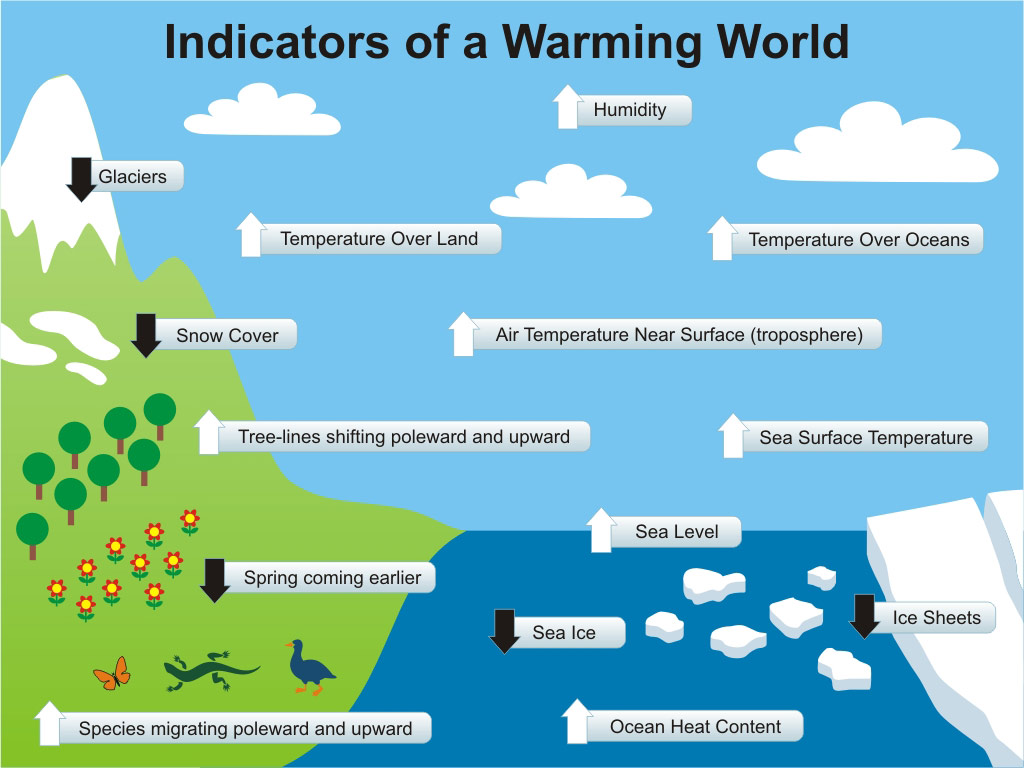
Figure 2: Physical Indicators of a Warming World

When is Warming Cooling?

When constantly confronted with this myth that global warming stopped in 1998, or 2000, or 2002, or 2005, or [insert year], we wonder why distinguishing between short-term noise and long-term signal is such a difficult concept for climate "skeptics."  They remind us of the Penrose stairs made famous by M.C. Escher - a staircase which people can descend forever and not get any lower.  This paradoxical perception of an impossible construction seems to be how climate "skeptics" view the world, which is undoubtedly why they're willing to risk our future on the hopes that 97% of climate scientists are wrong about climate science.

escher stairs

Part 2 of this post examines the "skeptic" explanation of how these cooling periods can add up to a net warming, and why that explanation is physically incorrect.

Note: this post has been incorporated into the rebuttals to "global warming stopped in [insert year]", and Figure 1 has been added to the SkS Climate Graphics Page

0 0

Printable Version  |  Link to this page

Comments

1  2  3  Next

Comments 1 to 50 out of 144:

  1. Figure 1 is a great graph that speaks for itself. It hasn't warmed since... the last recent temp record.
    0 0
  2. Thanks Alexandre, the point of this post was really to highlight that Figure 1. I should note that we had to include the last two BEST incomplete months (April and May 2010) in the "skeptic" version in order to get a cooling trend (without them all recent trends are positive), but we removed the incomplete points in the "realist" version, since realists would not use incomplete data. Otherwise the data in the "skeptic" and "realist" versions are identical. Hat-tip to Sphaerica again for coming up with the idea. All I did was animate it a bit.
    0 0
  3. I can just hear the deniers discussing Fig. 1.”If the global temperature has gone down over so many periods in the last 40 years, how can it be warming? Those warmists have cooked the data again.”
    0 0
  4. kmpollard @3, "Those warmists have cooked the data again." The irony is that it is they (the "skeptics" and those who deny AGW) who are cooking the data.
    0 0
  5. Figure 1, is an excellent representation of how the deniers look at the temp record. Having recently shown this graph to a few, they are always lost for words....... Excellent article.
    0 0
  6. In fig 1, the denialist's view, you can almost see the slope of the temporary cooling trends becoming more positive each decadal cycle. I'm not sure if I'm actually seeing that, or if that's some sort of optical illusion. Regardless, it's obvious that the start and end points are always higher than the previous decade. I don't see how deniers can continue fooling themselves.
    0 0
  7. 6, WSteven, Two notes. First, there are no actual temporary cooling trends. You see them only because of a careful selection of endpoints. It's actually a whole lot easier to get a graph with a series of warming trends (almost any choice of end points will give them to you): Second, the gradual flattening of the downward trends is not an optical illusion, but I'm not sure that it's anything more than coincidence, either.
    0 0
  8. Really excellent, figure 1 will save me a lot of time. Is 0.27/decade comparable to other datasets, or I guess warmer as land only? Thanks!
    0 0
  9. 7. @Sphaerica. "here are no actual temporary cooling trends" Yeah, I knew that. Sorry, poor choice of words on my part.
    0 0
  10. Utahn @8 - thanks. We've got another post in the works comparing the various data sets. Short answer - BEST is comparable with NOAA and GISS land-only. Almost identical long-term warming trends, in fact. HadCRUT is biased lower, but that's not news. The satellite analysis is where it gets interesting, but I don't want to spoil the post.
    0 0
  11. @ Sphaerica "there are no actual temporary cooling trends" That's a great Obi-Wan channeling act you've got going there. ;)
    0 0
  12. Thanks Dana, I'll look forward to it, you tease!
    0 0
  13. *these are not the trends you are looking for* Utahn - no worries, the post is coming soon! Probably Monday at the latest, maybe even tomorrow.
    0 0
  14. @ WSteven: I don't see how deniers can continue fooling themselves. They don't have to fool themselves, just the rest of us. For their purposes, it suffices for their arguments to be noisy, not coherent.
    0 0
  15. I would recommend that you go back a bit further in time with the graph, say approx 200 years? Gets quite interesting.
    0 0
  16. Camburn @15, at no point on the graph does a short term trend (ie, less than 13 years) become a reliable indicator of future trends. At all points on the graph, medium term trends (20 - 40 years) are reasonably reliable indicators of future trends, although they fail at certain well known inflection points. Most importantly, at all points in the graph, the best predictor of future trends has been Global Circulation Models incorporating known forcings including (most importantly) anthropogenic forcings. Which just goes to show, physics is a better predictor than statistics, which is a better predictor than statistics done badly. And (as though you didn't already know), at the moment both physics and statistics done well both predict an ongoing upward trend. As a result, agw deniers just can't keep their focus of statistics done badly.
    0 0
  17. Global warming is like slowly puting on more clothes on a hot day, you will get hotter and hotter. But if the sun goes behind a cloud you will get cooler for a short period.
    0 0
  18. 15, Camburn, If you have an intelligent, defensible point to make then make it. Vague, indecipherable implications of doubt and distrust are worth nothing (unless your goal is simply to confuse and befuddle people).
    0 0
  19. Sphaerica @18: Ok......look at the rate of rise in the following graphs: wood for trees comparison of two time periods
    0 0
    Response: [JC] This argument is examined in What caused early 20th Century warming? Note: we went to the trouble of writing three levels of rebuttals (the advanced version by Dana is particularly high value) so I recommend reading those pages.
  20. Sphaerica@18: My point is, one would expect the rise after 1970 as we were in the midst of a Grand Solar Maximum. The rise of the early 20th century has had various reasons for it, but none really stand out as correct or wrong. My point is that the warming presently is not dramatic. If the cooling, slowing, or lack of warming, whatever you want to call it for the past 10 years continues for another 4 years, it is worth looking at in a very serious fashion. Tom@16: (-Snip-)
    0 0
    Response:

    [DB] Moderation complaints snipped.  You are being egregiously off-topic.

    Please note that posting comments here at SkS is a privilege, not a right.  This privilege can and will be rescinded if the posting individual continues to treat adherence to the Comments Policy as optional, rather than the mandatory condition of participating in this online forum.

    Moderating this site is a tiresome chore, particularly when commentators repeatedly submit  off-topic posts. We really appreciate people's cooperation in abiding by the Comments Policy, which is largely responsible for the quality of this site.
     
    Finally, please understand that moderation policies are not open for discussion.  If you find yourself incapable of abiding by these common set of rules that everyone else observes, then a change of venues is in the offing.

    Please take the time to review the policy and ensure future comments are in full compliance with it.  Thanks for your understanding and compliance in this matter.

  21. 19, Camburn, First, here's your skeptic game played with 1800 to 1900: And here it is with 1900 to 1975: This is fun. Can we play some more? And here's your graph from woodfortrees.org: And here is yours using the BEST data instead of HADCRUT (which is known to be low among all data sets for modern warming because it does not provide any coverage of the area of the globe with the greatest anomalies, the poles): I am assuming that the point that you are too shy to make is that warming from 1917-1943 was equivalent to modern warming, so it must all be natural. You ignore the fact that the first spate of warming lasted only 20 years, while the current warming has lasted more than 30 and is continuing. You ignore the fact that the warming from 1917-1943 did not push temperatures above levels not seen in thousands of years, with a threat to push them above levels not seen in hundreds of thousands of years. You cherry pick start and end dates for both of your series. You cherry pick the data source. You cherry pick the duration. Oh, wait! I'm sorry. I didn't realize. You really had me going there. Thank you! Thank you! Your point was clearly to demonstrate the main topic of this post -- that deniers play games with graphs to trick people. Well done, Camburn. You totally Poe'd me. Totally.
    0 0
  22. 20, Camburn,
    ...it also must be noted at least, as it could be a short term trend change...
    You didn't really say that, did you? Did you even read the post above? Or did your fingers simply snap into denial mode by instinct?
    0 0
  23. Spaerica: No, I am not trying to "play tricks". I don't know how to upload pictures or I would. Note the long term warming for the past 200 years or so. Note the warming from even longer, 1910-1945. Over 30 years so this is suppose to be important....right? (-Snip-) Actually, you have proved my point. During the past 200 years there have been short term period of warming, short term periods of cooling. The general trend has been one of warming, as the warming trends overcame the cooling periods. So, show us a graph of the past 200 years? As far as HadCrut3. It used to be the established metric. I still have problems with GissTemp as the extrapolation does not match DMI observations. (-Snip-)
    0 0
    Response:

    [DB] "I still have problems with GissTemp as the extrapolation does not match DMI observations."

    Note that DMI is a product synthesized from models and augmented by some observational data; it is not an observational product, nor is it a global product.  Thus your point is seriously in error.

    Multiple off-topic bits snipped.  Please see the earlier Warning to you.

  24. The question still remains, how much is caused by co2,ch4 etc and how much is the result of normal forces. Of course - it's not like climatologists have been studying these kinds of things in an effort to quantify the contributions of solar forcings, greenhouse gas forcings, aerosols, water vapour feedbacks, cloud feedbacks, and so on. ... Oh, wait. They have been.
    0 0
  25. And any further comment regarding forcings should be on the thread linked by myself or related threads.
    0 0
  26. 23, Camburn,
    I am not trying to "play tricks".
    laughs
    Note the long term warming for the past 200 years or so.
    So what? I've been aging myself for 50. If I get hit by a car and die, will you tell everyone I died of old age, as evidenced by the fact that I'd been aging steadily for 50 years? Use some sense.
    Actually, you have proved my point.
    No, actually, you proved mine.
    So, show us a graph of the past 200 years?
    I did. You need to see it all at once? To prove what? That global climate recovered from the Little Ice Age before rocketing into temperatures not seen in thousands of years, which are a result of an unnatural forcing with a source and pace never seen on this planet in it's entire history?
    Or is all of a sudden HadCrut3 not a realiable metric anymore?
    No, it's just a perfect example of a cherry pick on your part, and I thank you for it. It makes it clear to any truly skeptical reader exactly what sort of games deniers play to sow doubt.
    0 0
  27. Spaerica: IF HadCrut3 is a reliable metric, then how in the world am I cherry picking? This sort of arguement baffles me. HadCrut3 has the most documentation for a long based temp metric. When you are going back to the 1800's, it was the first to established the temps. This is getting to the point of being silly. We have a long term warming trend.....agree? The recent warming trend is NOT a dramatic one in comparison to previous, within 200 years.......agree?
    0 0
  28. Camburn: "As far as HadCrut3. It used to be the established metric. ". Are you saying there was a trend before 1900? I don't see much there, but maybe I messed up here? Trends 1800-1900, 1900-2000
    0 0
  29. Camburn: a) "dramatic" is a wholly subjective term. b) The recent warming trend is still going and will only accelerate unless we get GHG emissions under control. Arguing that it's not "dramatic" yet is rather pointless. Who cares if it's "dramatic" as compared to other recent warming periods? Let's please discuss some science as opposed to subjective rhetoric.
    0 0
  30. Camburn @20 If the cooling, slowing, or lack of warming [...] for the past 10 years continues for another 4 years, it is worth looking at in a very serious fashion You have just shown not only the ignorance of the statistical nature of the processes we are talking about; but also the disregard to the content of dana's article. Dana cited the work which has proved that at least 17y of data is required for any statistical significance: Santer et al. (2011) Your period of 14 years, that you want to cherry-pick in some 4 years, will be insignifficant. If I was you and trying to be as skeptic as you, I would say, that we need to wait for some more: 7 years. Or I would say "perhaps we can find out with usual 95% confidence, that 2000+ trend is different than previous century trend, using given statistical test" if I wanted to challenge Santer et al. (2011) findings.
    0 0
  31. Hypotheticals like that are pretty useless anyway. If in 4 years there are leprechauns and unicorns in my backyard, that is worth looking at in very serious fashion too. Meanwhile, there actually is a continuing global warming trend for the past 40+ years. When are we going to start taking that seriously?
    0 0
  32. Camburn:
    I don't know how to upload pictures or I would.
    Personally, I'd expect any erstwhile "Galileo" to be capable of learning something as simple of this, given that their presumption is that they're overturning a wide swath of modern science ... (-Snip-)
    0 0
    Response:

    [DB] Inflammatory snipped.

  33. Camburn @23, yes, you are playing tricks. The first obvious trick you are playing is the appeal to uncertain data to undermine the impact of well known data. The following graph shows the upper and lower bounds of the 95% confidence interval of BEST data, along with trends: Although these show the trends of the confidence interval rather than the confidence interval of the trend, it is clear that data prior to 1880 is insufficiently exact to distinguish with confidence between zero trend over the course of the 19th century, and a moderate trend (0.14 degrees C per decade), although substantially less than that of the last 40 years. When the denier habit of using short trends which lack statistical significance (because they are short) is shown for the smoke and mirrors it is, you appeal to long trends which still lack statistical significane because of the uncertainty of the data. It's the same trick, it just had not yet been exposed. I should note that any long term trend in the 19th century is almost certainly not due to the mythical "recovery from the little ice age", but entirely due to some exceptionally cold years at the start of the 19th century due to the Dalton Minimum and the eruption of Mount Tambora. Indeed, examination of the BEST 20 year average data shows the late 18th century to have been about as warm as the 1850's (with very low confidence). Your second trick is asserting straight out falsehoods such as "[the] GissTemp as the extrapolation does not match DMI observations". Really?
    0 0
  34. The current warming, in both hemispheres, is unique in the last 20,000 years, see: Björck(2011). So yeah, I'd call that really dramatic.
    0 0
  35. Camburn: What makes you think that the climate changes 200 years ago were natural and not anthropogenic? See this Realclimate post that describes the growing recognition that the Earth was cooling 5000 years ago and AGW started then due to land use changes by ancient farmers. It appears that ancient farmers had dramatic effects on climate. The little ice age deniers crow about may be just due to changes in anthropogenic forcings at that time. Please provide links to data that supports your claim that climate changes in the past 200 years were natural and not human caused.
    0 0
  36. Simple decision analysis: 1. What was the temperature 100 years ago? 2. What is it today? 3. If higher, then we may need to do something, if not then don't. 4. Does it look like it is cooling today? 5. If yes then jump to 6 otherwise continue with low carbon policies. 6. Has it 'cooled' for short periods (a few years) in the past 100 years? 7. In the case of 6 being yes, then the only way of being sure of a long term period of cooling is to wait for a number of decades and see what happens. If test 3 shows warming over hundred years then the probability is high that current cooling is short term and the burden of proof is on skeptics to show it is long term. Which requires a long wait and eliminates that as an input to policy decisions today. So we continue with low carbon policies. 8. If the test at 6 is negative and the past 100 years has seen long periods (30 years or so) of cooling (we haven't seen that) then skeptics may have a point. Basically, based on risk and probabilities and the cherry picking temperature scenarios presented by many skeptics. They basically lose any policy argument based on their own analysis of temperature records. So Nigel Lawson and similar political ideologists are perverting logic and the course of decision making by presenting graphs of recent temperature records (10 years).
    0 0
  37. The article quotes Muller, "But no scientist could do that because he’d be discredited for lying with statistics." Yet, we've seen Curry, Pielke, Spencer, and many others doing this thing no scientist could do... frequently and vehemently. Pielke, at least, is still afforded some measure of respect and none of them have been widely denounced. Muller also infamously said that there were now a 'list of scientists whose research I will not read' over the fake 'Climategate' scandal. So where is the indignation and denunciation over this actual 'scientific malpractice'? I wonder if that even exists as a legal concept. Were the scientists who insisted that smoking was not harmful ever sued for it? Malpractice is a 'failure to follow accepted professional standards which results in harm'. That is an accurate description of what the denier scientists are doing with their "lying with statistics" (and what the tobacco apologists did decades ago)... but so far as I can see there are no real consequences for such behavior in the sciences. Indeed, some of these people are hailed as heroes and/or make a living off of it. Fred Singer has been doing it professionally for decades. Do scientists need to take a page from the medical and legal professions and develop standards and procedures for dealing with scientific malpractice?
    0 0
  38. Camburn, Camburn, Camburn, I'd grown tired of (-self-snip-) and gone to bed, but here are your graphs of 200 years of "continuous warming" with various trends. Readers should note that observations and coverage get increasingly sparse and unreliable the further back you go. HADCRUT (suffers from lack of coverage at the poles where current warming is known to be greatest, goes back to 1850): BEST (suffers from lack of ocean coverage, goes back to 1800): GISTEMP (suffers from Camburn not personally liking it, only goes back to 1880 because data prior to that date is considered by GISS to be too unreliable and sparse to be meaningful):
    0 0
  39. Sphaerica #38: How about transforming your excellent presentation into an article?
    0 0
  40. What would be even more telling than plotting the inexorable rise in Global temperature is, if you could plot the inexorable rise in CO2 concentration in the atmosphere on the same graph as the temperature.
    0 0
  41. FundMe#40: Enjoy the inexorable. -- source Any questions, find the appropriate thread.
    0 0
  42. fund me - something similar is coming in Part 2
    0 0
  43. Why on earth did people allow Camburn to troll and derail the thread? Please, DNFTT folks!
    0 0
  44. Sphaerica @21, What a lovely post. I was under the mistaken impression that the global mean temperature warmed between 1917 and 1943. But as you clearly show, it didn't. So let us not here again from those in denial or from "skeptics" that it warmed "rapidly" early in the early 20th century ;) In fact, going by some people's horribly misguided and false logic, it can be shown to be never be warming (or cooling). I'm beginning to doubt the existence of glacial and interglacial periods;) This would be a "Wow" moment for Dr. Judith Curry. What I love most about this Sphaerica is when those in denial try to argue that they are not in denial or when those who cherry pick try to convince others they are not cherry picking by doing just that, cherry picking. So they just keep reinforcing Dana's point-- can they really be oblivious to that fact? This has all reminded me of this fantastic song.
    0 0
  45. Possible subject of a future post: At what point back in the surface record does multiproxy analysis become more reliable in determining a global or hemispheric mean analysis? The 1800-1850 period in BEST appears to be very imprecise.
    0 0
  46. (cross posted with excisions from Tamino's blog) I’m reading Kahneman’s new book “Thinking, Fast and Slow”. (Nobel prize in economics 2002.) I think part of the cognitive problem is that we have teh ol’ eyecrometer….we’re can’t turn it off and it says “10 year pause”. Kahenman points out that it’s experimentally demonstrated that humans are terrible intuitive statisticians, especially for small samples. Those of us trained to ignore the eyecrometer don’t “see” a 10 year pause….those without the training don’t get why we don’t trust our eyes or theirs.
    0 0
  47. Hey! I was just updating some climate graphs (as I do) when a whole new aspect of skeptic cherry-picking showed itself. We know that any meaningful regression or smoothing exercise demonstrates a continual rise in global temperatures. And we know this is why skeptics have to cherry-pick the data to get any chance of it supporting their delusions. One feature of the temperature record they regularly home in on is the prominence of the 1998 ENSO-induced temperature maximum and that is all that matters – the peak global temperature 13 years ago. And with such a ripe cherry, it is logical to say that the world has been cooling ever since 1998. But this is also cherry-picking in the sense that it is only half the story. These skeptics concentrate their so-call analysis solely on the maxima within the global temperature record. The rest of it they do not even notice – I can't think why. We all call what we're doing to the climate “global warming” but it is the nature of GHGs not to warm us but to prevent us from cooling down. It should be called “global not-cooling-down” and with not-cooling-down the issue, perhaps those clever skeptics should turn their enormous analytical power on minima rather than just maxima. So is there any evidence that we are getting less cool? The answer looks a pretty convincing 'No'. Year minima value 1976 -0.29 1978 -0.07 1982 0.00 El Chich'on 1985 -0.06 1988 +0.09 Mt Pinatuba 1992 +0.05 1996 +0.13 2000 +0.26 2008 +0.29 This data (which is HadCRUT3 rolling annual average) is probably best seen graphically. The link here should allow that. HadCRUT3 & ENSO graph The only times the minima pause in their upward march is after a big volcano. Without a volcano blowing there is zero evidence of any pause in the warming, let alone the cooling so often alleged by those skeptic folk.
    0 0
    Response:

    [DB] For convenience, here's the graph linked to above:

    Click for larger image

  48. Another odd thing from Curry, from her website, which Dikran (as well as one or two others) have queried over there, is this assertion :

    A key issue in identifying and interpreting the pause is the start date chosen to evaluate a pause. If one is seeking to identify an anthropogenic signal, one should choose years at each end point that are neutral in terms of ENSO and also the 9.1 year AMO signal discussed by Muller et al. For a short temperature record (i.e. of relevance to assessing whether there has been a pause over the past decade), this isn’t feasible. In any event, identifying an AGW signal on this short timescale isn’t useful. What is of interest on this timescale is whether natural variability (forced and unforced) can dominate the AGW signal on decadal timescales and produce a ‘pause’ or a ‘stop’. This is the issue addressed by Santer et al., searching for the AGW signal amidst the natural variability noise. Santer et al. argue that “Our results show that temperature records of at least 17 years in length are required for identifying human effects on global-mean tropospheric temperature.” So in this context, starting the analysis in 1998 is not unreasonable.

    Can anyone understand how all that allows her to start her analysis "in 1998" ? Or is just another case of her own words being misinterpreted (again) - whatever she really means ?
    0 0
  49. JMurphy @48, I am going to go out on a limb here, and disagree with both Dikran Marsupial and Tamino. (That may be more akin to going out on a limb and then sawing of the branch on the trunk side;). IMO, Judith Curry is (almost) making sense in that post. The key point is that you can ask many different questions of a given data set. They may not be sensible questions, but you can still ask them. Given that, it is important that (apart from measurement error) what constitutes noise depends on the question you ask. If you ask the most obvious question, "What is the long term trend?", then small variations introduced by temporary or short term cyclical events like volcanic eruptions, ENSO and the sunspot cycle are noise. In that case, the short term data is dominated by noise, and short term trends in the data tell us very little, if anything, about the future long term change in temperature. That is the question Tamino, and Dikran are asking. Unsurprisingly (in one respect) Judith Curry agrees with them. She writes:
    "If one is seeking to identify an anthropogenic signal, one should choose years at each end point that are neutral in terms of ENSO and also the 9.1 year AMO signal discussed by Muller et al. For a short temperature record (i.e. of relevance to assessing whether there has been a pause over the past decade), this isn’t feasible. In any event, identifying an AGW signal on this short timescale isn’t useful."
    That is basically correct. You cannot identify the anthropogenic signal (ie, the long term trend) over short time scales. I think you can correctly quibble about her reasons given. Lack of statistical significance (Tamino and Dikran) is more important than finding corresponding conditions (Curry) both because finding corresponding conditions across multiple variables is rare even over the long term, and because we cannot be certain of which factors determine temperature and over the short term correspondence in the limited number of variables on which we are fairly certain does not necessarily mean correspondence on all conditions. Further, saying "identifying an AGW signal on this short timescale isn’t useful" is an odd turn of phrase. Of course identifying the AGW signal would be useful. What it is not, in the short term, is practicable. However, Curry then goes on to ask a very different question:
    "What is of interest on this timescale is whether natural variability (forced and unforced) can dominate the AGW signal on decadal timescales and produce a ‘pause’ or a ‘stop’."
    In my own terms, the question is, are the short term variations of temperature due to temporary or short term cyclical events of similar slope to the long term trend introduced by anthropogenic forcings? I am not saying this is a useful question, but it is certainly one you can ask. And because it asks a question about the relation between short term effects on temperature and the long term effect, neither are noise. For this question, the only things that would count as noise are measurement error, and a change in the long term trend. Such a change would prevent us from knowing whether any "pause" or "stop" was due to short term variations or to a change in the long term trend, and thus prevent a comparison of the two. Therefore Curry's question only makes sense on the assumption that the long term trend is continuing unabated. Now, fairly obviously, if the slope of the long term trend was similar in value to the slopes that would induced in the temperature by short term variations in a stationary climate, then when those short term slopes are negative, the data will show little or no positive slope, whereas when the stationary short term trends alone are positive, the data will show positive slopes nearly twice the value of the long term trend. This is where Curry comes unstuck. Because short term effects can effect the slope of the data in both directions, both positive and negative slopes are relevant to this question. Further, because not all short term effects have the same absolute magnitude, the correct way to answer this question is by a statistical analysis of all short term trends of a given length over the period in question. If you were to analyze the data correctly for this question, you would be interested in the fact that the trend in the data from January 1998 to March 2010 is 0.22 degrees C per decade, 0.5 degrees C per decade then the 30 year trend to the same period. But you would also be interested in the fact that the trend from Sept 1995 to Dec 2007 (ie, the same duration as the 1998-2010 trend) was 0.46 degrees C per decade. Curiously Curry shows no interest in this fact. I think the reason is straightforward. She wants to give cover to (or keep on side; or maintain an open dialogue with) the people who are trying to ask the wholly illegitimate question of, "Has the long term trend stopped?" Illegitimate, of course (and solely because) the short term trends do not give enough information to answer the question. That is because, for this question short term temperature effects (such as ENSO) are noise. Indeed, earlier in the week it seemed like Curry was asking this question too. She seems now to have changed he tune to give herself a cloak of intellectual integrity, but does not pursue the question she is purporting to ask in any sort of legitimate way.
    0 0
  50. Tom Curtis wrote: "I am going to go out on a limb here, and disagree with both Dikran Marsupial and [some other bloke hardly worth mentioning]." HERETIC!!!!! ;o) The problem is that Curry's second statement isn't meaning full for analysis of the observed trend "What is of interest on this timescale is whether natural variability (forced and unforced) can dominate the AGW signal on decadal timescales and produce a ‘pause’ or a ‘stop’." because how can you tell whether natural valiability is dominating the AGW signal or if the AGW signal isn't there anymore? You can't answer the question posed by looking at observations as you don't know which hypothesis is correct. You could however use synthetic data (as Tamino has) or the output of GCMs (as Easterling an Wehner did), where in both cases the AGW signal is there by contruction. In summary, you can't answer Curry's question by looking at the observed post-1998 trend, but the question has already been answered in other ways (includng by Santer et al, whom she cites!). The thing that worries me is that we now have a climate scientists on record as having said 1998 is a reasonable startpoint for assesseing a trend.
    0 0

1  2  3  Next

You need to be logged in to post a comment. Login via the left margin or if you're new, register here.


The Consensus Project Website

THE ESCALATOR

(free to republish)


© Copyright 2024 John Cook
Home | Translations | About Us | Privacy | Contact Us