Climate Science Glossary

Term Lookup

Enter a term in the search box to find its definition.

Settings

Use the controls in the far right panel to increase or decrease the number of terms automatically displayed (or to completely turn that feature off).

Term Lookup

Settings


All IPCC definitions taken from Climate Change 2007: The Physical Science Basis. Working Group I Contribution to the Fourth Assessment Report of the Intergovernmental Panel on Climate Change, Annex I, Glossary, pp. 941-954. Cambridge University Press.

Home Arguments Software Resources Comments The Consensus Project Translations About Support

Twitter Facebook YouTube Mastodon MeWe

RSS Posts RSS Comments Email Subscribe


Climate's changed before
It's the sun
It's not bad
There is no consensus
It's cooling
Models are unreliable
Temp record is unreliable
Animals and plants can adapt
It hasn't warmed since 1998
Antarctica is gaining ice
View All Arguments...


Username
Password
New? Register here
Forgot your password?

Latest Posts

Archives

Going Down the Up Escalator, Part 2

Posted on 8 November 2011 by dana1981

As we discussed in Going Down the Up Escalator, Part 1, it's a very common mistake - even amongst some climate scientists - to confuse short-term climate noise with long-term global warming signal.  Our very popular Figure 1 below illustrates this confusion very nicely:

skeptics v realists v3

Figure 1: BEST land-only surface temperature data (green) with linear trends applied to the timeframes 1973 to 1980, 1980 to 1988, 1988 to 1995, 1995 to 2001, 1998 to 2005, 2002 to 2010 (blue), and 1973 to 2010 (red).  Created by Dana Nuccitelli.  Hat-tip to Skeptical Science contributor Sphaerica for identifying all of these "cooling trends." (Figure 1 has been added to the SkS Climate Graphics Page).

Some climate "skeptics" have suggested explanations as to why their interpretation of global warming shown in Figure 1 is actually the correct one.  We will examine those explanations in this post.

Step Functions

Guest poster Jens Raunsø Jensen on WUWT created a very similar graphic to Figure 1, trying to argue that global warming can be modeled with step functions rather than a linear trend.

steps WUWT

Figure 2: Jensen's plot of Denmark and global surface temperature, modeled as step functions triggered by Pacific Decadal Oscillation (PDO) shifts and El Niño events

On Judith Curry's blog, "skeptic" Donald Rapp makes much the same argument:

"Thorne et al. (2011) seemed not to be able to recognize the obvious fact shown in Figure 1 that tropospheric temperatures made a step function rise after the great El Niño of 1998 and was fairly constant before and after."

step to my rapp

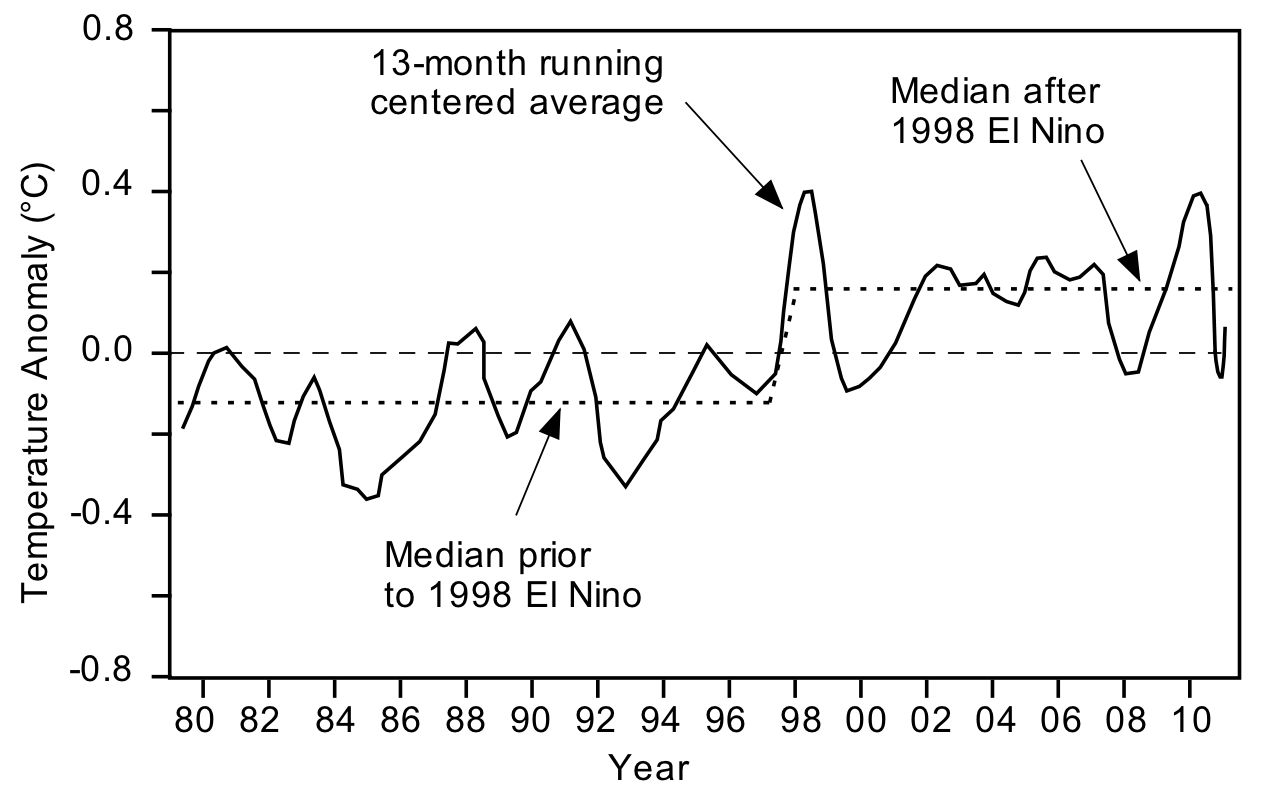
Figure 3: Donald Rapp's tropospheric temperature "step function"

Note by the way that each "skeptic" analysis relies on either HadCRUT or UAH/RSS temperature data, which are either known to or very possibly have a cool bias.

Roger Pielke Sr. echoes a similar argument from David Douglass on his blog (you may be noticing a similar cast of characters as in Part 1; Roy Spencer has also tried to blame global warming on oceanic cycles).

"[Douglass] would have “shouted” that calculating trends across a climate shift has no meaning."

A "Climate Shift"? 

This concept of a short-term "climate shift" may come from Tsonis et al. 2007 and Swanson and Tsonis 2009, whose work John Cook has previously discussed.  In short, Swanson and Tsonis hypothesized that when various natural oceanic cycles (PDO, AMO, etc.) synchronize (i.e. in their positive or negative phases), they can cause a short-term warming or cooling which could be described as a "climate regime shift."

As John discussed in his post, there are some issues with this hypothesis (i.e. we know observed forcings like solar irradiance and aerosols can explain most past short-term temperature changes without requiring major contributions from these "climate shifts").  But more importantly, as Swanson and Tsonis put it, these shifts are superimposed on an anthropogenic warming trendAs Swanson himself put it,

"What do our results have to do with Global Warming, i.e., the century-scale response to greenhouse gas emissions? VERY LITTLE, contrary to claims that others have made on our behalf."

Further, Swanson 2009 discussed that if climate is more sensitive to internal variability than currently thought, this would also mean climate is more sensitive to imposed forcings, which means that we would still expect CO2 and other anthropogenic forcings to cause substantial warming.

Creating Our Own "Climate Shifts"

We can very easily demonstrate the fundamental flaw in this "climate shifts" argument by creating our own simulated temperature data.  Figure 4 shows the following panels:

  1. A 0.2°C per decade global warming trend

  2. Two 'natural cycles' (cosine functions) both with 0.15°C amplitude and periods of 10 and 20 years, respectively

  3. Random noise with 0.07°C amplitude

  4. The sum of the warming trend, cycles, and noise

  5. The sum fit with a step function with three steps: linear trends from 1950 to 1963, 1967 to 1986, and 1987 to 2003 (light blue)

  6. The sum with a linear trend fit from 1950 to 2010.  The linear trend (0.21°C per decade) is almost identical to the global warming signal (0.2°C per decade)

step function vs reality

Figure 4: Simulated temperature data with a global warming signal (0.2°C/decade), natural cycles of 10 and 20 years, random noise, and the sum fit by a step function  (blue and black) and a linear trend (red).  Created by Dana Nuccitelli.

The point here is of course that while natural cycles superimposed on a linear global warming trend can be fit with a step function, the global warming is entirely caused by the linear trend (the radiative forcing, in the real world).  The natural cycles have zero long-term trend and thus while they contribute to short-term temperature changes, contribute nothing to the long-term global warming. 

Thus the "skeptic" conclusion that the step function is the appropriate model, and that natural cycles are what's causing global warming, is simply physically wrong.

Physical Reality

The Achilles Heel of the "climate shifts are causing global warming" hypothesis is that it's simply not a physical argument, for several reasons.

1.  Why would the average global temperature jump to a new warmer state after an El Niño or positive PDO, but not drop back down to its cooler state after a La Niña or negative PDO, for example?  If the "skeptic" climate shift argument is correct, the planet will continue to warm indefinitely.

2.  Oceanic cycles don't create or retain heat, they simply move it around.  So if these climate shifts are causing the surface air to warm, they should also be causing the oceans to cool.  That simply is not the case.  The oceans, surface, and troposphere are all warming because the Earth's total heat content is increasing (Figure 5).


warming

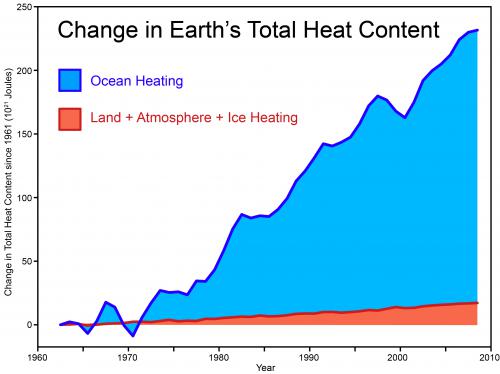
Figure 5: Total Global Heat Content (data from Church et al 2011).  Created by John Cook.

3.  The reason global heat content is increasing is that there is a global energy imbalance caused primarily by the anthropogenic greenhouse gas forcing.  Arguing that the warming is caused by a "climate shift" ignores the physical reality that this forcing and energy imbalance must result in global warming.  Not coincidentally, there is a strong correlation between the temperature and greenhouse gas forcing increases (Figure 6).

forcing temp

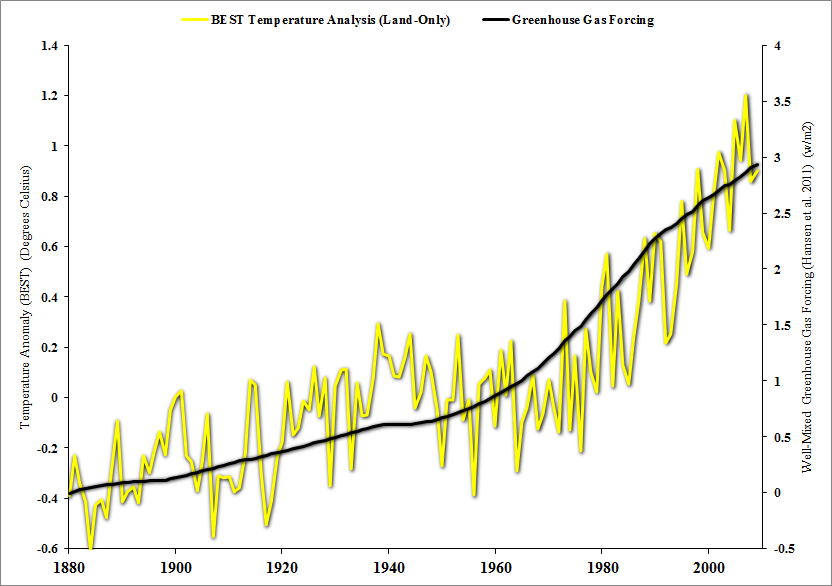
Figure 6: BEST land-only surface tempeature (yellow, left axis) vs. greenhouse gas radiative forcing (black, right axis).  Created by Robert Way.

The bottom line here is that climate "skeptics" need to stop looking for excuses to use short-term noise to argue that global warming has stopped.  It hasn't, and it won't until we get the radiative forcing in Figure 6 under control, which won't happen until we get our greenhouse gas emissions under control.  That's simply physical reality, and denying physical reality won't change it.

The George Santayana quote "Those who cannot remember the past are condemned to repeat it" comes to mind.  Climate "skeptics" keep arguing that the anthropogenic global warming theory is wrong by fitting trends to short-term data, and ignoring the underlying long-term trend.  In each case their arguments have been proven demonstrably wrong, and yet they keep coming up with new variations on the same fundamentally flawed premise.  All the while, the long-term global warming trend continues upward.

Note: this post is also the rebuttal to the myth "It's a climate shift step function caused by natural cycles"

0 0

Printable Version  |  Link to this page

Comments

Comments 1 to 31:

  1. Nice job. A great follow-up to part 1. Small nit: In the next to last paragraph, you say "until we get the radiative forcing in Figure 5 under control," do you mean Figure 6? Notice that these 'steptics' only work with a few decades of data. Good luck finding steps over the long term: I suppose any 'steptic' is tacitly admitting that the climate is indeed warming as each successive step is a jump up. No doubt they expect the same unknown and unexplained mechanism that mysteriously causes these steps to suddenly switch to a negative any day now. One could also argue that a step response requires a system that can pass high frequencies. --source High pass requires low inertia; how can the 'steptics' justify that?
    0 0
  2. muon @1 - thanks, and yes that should say Figure 6 (updated now). It really is a bizarre argument because of the implicit acknowledgment that the planet is just going to keep warming as it keeps stepping upwards. I guess interminable warming is okay with "skeptics" as long as it's naturally caused.
    0 0
  3. Very well put, Dana. One could go even farther and argue that the temperature data indicate rises much steeper than 0.2C/decade, interspersed with “shifts” downward. It might even be a fun exercise for Tamino to try: choose 0.4C/decade, and as Jensen, fit 3 breakpoints and their 4 levels between 1960 and 2010; that’s a total of 7 parameters to cover 50 noisy data points. Should be easy as the standard is not high: the deviations in the Jensen fit are hardly smaller than the noise fluctuations. Or choose a more limited range per Rapp (30 years, 2 levels and one shift year for 3 parameters, oh wait, I’m cherry-picking a starting point, so let that vary as well, that’s 4 parameters...) That’s right, Rapp’s fit is really 4 parameters. To claim as he does that the shift of 0.3C (at 1998 in data that clearly fluctuates by +/- 0.2C) is “obvious” makes obvious only one thing, namely, that he has lost his objectivity. This disqualifies him from doing any science.
    0 0
  4. Regarding Figure 5 Ocean heat content may be a big number in terms of joules but it's low density, Chapter five of the IPCC's AR4 tells us that "Over the period 1961 to 2003, global ocean temperature has risen by 0.10°C from the surface to a depth of 700 m." http://www.ipcc.ch/publications_and_data/ar4/wg1/en/ch5s5-es.html That 0.1°C is presented without error bars. If error bars were included, it may very well be that there was no heating at all and no change in heat content.
    0 0
    Response:

    [DB] "That 0.1°C is presented without error bars.  If error bars were included, it may very well be that there was no heating at all and no change in heat content."

    The paramount word in your phrase is "if".  How about less unsupported assertion and actually reading all of the sources available instead of just a hand-picked few?  From Church & White, the source for Fig 5.:

    Table 1 (click to enlarge)


    Fig 3

    I would posit that if "skeptics" read more with the intent to understand than there would be less of a heightened clamor about "error bars"; really, that becomes a dead giveaway (as seen above).

  5. Hi Dana, good article. We differ over causes of warming, and i still believe that the trend may or not continue, that is still something to see. Not giving enough credence to natural varability, considering that so little is still unkown about the climate and its variables., much less the effects of this solar system on it. The records that we do have, and i mean temp wise only go back so far and the coverage is spotty at best the farther back we go. We can agree that climate change is a slow process. I still beleive that to much emphasis is being made on CO2 with so many other unknowns. But still a good article and you have good reason to be proud of it. Well done.
    0 0
  6. [DB] I see that the Church & White source you list shows the Greenland and Antarctic ice sheets contributing to sea level with the same sign. If you take a look at table 10.7 in the IPCC's AR4: http://www.ipcc.ch/publications_and_data/ar4/wg1/en/ch10s10-6-5.html Antarctica is projected to contribute negatively to sea level. It would follow that the current contribution must be negative as well. Who am I to believe?
    0 0
    Response:

    [DB] "I see that the Church & White source you list shows the Greenland and Antarctic ice sheets contributing to sea level with the same sign."

    Nice goalpost shift.  At least you could acknowledge that you were wrong.

    "Antarctica is projected to contribute negatively to sea level."

    Based on what?

    "It would follow that the current contribution must be negative as well."

    Does not parse/your logic doesn't hold.  Actually, Antarctic land ice is decreasing at an accelerating rate.  Antarctic sea ice is neutral wrt sea level change.

    "Who am I to believe?"

    What does belief have to do with science?  Formulating hypothesis', testing them to build an evidenciary chain strong enough to eventually form the basis for theory is the goal.  Peer-reviewed science published in reputable journals are best.  Assertions without evidence tend to get ignored.  FYI.

    But by all means, don't take my word on things.  Look them up for yourself.

  7. Steve Case, the IPCC AR4 report was based on science which is now about six years old. The Church & White research was published this year... and is consistent with several other studies which have found that Antarctica is now contributing to sea level rise. Basically, AR4 is out of date.
    0 0
  8. 5, grayman,
    considering that so little is still unkown about the climate and its variables.
    False. [I'm presuming you meant "much" instead of "little", or else "known" instead of "still unknown."] Which "natural cycles" do you believe are not understood and are capable of actually adding energy to the system and increasing its overall heat content?
    0 0
  9. It's funny how often the "natural variability" meme is popping up these days. Basically, deniers refuseniks science-rejectionists are waving the white flag on "the globe isn't warming", "greenhouse gases can't effect temperatures" and "global warming is a good thing." They're down to claiming that everything we know is overwhelmed by mysterious, magical forces that we don't understand ("natural variability"), and therefore we can simply ignore what is happening, and what we do know, because the ship will right itself.
    0 0
  10. Sphaerica @6. Thank you for the correction, I did mean "much", but yes i did mean "unknown" Call me what you wish, Does CO2 effect temps, yes, but not as much as has been "decided" it does. Considering that there other GHGs that have a bigger effect. And no i do not think there is some mysterious, magical forces that are the problem, on the contrary, it is a mixture of so many things that are at work to pretend that we know that Y problem will be fixed by X solution. There are so many "what ifs" in play that i do find it hard to justify some of the "could be" fixes. I do not denie that the globe has warmed some and i do not reject science, though some of it is quite iffy at best no matter which side of the argument it comes from, i surely do not refuse all of the solutions, suggestions or wish to ignore what is happening! Dana has taught me a few things that i used to denie, reject or refused to beleive. Does this mean i am a "true" beleiver now, no, i still see things different than him and you, but now with my eyes and ears open wider. Dana is one of many i can thank for that, from this site and others i go to that do offer many compelling views.
    0 0
    Response:

    [DB] One of the primary things to learn about this website is the need to be able to substantiate a postion.  For example:

    "Does CO2 effect temps, yes, but not as much as has been "decided" it does."

    Based on what, exactly?  Source citation, please.

    "Considering that there other GHGs that have a bigger effect."

    Again, what do you base this on?  Source citation, please.

    "some of it is quite iffy at best"

    Which parts?  There is actually quite little I find "iffy" but maybe that's just me.

    "Does this mean i am a "true" beleiver now, no, i still see things different than him and you, but now with my eyes and ears open wider."

    To be honest, it's not a question of what one "believes".  Nor is it about "sides" or "tribes".  It is about science.  Observable, testable science that best explains what we can see and measure.  It's not called climate beliefs nor climate faiths.  It's called climate science. 

    Every post here at SkS contains links to the peer-reviewed, published research so that readers can check things out for themselves.  So no one has to take things on faith here.

    So please take the time to tell us where you got the ideas for your assertions I noted above.  For they are not supported by the literature and the science.

  11. I think it is often wise to look for step functions in a process measurement environment (such as I've been trained in). In many corporate processes performance tends to be relatively flat with random noise until someone makes a change to the system (i.e. introduces a new machine, or changes the standard procedure) which produces a step function. So much confusion in climate science (and indeed other spheres) is causes by people learning rules that work very well in one context, and trying to apply them to a different context. I do come from a context were step functions are a very useful tool, and I can't help but be attracted to the idea that there is a step function in climate. One intriguing possible explanation is to consider a recharge oscillator type mechanism. Perhaps over a period of 10 or so years the climate works in such a way that it is typically losing heat at a slow rate until a threshold is reached and the climate 'jumps' into a new state of higher heat for some reason. This would produce a sawtooth type effect with short steep up-slopes and slow gentle downslopes that cancel out to create no trend. Then if you add a Co2 warming trend on top of this, then the gentle downslopes become close enough to flat that you can't spot the difference and you get a series of up-wards steps.
    0 0
  12. 10, grayman, Daniel summed it up, piece by piece, but as a whole, your paragraph contains a large number of unsupported and vague assertions. There's no meat to it, so it's impossible to argue against. You discuss other greenhouse gases and I have no idea what you're talking about. You talk about something being decided -- excuse me, "decided" -- to try to portray the current state of science as something arbitrary and ill-conceived, and yet again you provide no support for this position (nor is it in any way defensible). Then you lapse into the implication that an understanding of climate science is a religion ("true" believer). All in all, your comment says nothing except that you are angry at being taken to task and asked to clarify an otherwise vague and meaningless statement about how much or how little scientists currently understand. Your position is one of ignorance pronouncing ignorance on others.
    0 0
  13. @ Sphaerica Hey, I just try to table-set/recenter the focus appropriately. You guys are the big hitters doing the heavy lifting. :) Anyway, if you review grayman's previous comments you will note someone trying to extrciate themselves from the fog of "skeptic disinformation" as best they can. It is therefore incumbent upon us to provide a beacon of truth to pierce that fog. Something that you and the other regulars here do very well, I might add.
    0 0
  14. 10, grayman, Let me adjust my tone some, because you did say that Dana had helped you out. I'd like to do the same. But you need to give me something specific that is causing you problems. A general feeling on your part that climate science is just too immature to tackle our current situation is just too vague. There's no way to correct that misconception except to get you to learn every single thing there is to know about climate science, so that you then understand how much we do know, rather than how much you think we don't know.
    0 0
  15. Sphaerica - I'm not sure that grayman's issues are so much scientific as number related. One thing that some people seem to have trouble getting their heads around is the genuinely gigantic quantities involved. May not be true for him, but often is for people with these kinds of complaints about 'the science'. We talk often in percentages and trends and anomalies. The fact that the actual numbers themselves for the atmosphere, the oceans, the biosphere and the impacts of 7 billion humans are literally unimaginable for some people - and talking in numbers derived from numbers obscures that even further. grayman. The things that concern you should come down to 2 issues, one simple, one not. One. Physics may be a hard science in more ways than one, but the physics of the atmosphere are straightforward. Same energy in, less energy out, means more energy accumulating. You may want to spend some time sifting through radiative transfer equations and the like, but you don't have to. Most people don't. Two. Not so simple. Given that energy is accumulating, you're now down to measuring how much, where, when is it showing up. Or is it steadily changing the temperature of ice which might not reach melting point for a number of years yet. Is it warming in places we can't measure as well as we do our backyard temperature yet, like the deep oceans. Are we looking at the right things in the right places at the right times? How much more do we need to know to be sure we're on the right track - scientifically speaking. The result is down to you, me and everyone else to decide. In my view what we've got is good enough - in some respects absolutely astounding, others a bit marginal as yet. I don't send back a meal because the cauliflower's a bit pedestrian today when the rest of the plate is near perfect. I doubt you do either.
    0 0
  16. I thought that I understood climate science as I have a degree in Physics and worked in science for forty years. It was not until I carefully read all the information available on this site over a few weeks that I realised how many misconceptions and just plain ignorance I had on many aspects of climate science. It is difficult to comprehend the full picture even with an open mind. Coming armed with the half truths or completely erroneous information peddled by deniers would make this task almost impossible. My advice would be to ignore any information that is not attributable to the original published refereed science and start with a clean slate. Otherwise it all keeps going in confused circles which is what the purveyors of FUD want. It all reminds me of the old fable of the blind men who each attempted to describe an elephant by the bit they could each feel. Bert
    0 0
  17. Tamino gets 70.9 years as the lenght for the best statistical fit for a single longer cycle, it doesn't fit. http://tamino.wordpress.com/2011/11/07/berkeley-and-the-long-term-trend/ 'Electron walks in a bar and stops to say to the bartender, "You haven't seen me here"'
    0 0
    Response:

    [DB] Hot-linked URL.

  18. jyyh @17 Thanks for the Tamino article. Solidly argued and delightfully written.
    0 0
  19. Response: [to my post #6] [DB] "I see that the Church & White source you list shows the Greenland and Antarctic ice sheets contributing to sea level with the same sign." Nice goalpost shift. Actually [DB}, I originally put up a question about ocean heat. I said: (-Snip-)
    0 0
    Response:

    [DB] We are all well-aware of what you said.  My purpose in posting what I did in response to you was to illustrate the fact that ample data - including the "skeptics" favorite toy: error bars & error data - exist extant of the graph depicted and also extant of the IPCC's summary.  All that remains is for an interested individual to actually look for it, instead of carping about a graph's supposed lack of whatever-their-point-of-interest is.

    If you cannot locate what you are looking for, asking politely without insinuations of conspiracy, fraud or malfeasance on the part of, well, anyone, works best.

    Please make a greater effort to remain on-topic, also.  Off-topic snipped.

  20. Err Steve @19, who are you arguing with? Right now it seems like you are arguing mostly with yourself. Your original question regarding the warming in the top 700 m was and is off topic. It seems that you are talking about oceanic heat content. Please take that to the appropriate thread. Try here. Regarding sea level might I suggest posting here. And regarding the loss of ice from Antarctica might I suggest posting here.
    0 0
  21. Regarding step vs linear: seems to me this is basically a mathematical argument about what curve best fits the data. Why isn't minimizing the squared error (least squares) an acceptable way of getting at this? The physics may bias your choice of functions to consider, of course.
    0 0
  22. 21 Jsquared: "Why isn't minimizing the squared error (least squares) an acceptable way of getting at this?" To a degree, it is the acceptable way. All 'best fit' trend lines and curves should be calculated from linear least squares. However, you can always decrease root-mean-squared error (RMSE) by simply adding additional powers to a best fit polynomial; the problem is then: what physical model justifies higher order curves? So the physics isn't 'biasing' the choice of curves, the physics is a prime control over the choice of curves. The step function is a not a best fit unless one makes an ad hoc chopped salad out up the time interval and then presumes that each section is flat. How physical is that model? And why doesn't anyone on the 'steptic' side ever ask these questions?
    0 0
  23. All 'best fit' trend lines and curves should be calculated from linear least squares. As long as the errors are normally distributed.
    0 0
  24. The sceptical view show and important trend.... Seems to me for the sceptical view, the slope is getting more shallow with every decade. At some point it will level off and start to rise in every decade mostly. Scary stuff.
    0 0
  25. #21, and to add to #22, this is the point I was (perhaps clumsily) making in #3. Calculate the squared deviations from the assumed model. Now that deniers are no longer questioning the reliability of the temperature data, they are proposing models that have no physical basis. To slice and dice, cutting the fit into 4 constant sections and fitting the 4 intervening levels, requires 7 parameters (the 3 cut locations plus the 4 levels). These parameters are varied to find the least-square-deviation. But this makes no more sense than fitting to a 6th order polynomial, which also has 7 parameters. There is no physical basis. The underlying denialist motivation is to show at any cost that there is no relation between rising CO2 levels and rising T.
    0 0
  26. "Oceanic cycles don't create or retain heat, they simply move it around. So if these climate shifts are causing the surface air to warm, they should also be causing the oceans to cool." This claim is repeated dozens of times around the pages of SkS. It is not strictly true, however. Long term changes in oceanic flow can indeed cause the global mean temperature to warm without causing the ocean to cool. The reason being that changes in the distribution of heat can change the distribution of clouds, water vapor and ice, which can, in tern, cause a global radiative forcing. There is quite a bit of research published on this but the following paper is a good place to start: Herweijer C., R. Seager, M. Winton, A. Clement (2005) Why ocean heat transport warms the global mean climate. Tellus, 57A, 662-675 can be found here: http://www.ldeo.columbia.edu/res/div/ocp/pub/herweijer/herweijer_swc_2005.pdf Note that I am not arguing that changes in ocean heat transport are responsible for 20th century warming. Instead I am simply advocating that SkS be a little more careful in the wording that they use to rebut the 'internal variability' argument.
    0 0
  27. The fact that global warming continues despite anti-science groups trying to impose cooling trends on global temp graphs is obvious when you look at most the anti-science graphs. This was the point I was trying to get across in my previous post in part 1 of this series, though I obviously worded poorly. Of course, most anti-science types won't show the whole warming trend, just the decade they've cherry-picked for the purpose of "refuting" the majority of climate scientists. Thanks for these articles exposing the deception, dana.
    0 0
  28. @DB: honestly you should get a Pulitzer not for your brilliant in-your-face answers to "skeptics" but just for your patience with them. /hats off
    0 0
    Response:

    [DB] Thank you for the kind words, but the brilliance is displayed daily by the regular participants here.  I try to make my small contribution in my own particular...idiom.

  29. Dana, Dr. Roger Pielke senior seems to have bought this silly myth hook line and sinker, and worse yet he is feeding Tisdale's blog science to high-school students (see below). Pielke even thinks that it should be published in a journal. How someone with his credentials can be hoodwinked by this is very troubling. It is also odd that while trying to blame internal variability for most of the observed warming in the oceans since 1980, Pielke is also giving free (and uncritical) press to the bizarre claim by Scafetta et al. (2011) that up to 70% of the warming since 1970 is because of so-called "astronomical mechanisms". So according to Dr. Pielke well over 100% of the observed long-term warming is attributable to both internal and external oscillations. How does he reconcile these aforementioned mechanisms with his claims that land-use change has had a marked impact on global climate and temperatures? One does not even have to invoke land-use change or GHGs to explain the observed warming if he believes that Tisdale's and Scafetta's work are worthy of our attention. So either land-use change is not as important as Pielke claims or he is grossly overstating the importance of astronomical cycles and ENSO in explaining the observed long-term warming trend. But he also agrees that CO2 has caused ~30% of the warming. So it would be nice to see some accounting from Pielke. Let me start. Surface temperatures have increased by ~0.5 C since 1980 (start of satellite era): 0.30 C of observed warming according Scafetta et al. is from astronomical cycles (using their lower bound of 60%). 0.25 C from of observed warming according Scafetta et al. is from astronomical cycles (using 50%, my very conservative estimate of what Tisdale means by most, he does not get more specific than that as far as I can tell). We are already at 0.55 C....so what about: X C warming/cooling from land use change (Pielke?) X C warming from GHGs (Pielke?) X C warming from aerosol effects including black carbon (Pielke?) What is also odd though is that in recent discussions with SkS Pielke agreed with the IPCC TAR that solar contributed a positive forcing of 0.30 Wm-2, which is about 5% of his estimate of the total positive forcing since pre-industrial in 2001. That is a factor of ten lower than the claims made by Scafetta et al., yet Pielke advertises their number on his blog without question. These type of logical fallacies being committed by someone of Pielke's stature is truly embarrassing. And last but not least, shame on Dr. Pielke for misinforming and confusing High School students, and for directing Tisdale's site and for telling students that "For example, the global average temperature anomalies are cooling!", even after being told/shown repeatedly that we cannot say the planet is cooling. I'd like to know which school Pielke sent this to, they should be notified. IMO, his answers to the students was the very antithesis of pedagogy. Dr. Pielke is entitled to his opinions, but I must take strong exception when he uses his authority to impart his beliefs and misguided notions on impressionable minds to the point of misinforming them. I hope that the teacher at least uses Pielke's answers as an exercise in critical thinking, rather than taking Pielke's assertions at face value.
    0 0
  30. Albatross @29, the solution to your conundrum is simple. The "hard core" of Pielke's research program, as with any other denier is "anything but Carbon". That being the case, any theory, no matter how bizzare, which attributes warming to a factor other than carbon containing gasses in the atmosphere is worthy of consideration and propagation. Of course, in calling it a research program, I need to note that because its hard core is so tenuous, it is incapable of being progressive (in Lakatos' sense), and is necessarily pseudoscience.
    0 0
  31. I hate to say it, but I agree with Tom Curtis that Pielke Sr. seems to be an "anything but carbon" misinformer. The statements he made to those high school students were simply unacceptable, and he should be ashamed of himself. After skimming Tisdale's post, I also don't see where he claims average temperatures are cooling. Did I miss something? Regardless, Dr. Pielke's behavior here - misinforming high school students - is reprehensible.
    0 0

You need to be logged in to post a comment. Login via the left margin or if you're new, register here.


The Consensus Project Website

THE ESCALATOR

(free to republish)


© Copyright 2024 John Cook
Home | Translations | About Us | Privacy | Contact Us