


 Arguments


Hansen's New Climate Dice - Hot, Loaded, and Misunderstood
Posted on 15 August 2012 by dana1981
James Hansen's newest paper, Perception of climate change, has been published in the Proceedings of the National Academy of Science (PNAS). In January 2012, Michael Sweet examined the draft version of this paper prior to its review and acceptance by PNAS. The paper links increased heat wave frequency and intensity to human-caused climate change. As a result, it has generated a great deal of mainstream media attention, and also a number of misinterpretations and misrepresentations which we will examine in this post.
Hansen's Findings
Hansen et al. examined the surface temperature record to determine how the distribution of temperatures has changed over the past six decades. As we know, the average global temperature has increased approximately 0.7°C over that period, so not surprisingly, the distribution of temperature anomalies has also shifted towards warmer values on average, as illustrated by the animation below and Figure 1.
Source: NASA/Goddard Space Flight Center GISS and Scientific Visualization Studio
This changing temperature distribution is a wholly empirical result, and has also been observed by Donat and Alexander (2012):
"The results indicate that the distributions of both daily maximum and minimum temperatures have significantly shifted towards higher values in the latter period compared to the earlier period in almost all regions"
and
"...these changes have had the greatest impact on the extremes of the distribution and we conclude that the distribution of global daily temperatures has indeed become “more extreme” since the middle of the 20th century."
This was also shown by Meehl (2009), which examined how the ratio of hot to cold records in the United States has changed over the past six decades (Figure 1).

Figure 1: Ratio of record daily highs to record daily lows observed at about 1,800 weather stations in the 48 contiguous United States from January 1950 through September 2009. Each bar shows the proportion of record highs (red) to record lows (blue) for each decade. The 1960s and 1970s saw slightly more record daily lows than highs, but in the last 30 years record highs have increasingly predominated, with the ratio now about two-to-one for the 48 states as a whole.
This main conclusion that we are seeing more and stronger heat waves as a consequence of global warming is a clear, expected, empirical result which we would hope nobody will dispute. The controversy comes in when these results are used to try and attribute individual heat waves to human-caused global warming.
Extreme Heat Waves - Anthropogenic and Natural
Martin Hoerling of NOAA criticized Hansen et al. for attributing several heat waves to global warming in the abstract of their paper:
"we can state, with a high degree of confidence, that extreme anomalies such as those in Texas and Oklahoma in 2011 and Moscow in 2010 were a consequence of global warming because their likelihood in the absence of global warming was exceedingly small."
and in Hansen's related New York Times (NYT) op-ed:
"The change is so drastic, the paper says, that scientists can claim with near certainty that events like the Texas heat wave last year, the Russian heat wave of 2010 and the European heat wave of 2003 would not have happened without the planetary warming caused by the human release of greenhouse gases."
Hoerling responded in a seperate NYT interview by stating that he had previously co-authored a paper which concluded that the Russian heat wave was largely a consequence of natural climate variability. However, the paper in question is Dole et al. (2011), which contained some serious flaws, failing to account for a glitch in the Moscow July station temperature data, which saw an urban heat island correction erroneously applied, as discussed in detail by Stefan Rahmstorf at RealClimate.
Meanwhile the results of Hansen et al. are consistent with those of Rahmstorf and Coumou (2011), who concluded that the Moscow heat wave would likely not have broken the record without an assist from human-caused global warming.
"For July temperature in Moscow, we estimate that the local warming trend has increased the number of records expected in the past decade fivefold, which implies an approximate 80% probability that the 2010 July heat record would not have occurred without climate warming."
Otto et al. (2012) found that the Moscow heat wave was so intense that the human-caused warming alone could not account for it - in other words that it can be called "mostly natural". However, they also found that the warming trend had caused a three-fold increase in the likelihood that the heat record would be broken (Figure 2); in that sense "supporting the assertion that the risk of the event occurring was mainly attributable to the external trend."
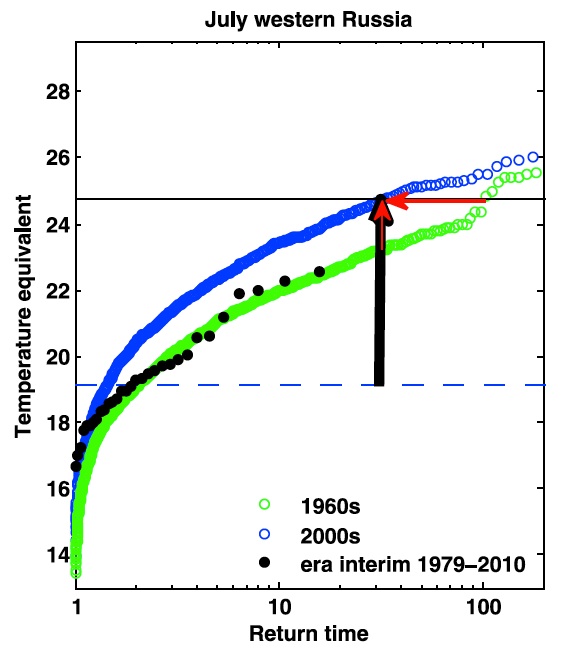
Figure 2: Return periods of temperature-geopotential height conditions in the model for the 1960s (green) and the 2000s (blue) and in ERA-Interim for 1979-2010 (black). The vertical black arrow shows the anomaly of the Russian heat wave 2010 (black horizontal line) compared to the July mean temperatures of the 1960s (dashed line). The vertical red arrow gives the increase in the magnitude of the heat wave due to the shift of the distribution whereas the horizontal red arrow shows the change in the return period. Figure 4 in Otto et al. (2012).
And Hansen's comments about the 2003 European heat wave are consistent with the results of Stott et al. (2004):
"we estimate it is very likely (confidence level >90%) that human influence has at least doubled the risk of a heatwave exceeding this threshold magnitude."
Drought Confusion
In his NYT interview, Hoerling claimed that Hansen's paper confused droughts with heat waves. Patrick Michaels has also described Hansen's paper in similar terms:
"Hansen claims that global warming is associated with increased drought in the US....His hypothesis is a complete and abject failure."
It is a red flag when Patrick Michaels - who has become famous for deleting inconvenient data and distorting other scientists' results - agrees with your criticisms of another scientist's work. It's an olympic-sized red flag when Anthony Watts also agrees.
Predictably, these claims are simply wrong, and entirely mischaracterize Hansen's paper, which focuses almost exclusively on temperature changes and barely even mentions droughts. Watts' confusion came from this Associated Press article which does equate heat waves with drought several times. However, nowhere in the article is Hansen quoted even mentioning drought. Hoerling and Michaels may have confused Hansen's paper with his NYT op-ed, in which he said:
"Over the next several decades, the Western United States and the semi-arid region from North Dakota to Texas will develop semi-permanent drought, with rain, when it does come, occurring in extreme events with heavy flooding."
However, this comment came two paragraphs before Hansen began discussing his new paper, and note that the comment discusses future, not present droughts. Hansen's comments on this matter are supported by the scientific literature, for example Dai (2010), which projects changes in the Palmer Drought Severity Index (PDSI), shown in Figures 3 and 4, concluding:
"Regions like the United States have avoided prolonged droughts during the last 50 years due to natural climate variations, but might see persistent droughts in the next 20–50 years"

Figure 3: PDSI 2030-2039. (Courtesy UCAR)

Figure 4: PDSI 2060-2069. (Courtesy UCAR)
Wehner et al. (2011) (related presentation here) arrived at similar conclusions, as did a new paper by Dai (2012). Joe Romm has a good roundup of relevant research.
Hoerling also quoted the IPCC Special Report on Managing the Risks of Extreme Events and Disasters to Advance Climate Change Adaptation (SREX) to support his point. However, he quoted a section on floods instead of droughts. Here is what the SREX says about US droughts in the next few decades:
"There is medium confidence that droughts will intensify in the 21st century in some seasons and areas, due to reduced precipitation and/or increased evapotranspiration. This applies to regions including...central North America".
Again, this is consistent with Hansen's comments.
Tamino on Variability
Tamino has pointed out that the change in the distribution of surface temperatures may not be due to increased variability, as Hansen et al. conclude, but rather simply due to a combination of different regions warming at different rates, and when their data are combined, the result looks the same as it would if temperature variability were increasing. In other words, we don't know how much of the increase in hot weather events is due to weather becoming more variable, and how much is simply due to average temperatures becoming hotter.
The results of Donat and Alexander (2012) lend some credibility to Tamino's comments regarding a lesser change in temperature variance, although they find that an increase in skewness (asymmetry) of the temperature distribution has probably contributed to the increased frequency of extreme heat events (Figure 5).
"The results indicate that the distributions of both daily maximum and minimum temperatures have significantly shifted towards higher values in the latter period compared to the earlier period in almost all regions, whereas changes in variance are spatially heterogeneous and mostly less significant. However asymmetry appears to have decreased but is altered in such a way that it has become skewed towards the hotter part of the distribution."
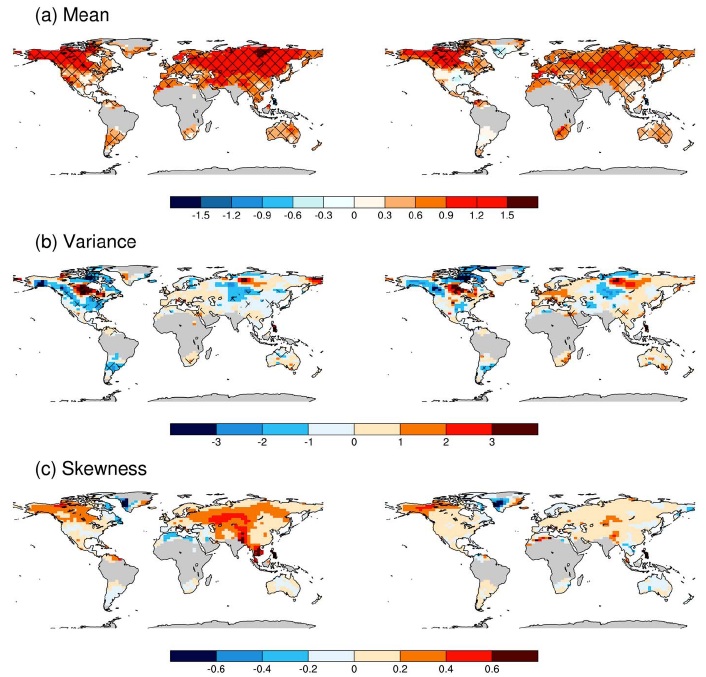
Figure 5: The differences in higher moment statistics of (a) mean, (b) variance, and (c) skewness for each grid box in HadGHCND for (left) daily minimum temperature anomalies and (right) daily maximum temperature anomalies for the two time periods shown. Hatching indicates changes between the two periods that are significant at the 10% level for the mean (using a Student’s t-test) and the variance (using an f-test) of the distribution. Figure 1 in Donat and Alexander (2012).
This is an issue we will be exploring in another post in the near future. However, it does not impact the main result of Hansen et al., that global warming has caused extreme heat events to occur more frequently and to be more intense on average. The question is more of a technical issue - whether the increase in extreme heat events is due more to an increased temperature variability, to the warmer shift in average temperatures, or to increased skewness in the temperature distribution. In any case, human-caused global warming is responsible.
More Mischaracterizations of Hansen et al.
In addition to the misrepresentation of Hansen's results from Michaels and Hoerling, Roger Pielke Sr. has endorsed an extremely poor critique of Hansen et al. by Mike Smith, which does not even address Hansen's new paper, but rather his 1988 paper, and does so by distorting reality as many others (including the aforementioned Patrick Michaels) have. Hansen's paper created global warming projections based on three greenhouse gas emissions scenarios (A, B, and C). Smith claims:
"Turns out that Scenario A turned out to be correct"
This is a false statement which we have debunked many times, most recently here, where we showed that Scenario A has actually turned out to be the furthest from reality (Figure 6).
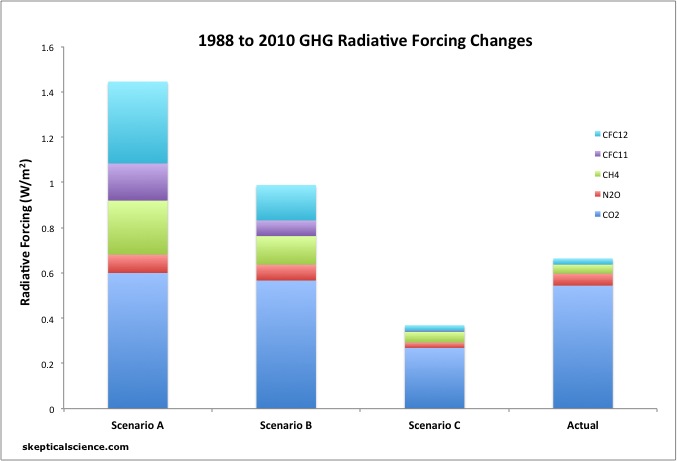
Figure 6: Radiative forcing contributions from 1988 to 2010 from CO2 (dark blue), N2O (red), CH4 (green), CFC-11 (purple), and CFC-12 (light blue) in each of the scenarios modeled in Hansen et al. 1988, vs. observations (NOAA).
Smith in turn (along with Watts, who also posted Michaels' strawman attack on Hansen et al.) endorsed another poor analysis of Hansen's work by Cliff Mass. Mass grossly oversimplified the situation, for example trying to parse out what percentage of the heat waves could be attributed to global warming vs. natural variability by examining the mean annual temperature increase without recognizing that this increase varies over different seasons, different local regions, and possibly even different types of weather events. A few people left good comments on Mass' post here and here, for further reading.
Mass generally misunderstood the arguments of Hansen et al. as well. In the end, Mass basically echoed part of the conclusion from Otto et al. (2012), that the heat waves could be described as "mostly natural". However, the main point of Hansen et al. is that heat waves like those in Moscow, Texas, and Oklahoma will occur more frequently and on average be more intense than they would be without human-caused global warming. As Tamino notes,
"Cliff Mass gives the impression that there’s nothing to worry about because our “3-sigma” events — the real killers — will only be one degree hotter, quite ignoring the fact that we’ll get 10 times as many of them."
Probability - the Language of Science
As the papers discussed here note, these issues boil down to probabilities. Global warming has obviously made temperatures warmer, on average, which in turn has increased the odds of extreme heat events. Hansen's argument is that without global warming, the probability of the Moscow and Texas and Oklahoma heat waves being so hot is so small, that it's safe to say that global warming was a contributing factor - that they would not have been as blisteringly hot in the absence of global warming.
That's not to say that humans caused these heat waves - we didn't. However, odds are very good that they wouldn't have been as hot or record-breaking without human influences, and human influences will also cause more frequent, hotter, record breaking heat waves in the future as global warming continues.
This is where the 'loading the dice' analogy comes in. Hansen's point is that by increasing the average temperature, we are making the hotter temperatures more likely - effectively weighting the hotter values of the climate dice. As a result, today's extreme heat will become the norm a few decades from now, just as what we considered extreme heat a few decades ago has now become much more commonplace. As Tamino put it in a recent post:
"When a 3-sigma event happens, it’s a problem but we can deal with it and recover from it. When 10 (or more) times as many 3-sigma events happen … we have a problem.
That means we’re already in trouble. The really bad news is that we’re already in trouble from just the warming we’ve already experienced, but it’s going to get worse because it’s going to get hotter. You think the 2011 Texas-Oklahoma heat wave was bad? You think this year’s corn-belt heat wave was bad? You think the 2010 Russian heat wave was very very bad? You ain’t seen nothin’ yet."
Hot and Heavy Dice
To summarize, Hansen et al. showed that extreme heat events have become more common and more intense as a result of global warming. While Hansen correctly noted in a NYT op-ed that droughts are expected to become more frequent in parts of the USA in the coming decades, aside from a brief discussion of the link between extreme heat and drought, Hansen et al. (2012) does not address droughts or attribute them to global warming.
Hansen et al. have shown that a number of heat waves such as the 2010 Russian event are very unlikely to have been as intense or record-breaking if humans weren't causing global warming. Simply put, several recent heat waves have been so hot that the chances of a similarly intense heat wave happening several decades ago would have been very, very low. We are loading the dice to make the chances of extreme heat waves happening much higher, which is why they are happening more frequently.
As Hansen et al. note, "public opinion about the existence and importance of global warming depends strongly on their perceptions of recent local climate variations." This is undoubtedly why their paper has been the target of so many mischaracterizations by people who want public opinion to stay right where it is.


 0
0  0
0


Comments