Climate Science Glossary

Term Lookup

Enter a term in the search box to find its definition.

Settings

Use the controls in the far right panel to increase or decrease the number of terms automatically displayed (or to completely turn that feature off).

Term Lookup

Settings


All IPCC definitions taken from Climate Change 2007: The Physical Science Basis. Working Group I Contribution to the Fourth Assessment Report of the Intergovernmental Panel on Climate Change, Annex I, Glossary, pp. 941-954. Cambridge University Press.

Home Arguments Software Resources Comments The Consensus Project Translations About Support

Twitter Facebook YouTube Mastodon MeWe

RSS Posts RSS Comments Email Subscribe


Climate's changed before
It's the sun
It's not bad
There is no consensus
It's cooling
Models are unreliable
Temp record is unreliable
Animals and plants can adapt
It hasn't warmed since 1998
Antarctica is gaining ice
View All Arguments...


Username
Password
New? Register here
Forgot your password?

Latest Posts

Archives

What is the link between hurricanes and global warming?

What the science says...

Select a level... Basic Intermediate

It is unclear whether global warming is increasing hurricane frequency but there is increasing evidence that warming increases hurricane intensity.

Climate Myth...

Hurricanes aren't linked to global warming

“According to the National Hurricane Center, storms are no more intense or frequent worldwide than they have been since 1850. […] Constant 24-7 media coverage of every significant storm worldwide just makes it seem that way.” (Paul Bedard)

There are two aspects to hurricane activity that are often confused so it helps to consider them separately. Specifically, does global warming cause more frequent hurricanes and does it cause more intense hurricanes?

Hurricane frequency

In July 2007, a survey of hurricanes in the North Atlantic over the past century noted an increase in the number of observed hurricanes, concluding "increasing cyclone numbers has lead to a distinct trend in the number of major hurricanes and one that is clearly associated with greenhouse warming" (Holland & Webster 2007). However, this was refuted by an analysis of monitoring systems stating "improved monitoring in recent years is responsible for most, if not all, of the observed trend in increasing frequency of tropical cyclones" (Landsea 2007). In other words, the reason more hurricanes are being observed may be due to an improved ability to observe them, thanks to aircraft, radar and satellites.

History of tropical storms and hurricanes in the North Atlantic
Figure 1: History of the tropical storms, hurricanes, and major hurricanes (Category 3+) in the North Atlantic derived from the analysis of the National Hurricane Center (Rohde/Global Warming Art).

The question of hurricane frequency was also addressed in a study that used climate models to simulate hurricane response to warming in the North Atlantic. Increasing temperature leads to an increase in vertical wind shear which may inhibit the formation of hurricanes (Vecchi & Soden 2007). Thus, the impact of global warming on hurricane frequency is one area requiring further research and more data.

Hurricane Intensity

To determine whether warmer temperatures affect hurricane intensity, one study began by defining the potential destructiveness of a hurricane based on the dissipation of power, integrated over the lifetime of a hurricane (Emanuel 2005). The Power Dissipation Index is found to increase since the mid-1970s, due to both longer and more intense storms. Hurricane intensity is also highly correlated with sea surface temperature. This suggests that future warming will lead to an increase in the destructive potential of tropical hurricanes.

Hurricane Intensity (Power Dissipation Index) versus North Atlantic Sea Surface Temperature - Emmanuel 2005
Figure 2: Smoothed Power Dissipation Index (dotted line, a measure of hurricane intensity) versus Tropical Atlantic Sea Surface Temperature (solid black line) (Emanuel 2005).

Global satellite data since 1981 can be used to extend analysis of hurricane intensity to each ocean, looking for any trend in wind speed (Elsner et al. 2008). Figure 3 plots the long term trend in maximum wind speed (eg - whether hurricanes are getting stronger or weaker) against different strength hurricanes. This tells us not only whether hurricanes are overall getting stronger but also how different strength hurricanes are being affected. Overall, there is a statistically significant upward trend (the horizontal red line). But more significantly, Elsner found weaker hurricanes showed little to no trend while stronger hurricanes showed a greater upward trend. In other words, stronger hurricanes are getting stronger. This means that as sea temperatures continue to rise, the number of Category 4 and 5 hurricanes hitting land will inevitably increase. More on Elsner's paper...

Trends in tropical cyclone/hurricane maximum wind speeds for different strength hurricanes
Figure 3: Trends in  tropical cyclone maximum wind speeds for different strength hurricanes. Uncertainty range is shown in grey. Solid red line is the overall trend, dashed red lines show 90% confidence range (
Elsner 2008).

Intermediate rebuttal written by John Cook


Update July 2015:

Here is a related lecture-video from Denial101x - Making Sense of Climate Science Denial


This rebuttal was updated by Judith Matz in September 2021 to replace broken links. The updates are a result of our call for help published in May 2021.

Last updated on 14 October 2016 by pattimer. View Archives

Printable Version  |  Offline PDF Version  |  Link to this page

Argument Feedback

Please use this form to let us know about suggested updates to this rebuttal.

Acknowledgements

The image North Atlantic Tropical Storms and Observing Techniques is courtesy of Global Warming Art.

Emanuel's graph of PDI versus temperature was courtesy of Climate 411.

Further reading

Comments

1  2  3  4  Next

Comments 1 to 25 out of 93:

  1. A well balanced article. Excellent. Thank you! "It's important to remember that hurricane activity is just one possible side-effect of global warming. While the empirical evidence linking global warming and hurricane intensity seems robust, it has no bearing on the central question of whether human CO2 emissions are causing global warming." True, but if human CO2 emissions causing global warming do not have damaging consequences, such as increased storm activity, the 'central question' is no longer central, is it? Some interesting data on hurricanes: Fewest Northern Hemisphere Hurricane Days since 1977. 3rd Lowest since 1958 (behind 1977 and 1973). See: http://www.coaps.fsu.edu/~maue/tropical/
    Response: If the only consequence of global warming was increased hurricane activity, then you'd have a point. However, they are the tip of the iceberg (pardon the pun). See positives and negatives of global warming for a more comprehensive list.
  2. Your list of potential catastrophes makes interesting reading. But there are no citations, so I wonder how many of these items are speculations and how many have any scientific backing to them. Presumably if the global temperature dropped 2C then we could construct an equally long list of potential catastrophes. It seems that the implications of all this is that somehow, miraculously, the current average global temperature must be perfect.
  3. http://www.physorg.com/news116687408.html "Titled "Effect of Remote Sea Surface Temperature Change on Tropical Cyclone Potential Intensity," their study found that long-term changes in potential intensity are more closely related to the regional pattern of warming than to local ocean temperature change. Regions that warm more than the tropical average are characterized by increased potential intensity, and vice versa. "A surprising result is that the current potential intensity for Atlantic hurricanes is about average, despite the record high temperatures of the Atlantic Ocean over the past decade." Soden said. "This is due to the compensating warmth in other ocean basins." "As we try to understand the future changes in hurricane intensity, we must look beyond changes in Atlantic Ocean temperature. If the Atlantic warms more slowly than the rest of the tropical oceans, we would expect a decrease in the upper limit on hurricane intensity," Vecchi added. "This is an interesting piece of the puzzle." - A. McIntire
  4. HISTORICAL HURRICANE FREQUENCY ..........Landsea et al, 2009 (From NYT Aug12, 2009) The researchers studied storms that played themselves out at sea, either in a day or two or over a longer period, from 1878 to 2008. By the late 19th century, they estimated meterologists missed perhaps two of the larger storms each year, and by the 1950s they were picking up on average all but one each year. Yet the researchers estimate that a century ago, as many as 80 percent of short-lived storms came and went without ever being officially noticed. Over all, they conclude, storm counts have not changed in the last century. ..........Mann et al, 2009 (Ditto) ...used a mathematical model of hurricane activity and measurements of sediment to estimate how often major storms struck the Gulf and Atlantic Coasts of the United States in the last 1500 years. ...the researchers worked with sediment samples from Puerto Rico, the Gulf Coast and the Atlantic Coast from Florida to New England. Although current numbers are relatively high, they say, both analytical methods suggest that a period of high storm frequency, possibly even higher than today's, began in the year 900 and lasted until 1200 or so. ..........Lund et al, 2009 September 22, 2009 Clemson University press release: Hurrican Frequency Is Up, But Not Their Strength... In a new study, Clemson University researchers have concluded that the number of hurricanes and tropical storms in the Atlantic Basin is increasing, but there is no evidence that their individual strengths are any greater than storms of the past or that the chances of a U.S. strike are up. ...studied changes in the tropical cycle record in the North Atlantic between 1851 and 2008. "This is a hot button issue in the argument for global warming," said Lund. "Climatologists reporting to the U.S. Senate as recently as this summer testified to the exact opposite of what we find. Many researchers have maintained that warming waters of the Atlantic are increasing the strength of these storms. We do not see evidence for this at all, however we do find that the number of storms has recently increased." The study represents one of the first rigorous statistical assessments of the issue with uncertainty margins calculated in... While the study did conclude that more storms are being documented, researchers found no evidence of recent increases in U.S. landfall strike probability of the strongest hurricanes. Lund notes that "because these types of storms are so uncommon, it will take many years of data to reliably assess this issue."
  5. FACTORS INHIBITING HURRICANES ...while water temperature is the most important factor in tropical cyclone dynamics, many other environmental factors affect these storms. These include: the deep warm water; moisture availibility; weak wind shear; a source of rotation, and no land interaction/landfall. Only when all these factors exist can a hurricane reach its maximum potential intensity for a given water temperature. In fact, few hurricanes reach their potential because some inhibiting factor exists. Furthermore, global warming could enhance some negative influences regionally; an ensemble of 18 global climate models show that wind shear and dry air will increase in the Atlantic, while in contrast the opposite occurs in the west Pacific where environmental factors favor more hurricanes. Therefore, anthropogenic warmer oceans do not necessarily correlate to increased tropical cyclone activity or stronger hurricanes globally. Climate models give mixed results on whether the average storm intensities will change, but most show evidence for some increase in intensity. Pat Fitzpatrick, Hurricanes and Climate...~2007 One inhibiting factor is the El Nino, a body of relatively warm equatorial water in the eastern Pacific. Absent for the past few years, it is expected to bring weak to moderately warm water to the South American west coast. A characteristic of El Nino is westerly winds in the upper troposphere that act to shear the tops off Atlantic easterly waves coming off the African Coast, preventing them from growing into named storms or hurricanes... However, this (weak to moderate) El Nino will fall well short of the one that occurred in 2007, limiting the season's total named storms to seven. From William Gray's 2001 hurricane forecast Working in a strategically located lagoon off Puerto Rico, Donelly and Woodruff compiled the long record (cores, 2007) of strong hurricanes in the Atlantic region. The 5,000 year record identified two factors that appeared to heighten Atlantic activity: weak El Ninos in the tropical Pacific and strong monsoons in West Africa. Scientists have established that strong El Ninos can stunt hurricane activity by causing strong high-altitude winds that inhibit hurricane formation. Other reseaqrchers have identified that storms over western Africa generate atmospheric waves that move into the Atlantic and provide "seedlings" for hurricane development... Oceanus Feb 13, 2009
  6. The formation of Atlantic hurricanes also appears to be strongly influenced by Saharan dust. The dust from the Sahara tracks westwards into the ocean and causes local cooling, depressing the temp. below thresholds needed for hurricanes to form. ntrs.nasa.gov/archive/nasa/casi.../20080039568_2008038939.pdf - summarises the work by Lau & Kim.
  7. Glad the consensus has determined hurricane frequency should be retired to the ash heap of arguments. So how did this one slip through the consensus? ---- Global warming is causing more frequent hurricanes in the North Atlantic and Gulf of Mexico, according to a study from the National Center for Atmospheric Research. The increased frequency of tropical cyclones ``is largely a response'' to a 1 degree Celsius rise in sea water temperatures since 1905 that was caused by greenhouse gases, the study found. Since 1995, the North Atlantic has experienced an average of 15 tropical storms a year, of which eight became strong enough to be called hurricanes. That compares with 10 tropical storms and five hurricanes per year from 1930 to 1994, the report says. ``There is an 80 percent chance that the majority of the current increases have been impacted by global warming,'' said Greg Holland, director of the research center in Boulder, Colorado, and co-author of the study. ``The bad news is that we've gone up in numbers overall, and in the proportion of major hurricanes as well.'' -- http://www.climateark.org/shared/reader/welcome.aspx?linkid=81144
  8. Will, Human civ., which started ~10000 years ago was largely established thanks to the climate. I think a 2C decrease would also cause a lot of problems. Here's a nice graph, although I'm having the hardest time pinpointing the source. Maybe Fig. 1.3 of Climate change and human health : risks and responses. Editors : A. J. McMichael et al. WHO. 2003.
  9. Sorry guys. Neither hurricane frequency nor intensity is related to AGW. If anything, there is a slight century scale decrease in hurricane activity over the Atlantic (with huge swings up & down). Click on image for explanation One thing is sure. To choose 1972 for a starting point of the analysis (as in Fig. 2 above) is utterly misleading.
  10. BP #9 You're overstating your conclusions again with "Neither hurricane frequency nor intensity is related to AGW" Given that we can date the current global warming period starts in around 1975 it's a valid hypotheis to ask whether that has an influence on hurricane frequency and intensity. In fact, despite some suggestion that both have increased since the early 1970s, it seems from the data that the effect size is small, and because hurricanes are a complex phenomenon, it will take quite a while to have enough data to determine the relationship. Pretending that this hypothesis is somehow disproven is massively overstating your case, and shows that the work you do on this topic is tainted by your preconceptions.
  11. #10 kdkd at 20:08 PM on 19 August, 2010 despite some suggestion that both have increased since the early 1970s Of course they did. However, if one is trying to do valid climate science, the first question to ask is why hurricane intensity has dropped dramatically between 1959 and 1972? Until we have an answer to that question, there is no point in making fancy theories about the partial recovery after 1990 which still have not reached the levels once seen during the 1940s. Not even those in the 1880s when temperature is supposed to be way lower than today.
  12. #11: "why hurricane intensity has dropped dramatically between 1959 and 1972?" The question is based on a still-questionable statistic of cumulative SSn by year. There are many problems with this statistic. Is a year with 3 cat 2 storms 20% worse than a year with 1 cat 5? There are many residents of the Gulf Coast and Florida who would vehemently disagree. The SSn given is at landfall (so that Katrina is a cat 3); it was cat 5 just offshore when it was piling up the storm surge that destroyed lower New Orleans. And why does the graph shown stop in 1995, when it is labeled as representing 1851-2009? Surely a trailing average could include those more recent (and more active) years. As I pointed out in the prior thread, total number of named storms seems to increase over the period. Yet this met with the skeptical "In earlier times there must have been a lot that would have deserved a name but never got one, because went unnoticed." Pardon me, but does that seem to be an appeal to disregard a published graph because it doesn't reflect some non-existent data points? Hardly a scientific argument. 'Dropped dramatically' seems to stem from the trend of -0.43 per century. Is there any statistical significance to such a small number? Especially when we routinely hear challenges to a temperature trend of 0.15 degC/decade, nearly 4x as large. And then there's this point about the 2005 season: In terms of accumulated cyclone energy (ACE; the sum of the squares of the maximum wind speed at 6-h intervals for all tropical and subtropical cyclones with intensities of 34 kt or greater; Bell et al. 2000), the 2005 season had a record value of about 256% of the longterm (1944–2003) mean. The previous record was about 249% of the long-term mean set in 1950. [emphasis added] So let's not claim that hurricane intensity is dropping over the long term.
  13. BP #11 Why [has] hurricane intensity dropped dramatically between 1959 and 1972? Nope, again, that's a hypothesis (over an even shorter time time span than the early 70s to the present day where we have an increase). This hypothesis will be difficult to test due to low statistical power, and because it's unclear what should be measured to test it (or if the measurements are available). Again you're overstating your case. In this example you appear to be cherry picking to suit your preconceptions.
  14. I was playing around with some North Atlantic hurricane data and got a chart very similar to figure 1 above (except up through 2009 and without the 'major hurricanes' distinction) when something occurred to me. How can Landsea make the 'better detection' argument when there is no evidence of a change in values when the detection methods changed? If you look at the 'tropical storms' section from the end of the 'ships with radio' period through 'aircraft', 'radar', and the start of 'satellite' tracking there is very little change... just some minor up/down variation. If Landsea's claim that storms were systematically missed by the older methodologies were true there should be one or more significant jumps in there. Instead, we see storm levels holding fairly steady until ~20 years into the satellite tracking era... and then climbing steadily for the 20 years since then. Granted, the period of sharply increasing storm activity is fairly short and difficult to draw definitive conclusions from... but that doesn't change the fact that the data doesn't show any evidence of the measurement bias Landsea suggests is behind the increase. Also note that there was an earlier increase in frequency up until leveling off around 1950... that corresponds to the early 20th century warming period and the leveling off to a period of more level temperatures... all within the 'ships with radios' measuring period. Again, it is a short timeframe, but again there seems to be a correlation to temperatures rather than measurement methodology. All of these trends are present, but less distinct, on the 'hurricanes' and 'major hurricanes' subsets of the data as well. Obviously the temperature to storm/hurricane count correlation is not a perfect match... but there is NO correlation between the changing methodologies and increasing storm/hurricane count. Doesn't that invalidate Landsea's argument?
  15. Recently I was talking to a skeptic I know in the USA (the same one I've mentioned here on other threads)and I was telling him about how the massive floods we're having in Australia are linked to climate change and this was his response: "In another time your Green MP upon seeing an eclipse of the sun would have jumped upon a soap box and proclaimed, “Give me your money now or I shall blot out the sun again!” You can see how far we’ve come, today’s MP upon seeing a flood, says in effect, “give me power or there will be no one to protect you from the evil forces of greedy industrialists!” Ah, progress! You should take heart though, after hurricane Katrina hit the U.S. Greens were coming out of the woodwork predicting a new era of increased severe hurricane activity caused by global warming. Not only has there not been another severe hurricane to hit the U.S. but all hurricane activity has dropped off precipitously. Of course the way is now clear for Greens to point out the “fact” that the unnatural drop-off in hurricane activity is an example of rampant global warming! Four years ago, the area of California around L.A. was experiencing a drought. Greens were quick to point out that global warming was turning California into a desert and that California should brace itself for perpetual drought. Yes … currently, the rains in California have been so drastic that mudslides are what threaten humanity, not lack of water. Still Californians, who must be the holy grail for con-men the world over, rushed to pass laws aimed at curbing emission standards, ransacking their homes for anything of value to throw on the pile of wealth in hopes that the wizard will be pleased and the sun will not be blotted out again. And it goes without saying that the Greens have pointed out that the above average rainfall of the last two years in California is an example of the kind of “Global chaos” that we should come to expect from increased Co2 emisions. Mankind is responsible for about .28% of all of the greenhouse gases in the atmosphere. If the entire U.S. stopped producing Co2 gas completely tomorrow the effect could not be measured yet here we have a Green in Aus passionate that Melbourne reduce its Co2 emissions so that floods will be prevented. The fact that people are still threatening to blot out the sun unless they are paid off isn’t what’s surprising, the surprising thing, and the very sad thing, is that people are still lining up to give away their wealth and freedom to the latest Hucksters." What do you guys make of that?
  16. Chris, here's my suggestion FWIW. Preparation for storms is essential regardless of averages and predictions. Alt energy will work well with a smart grid. Arguing about whether "CAGW" is a religion doesn't advance science and most of his examples are red herrings, the science is not capricious or extreme. The article at the top of this thread is a good example of that.
  17. I'm intrigued by the Hurricane story. If the atmosphere is getting warmer then one would expect tropical storms to increase in both frequency and intensity as there would be more energy in the system to power them, therefore one would expect more to become Hurricane force too, so overall average numbers should go up along with their average power. I have decided to do my own research on this, and it hasn't been easy finding reasonably reliable data that goes back a decent amount of time. As it is I have found archive data from ships reports and later monitoring reports of Hurricanes from 1851 to 2010, this later data, from 1995 does indeed see a marked increase in both tropical storms, hurricanes and their relative energy, based on wind speeds, I appreciate that until the more modern era wind speed assumptions for such events have a degree of error in them..afterall people on a ship were a little busy to be doing too much science! I'll be honest, I did not see any real rise or fall in the figures until I got to the 1990's, then both the number of events and the average wind speed has increased. I will plot this information into graphs and publish it for everyone to look at..but it will take a little while..I will also try to get some information, accurate, on how wind speeds were reported, if there has been a change to which tropical storms are recorded, such as a lowering of the minimum speed for recording purposes as this will allow a better understanding of the increase from 1995 on. If there has been no recording change, then the number has most definitely increased, as has the power of the events...and this would certainly imply that there is more energy in the system to power these storm, and that certainly indicates a rise in temperature over this period. I will try to get it online in the next few days..as this intrigues me..
    Response: Read the original post carefully. Notice that not all researchers agree with you that "one would expect tropical storms to increase in both frequency and intensity as there would be more energy in the system to power them." It's more complicated than that.
  18. The Earth is either not warming at all recently or there's no connection whatsoever between temperature and storminess. Global Tropical Cyclone Accumulated Cyclone Energy (ACE) according to Dr. Ryan N. Maue at the Florida State University: 
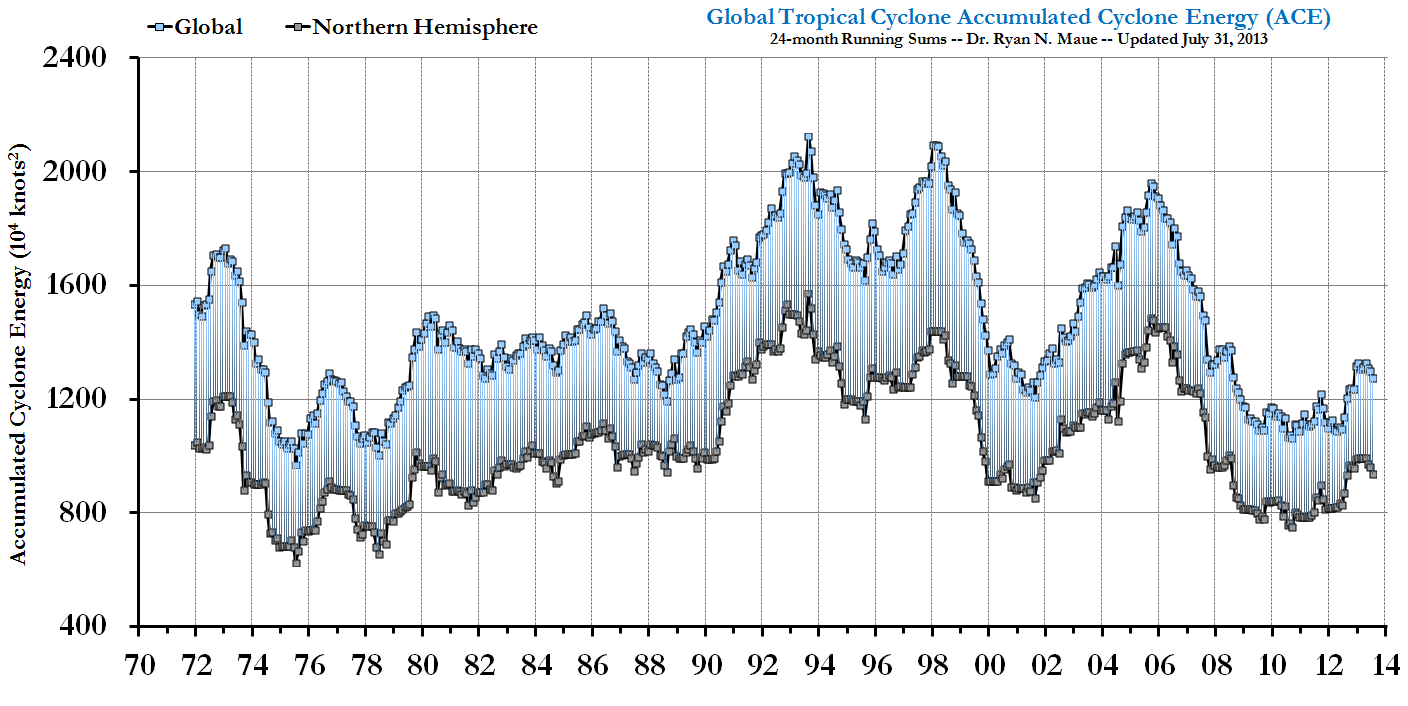
"With 2010 being a globally »hot« year, we saw the fewest number of global tropical cyclones observed since at least 1970."
  19. Why do you assume I did not read it? If you notice I used the word..assume..under normal circumstances when one puts more energy into a system, you get more energy out of it..I am not stating that either side of this comment is correct..If, and it is a big if, the atmosphere works the same as other systems in nature, then it is a reasonably conclusion to arrive at that by putting more energy into the system, one would expect more energy out, and in the case of tropical storm, one would expect more of them and likely with a higher energy level..but that is not necessarily the case. The only way to find out, or at least get a better handle on it is to go through all the available data that can be accepted as reasonably reliable and then put it into a useful and unbiased format. Then look at all other influences that may either positively or negatively impact any of that information...I am sure that, regardless of air and sea temperatures, there is far more going on to influence a tropical storm into becoming a Hurricane than we realise at this time..Like I said, this part of the discussion intrigues me...
  20. #20: "either not warming at all recently ..." We know that's not true. "... or there's no connection whatsoever between temperature and storminess." No connection whatsoever is a strong phrase in this context. From Jeff Masters: Tomas' formation ties 2010 with 1995 and 1887 for 3rd place for most number of named storms in an Atlantic hurricane season. Only 2005 (28 named storms) and 1933 (21 named storms) were busier. ... The intensification of Shary and Tomas into hurricanes today brings the total number of hurricanes this season to twelve, tying 2010 with 1969 and 1887 for second place for most hurricanes in a season. The record is held by 2005 with fifteen hurricanes ... -- emphasis added The last time this came up, you argued for some sort of ad hoc statistic by summing Safir-Simpson number of US landfalling storms annually. This completely discounts storms that bypass the continental US (which seems arbitrary) and ignores tropical storms (which seems capricious). FYI: See arbitrary and capricious. Here's the graph of named storms prior to the 2010 season: which is complicated, but seems to be vaguely increasing over time, especially since the 1920s. The conclusion in prior threads was this particular aspect of the science isn't settled. So 'no connection whatsoever' is hardly warranted. And then there are those nasty Pacific storms... this is about global warming after all.
  21. I've taken UAH satellite measured lower troposphere temperatures anomalies and annual global accumulated cyclone energy for the satellite era (1979-2010) and have made a scatter plot. If anything, there's a weak negative correlation between temperature anomaly and ACE. That is, there's no need to be scared about would-be supercanes. Named storms is crap. Before the satellite era tropical storms not making landfall were seldom named because they could easily go unnoticed. This is why hurricanes making landfall in the US of A are important for century scale histories. They are extremely well documented. If not by scientists, then by insurance companies for sure.
  22. #23: "Named storms is ... ." But your 'scatterplot' is meaningful? Hardly. Let's stop throwing judgments around. Perhaps an appeal to actual science is in order. Here's Elsner 2008: Atlantic tropical cyclones are getting stronger on average, with a 30-year trend that has been related to an increase in ocean temperatures over the Atlantic Ocean and elsewhere ... Knutson et al 2008 report a different view: we assess, in our model system, the changes in large-scale climate that are projected to occur by the end of the twenty-first century by an ensemble of global climate models, and find that Atlantic hurricane and tropical storm frequencies are reduced. At the same time, near-storm rainfall rates increase substantially ... What's worse? More frequent storms or stronger storms with heavier rainfall events? Check the residents of the US Gulf Coast or Queensland for their preferences.
  23. #24 muoncounter at 05:12 AM on 21 January, 2011 But your 'scatterplot' is meaningful? Hardly. What do you mean? Explicate, please.
  24. #25: "Explicate"? What's to explain? Your own words, #23: "If anything, there's a weak ..." The 'if' and 'weak' loom large indeed when one looks at the graph in #23. But here's how the folks who gather the Accumulated Cyclone Energy data forecast the 2010 storm season: The lower caption states expected ACE range is mainly above 175% of median, which reflects the high likelihood of a very active season (also called hyperactive). Note that a 'high-activity era' started in 1995 and now the bars are red. And that brings us back to Masters' review of the 2010 season, cited in #22 above. Even better, here's link to a video retrospective: The Hyperactive Hurricane Season.
  25. Does anybody have a comment on this paper cited by post 20? (the Maue paper). Its a new 'hot item' among gw denialist sites...

1  2  3  4  Next

Post a Comment

Political, off-topic or ad hominem comments will be deleted. Comments Policy...

You need to be logged in to post a comment. Login via the left margin or if you're new, register here.

Link to this page


The Consensus Project Website

THE ESCALATOR

(free to republish)


© Copyright 2024 John Cook
Home | Translations | About Us | Privacy | Contact Us