Italian flag curry
Posted on 21 December 2012 by gws
Today’s recipe is what you get when you mix the wrong ingredients. So here it goes …
Ingredients
- An Italian flag, preferably with equal size green, white and red sections
- Uncertainty, preferably precooked to “we-don’t-know”-tenderness
- Opinion, better more than less
- Pinch of Science, for improving taste
pre-heat blog by announcing recipe
prepare recipe without too much attention to detail
leave most of preparation to others
return to recipe with more ingredient 3. after the food critics alerted you to the lack of beef
Is this going to go anywhere?
By now you may have recognized that this post is about uncertainty and how Dr. Judith Curry has framed the topic repeatedly in the past. Perhaps most prominently, she used it to describe her thinking on the IPCC 2007 detection and attribution statement in the Summary for Policymakers :
"... my personal weights for the Italian flag are:
- white 40%,
- green 30%,
- red 30%
My assignment allows the anthropogenic influence to be as large as 70% and as small as 30%, leaving plenty of room for natural variability and uncertainties. An average score of 50% might be assigned to this distribution, with a white dominance."
Representing uncertainty with an "Italian flag"
I have taken some time to explore the “Italian flag” (pdf) use in Tesla software a bit more, and contrary to what Curry makes it look like, I found that it is something quite different:
I. The “Italian flag” is a representation of 3-valued logic (true or false or "some indeterminate third value") based on an expert group’s beliefs about individual pieces of scientific evidence. Note that this is different from the evidence itself, which of course is usually either in support of a hypothesis, or not.
II. 3-valued logic representation, or more generally Evidence Support Logic (ESL), is used in Tesla software to encapsulate the available evidence and present it in a form that both allows anyone to trace the logic behind evidence-based decision making, and can be understood by a lay audience
III. Expert judgments about sub-hypotheses (in the Italian flag format) are combined through sufficiency, dependency, and necessity “weights” towards a judgment on an overarching hypothesis underlying a required decision
IV. The software is thus used as a “decision support tool” using expert opinion and available evidence to arrive at a traceable (and defendable) summary statement.
Perhaps needless to say, Judith Curry did not explain it that way, nor does she seem to have understood the implications for use of the Italian flag visualization other than that her opinion should count. Maybe she should have read about the actual uses of the software and the process?
An Example
Let’s have a look at a climate-related example as that helps to understand. First, we make a single root hypothesis/statement and then assign multiple, related leaf hypotheses that are parts of a decision tree. Let’s assume our overarching hypothesis is that “the observed increase in atmospheric CO2 is due to anthropogenic activities”. The reason I chose this statement is that we have a wealth of evidence which can be used here. According to the Tesla user guide cited by Curry, the first task in tackling the main hypothesis is to break it down into those smaller ("leaf") hypotheses for which evidence exists, and to ask how the available evidence compares to an ideal situation, in which we have all the evidence we would want to base a decision on.
Curry did not do that.
Next, the quality and uncertainty of the evidence needs to be weighted in terms of its sufficiency, dependency, and necessity. From the Curry-cited Tesla User Guide (emphasis added):
“The evidence for and against each leaf hypothesis are then also elicited by expert judgment based on an evaluation of the information available. Here it is recommended that ‘evidence for’ and ‘evidence against’ a hypothesis are elicited separately. This can be done using a linguistic confidence scale, such as ‘Very confident’, ‘Confident’, etc., which is then […] mapped to a numerical scale.”
Using a linguistic method, as the IPCC does, is criticized by Curry. Instead, we find no description in her Italian flag posts about any of these critical parts of the process.
Following our climate cluedo post, this is how this process of leaf hypotheses and assessment could look like to address the main hypothesis:
- The start of the growth in CO2 concentration coincides with the start of the industrial revolution
- Increase in CO2 concentrations over the long term correlate with cumulative anthropogenic emissions
- Annual CO2 concentration growth is less than annual CO2 emissions
- Declining C14 ratio (indicates the source is very old)
- Declining C13 ratio (indicates a biological source)
- Declining atmospheric O2 concentrations (indicate a combustion source)
- Partial pressure of CO2 in the ocean (is increasing)
- CO2 emissions from volcanoes (are much smaller than anthropogenic CO2 emissions)
- Known changes in terrestrial biomass (are a small CO2 source)
- Known changes of CO2 concentration with temperature (speak against ocean outgassing)
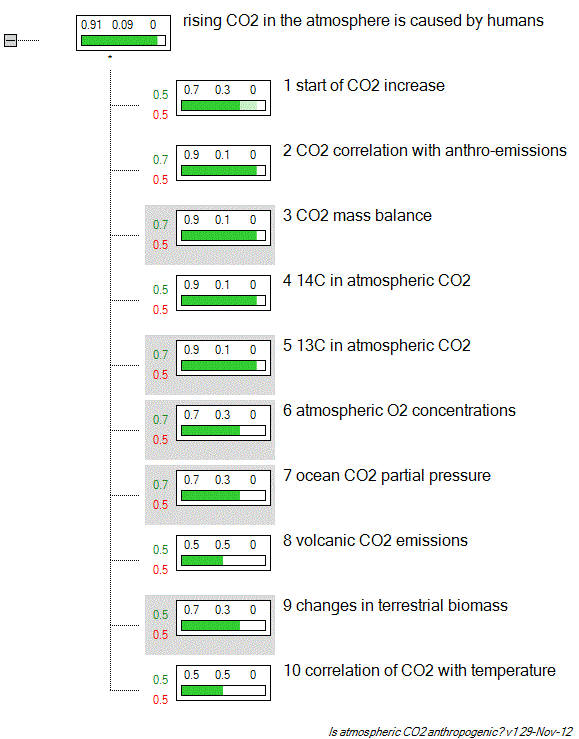
The following tree plot from the Tesla program shows the values entered for the above ten statements. Following recommendation, the confidence into the evidence was chosen linguistically with 0.5 representing average, 0.7 representing good/high, and 0.9 representing very good/high confidence. There are no relevant papers in the literature providing any evidence against them, so no red sections appear. The sufficiency values, materializing as the strength with which a leaf hypothesis is propagated to the main hypothesis are plotted to the left of the flags. Necessity is indicated via a grey background. Dependencies are not visible in Tesla but were entered between hypotheses 1&2, 3&6, and 7&10.

Figure 1: Tesla tree plot using our climate change cluedo post collection of evidence for the anthropogenic origin of the observed atmospheric CO2 increase.
The (expected) result is that we have a very high confidence in atmospheric CO2 being of anthropogenic origin, and even if all confidence values are uniformly set to average (a sensitivity test available in Tesla), the main hypothesis (green section) number only drops from 0.91 to 0.86.
Using Tesla
The program is quite straightforward. It allows for full evidence documentation and entering of confidence reasoning, allows flexibility of confidence level parameterization, and keeps a log of changes made over time. Its methodology has been tried out and there is no reason why it could not be applied in decision making with respect to climate change questions. In fact, the methodology is not qualitatively different from what the IPCC is already applying to characterize uncertainty.
Curry did not apply the above process. Had she done so, she may have needed to consult the literature, showing a rather clear picture contradicting her assignments.
She instead keeps assigning confidence levels to “for”, “uncommitted” and “against” without specifying underlying hypotheses for which direct evidence can be evaluated. She states her main interpretation of the Italian flag presentation here:
“Uncertainty in each of the premises is characterized qualitatively by the Italian flag analysis described in Doubt, whereby evidence for a hypothesis is represented as green, evidence against is represented as red, and the white area reflecting uncommitted belief that can be associated with uncertainty in evidence or unknowns”
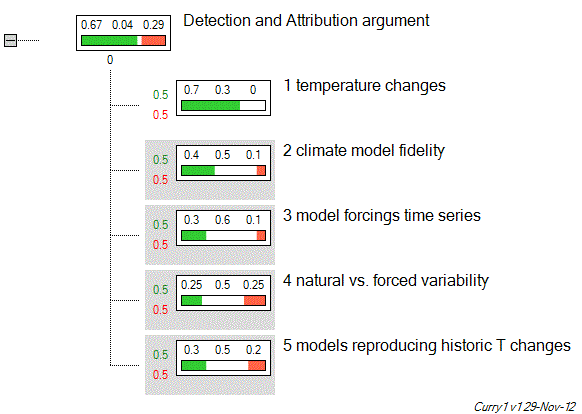
Thus, she mistakes the expert evaluation of evidence for the evidence itself. Even though she lists perceived sub-hypotheses (assigned as her perceived IPCC reasoning) in that thread, if we follow her argument through at face value, we arrive at this picture:

Figure 2: Tesla tree-plot analyzing Curry's perceived IPCC detection and attribution logic.
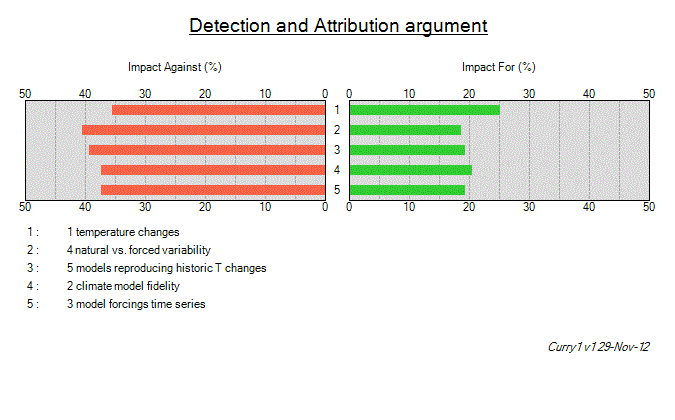
That is, already by Curry’s standards, confidence into the detection and attribution statement is twice as high as no confidence. Using another one of Tesla’s sensitivity analysis plots, the so-called Tornado-plot, we can highlight which of Curry's “premises” have the largest impact on the main argument:

Figure 3: Tesla Tornado plot of Curry's argument.
From this, it is obvious that changes to the “against” values have a larger impact throughout Curry’s arguments, and are seemingly what motivates contrarians like her. But do these “arguments” hold any water? Curry asks
“Question B: Is my assignment of the Italian flag % values correct? Assignment of % values in the Italian flag analysis is necessarily subjective since the size of the “white” area is by definition unknown. Other assignments of % would be plausible, but my assignment is not inconsistent with uncertainties stated by the IPCC itself as well as my analysis on previous threads.
Question C: Assuming that the answers to A and B are “yes”, how should we assess confidence in the conclusion (#7) based upon the 6 premises?
B: Definitely No. While she may be correct that the white area is representative of uncertainty statements made by the IPCC, the assignments to the red area remain a mystery.
C: How about actually doing the math?
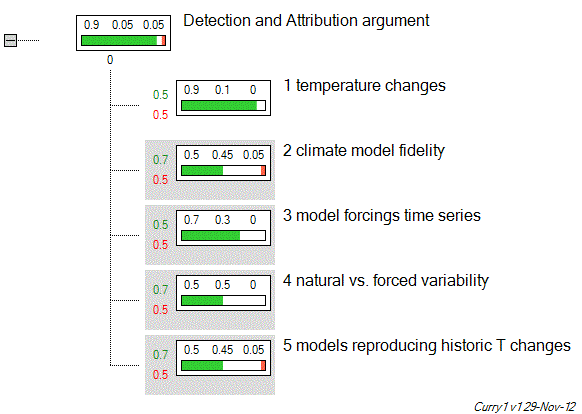
If we put some more realistic values into Curry’s own scheme, we may end up here:
 Figure 4: Tesla Tree-plot of Curry's argument with realistic confidence values
And now the actual IPCC detection and attribution statement …
“Most of the observed increase in global average temperatures since the mid-20th century is very likely due to the observed increase in anthropogenic greenhouse gas concentrations”
… even in Curry’s narrow view, can be considered well supported.
Misrepresenting Again?
So it seems Curry is misrepresenting both the methodology and its results when evidence-supported inputs are used. But does the methodology present an improvement in characterizing uncertainty?
Although that is a question that we cannot answer here with confidence, thanks to another post by Curry we know of another paper that described and compared the method to two other methods. But, unfortunately, neither Curry not her "denizens" interpreted it correctly. Curry writes
“The results [of the analysis in the paper] are displayed in Table III using point probabilities for the Bayesian analysis and Italian flag interval probabilities for the SLP and IPT analyses, whereby the number on the left is belief for, and the number on the right is belief against the proposition.”
If that were only so … as explained in section 2.2 of that paper
“If A is a proposition, an interval number is used as a probability measure, so that
P(A) = [Sn(A), Sp(A)]
where Sn(A) is the lower bound on the probability P(A), or necessary support for A, and Sp(A) is the upper bound on the probability P(A), or possible support for A.”
Thus, when she later cites this section from the paper ...
“The source proposition receives a support of 0.58 from the Bayesian belief network, [0.21, 0.86] from SLP and [0.37, 0.72] from IPT.”
... she does not seem to realize that there is no discrepancy between these (and other cited) numbers that would suggest her perceived inadequacy of the Bayesian network (0.58 lies close to the middle of these intervals). So, again, her point remains a mystery.
Conclusion
In repeating her ill-considered and evidence-unsupported use of the Italian flag representation of ESL she further discredits her views on uncertainty, at the same time not doing the software developer or the other ESL users a favor with her misrepresentation. While it appears that the Italian flag representation of uncertainty has appeal, and may be a useful recipe to convey the reality and threat of climate change to various audiences, it also appears that Curry's current usage resembles more the above bad Italian flag curry.


 Arguments


 0
0  0
0


Comments