Climate Science Glossary

Term Lookup

Enter a term in the search box to find its definition.

Settings

Use the controls in the far right panel to increase or decrease the number of terms automatically displayed (or to completely turn that feature off).

Term Lookup

Settings


All IPCC definitions taken from Climate Change 2007: The Physical Science Basis. Working Group I Contribution to the Fourth Assessment Report of the Intergovernmental Panel on Climate Change, Annex I, Glossary, pp. 941-954. Cambridge University Press.

Home Arguments Software Resources Comments The Consensus Project Translations About Support

Twitter Facebook YouTube Mastodon MeWe

RSS Posts RSS Comments Email Subscribe


Climate's changed before
It's the sun
It's not bad
There is no consensus
It's cooling
Models are unreliable
Temp record is unreliable
Animals and plants can adapt
It hasn't warmed since 1998
Antarctica is gaining ice
View All Arguments...


Username
Password
New? Register here
Forgot your password?

Latest Posts

Archives

Lean and Rind Estimate Human and Natural Global Warming

Posted on 11 January 2012 by dana1981, KR

In a paper a few years back, Lean and Rind (2008) performed a very similar study to one we recently examined from Foster and Rahmstorf (2011), filtering out short-term effects on global temperature to tease out the human and natural contributions to global warming.  To accomplish this, the scientists used a multiple linear regression (MLR) analysis to determine the contributions of the El Niño Southern Oscillation (ENSO), solar activity, and anthropogenic influences on the measured global surface temperature changes. 

Their key finding - the contribution of each effect to the observed global surface warming trends over the four periods in question - is shown in Figure 1.

LR08 contributions

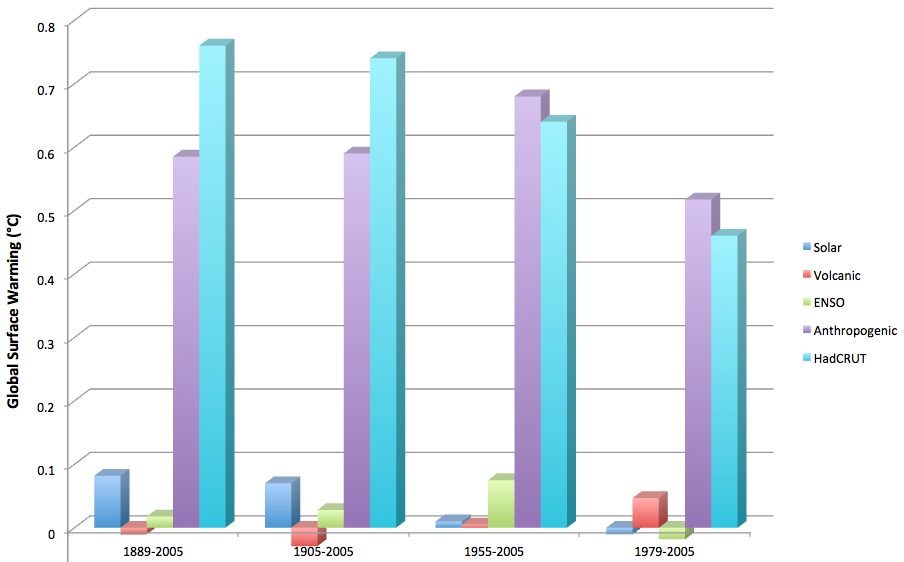
Figure 1: Contributions of solar activity (dark blue), volcanic activity (red), ENSO (green), and anthropogenic effects (purple) to global surface warming (HadCRUT observations shown in light blue), according to Lean and Rind (2008).

Multiple Linear Regression Background

MLR (see here and here for information and examples) is a technique of analyzing the contributions of multiple independent influences upon a dependent variable (in this case, temperature). "Independent" means that the contributors are not correlated, that (for example) the influence of ENSO cannot be replicated by summing up solar and volcanic changes, because they have quite different variations over time. MLR gives an indication of the relative influence of various contributors over the temperature, and what happens to temperature when a contributor changes. Analyzing what is left over (the "residuals") after summing the various contributions shows whether the most significant contributions are being considered.

Any large trend or variation left in the regression residuals would indicate that other, uncorrelated, factors are in play.  However, as both Lean and Rind (2008) and Foster and Rahmstorf (2011) have shown, once solar and volcanic influences, anthropogenic warming, and ENSO variations are accounted for, there is very little variation left.

Note that an MLR analysis with small residuals does not necessarily indicate causal relationships - but it does indicate that the causal factors for the temperature changes are quite well correlated with the indices used in the analysis.

Methods

While Foster and Rahmstorf limited their analysis to the past 32 years (since the start of the satellite temperature record), Lean and Rind performed their analysis over a range of timeframes: from 1889 to 2006, 1905 to 2005, 1955 to 2005, and 1979 to 2005. 

Lean and Rind describe their methods thusly:

"Using the most recently available characterizations of ENSO, volcanic aerosols, solar irradiance and anthropogenic influences, we perform multiple linear regression analyses to decompose 118 years (11 complete solar cycles) of monthly mean surface temperature anomalies into four components. The decomposition is conducted for the global signals, and on a 5° x 5° latitude-longitude grid to determine the corresponding geographical patterns. We repeat the analysis for the NCEP and satellite epochs to establish that the approach is robust for datasets of different lengths, and we examine the evolution of decadal power in the natural influences to assess their projections onto each other as sources of error in prior results. Our results yield trends in the four individual global surface temperature components over the past 25, 50 and 100 years"

To evaluate the contribution of ENSO, Lean and Rind used the Multivariate ENSO Index (MEI), augmented with an index derived from Japan Meteorologial Agency sea surface temperatures.  The effects of volcanic aerosols were estimated from data compiled by the NASA Goddard Institute for Space Studies (GISS), and solar irradiance was based primarily on sunspot data. 

Results

Lean and Rind estimated the anthropogenic forcing based on the net effect of eight different components, including greenhouse gases, land use and snow albedo (reflectivity) changes, and tropospheric aerosols.  The Lean and Rind reconstructed contributions to global temperature changes from each component is shown in Figure 2.

LR08 Fig 2

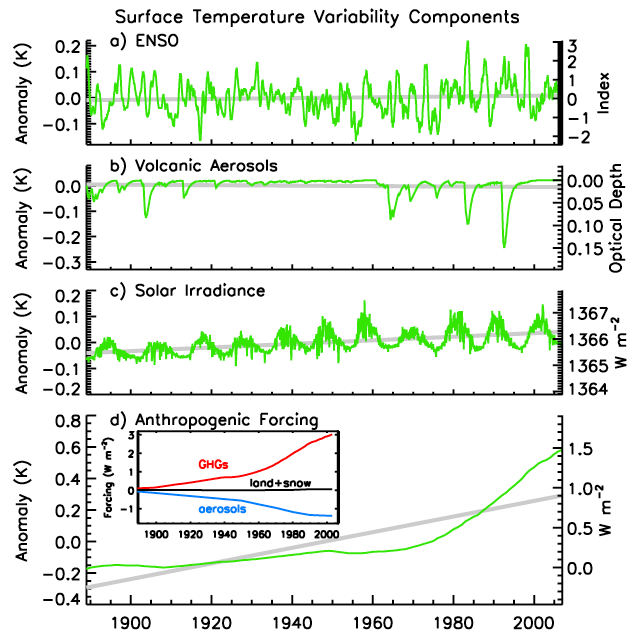
Figure 2: Lean and Rind reconstructions of the contributions to monthly mean global surface temperatures by individual natural and anthropogenic influences. The right hand axes give the native scales of each influence, and the left hand axes give the corresponding temperature change determined from the multiple regression analysis.  The grey lines are trends for the whole interval. The inset in Figure 2d shows the individual greenhouse gases, tropospheric aerosols and the land surface plus snow albedo components that combine to give the net anthropogenic forcing.

Table 1 shows the resulting contributions to the global surface temperature changes which are illustrated graphically in Figure 1 [Note: click on Table 1 for a larger version].

LR08 Table 1

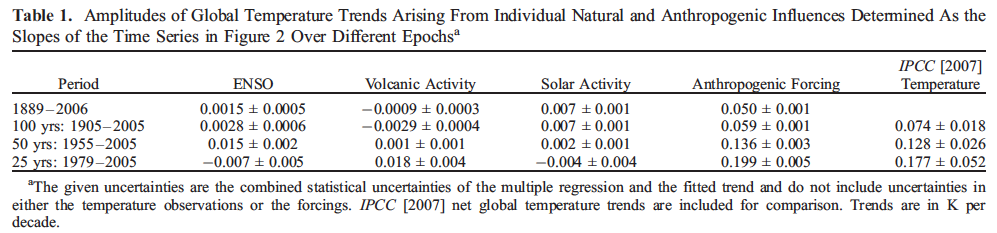
Although the timeframes examined in this study and by Foster and Rahmstorf are somewhat different (the former ending in 2005, the latter ending in 2010), the estimated contributions from the various factors since 1979 are similar.  Foster and Rahmstorf estimated a -0.015°C per decade contribution from ENSO, 0.020°C per decade from volcanoes, and -0.019°C per decade from solar activity (compared to -0.007, 0.018, and -0.004°C per decade, respectively, in the Lean and Rind analysis).  The solar and ENSO cooling contributions have increased as a response to the extended solar minimum between 2005 and 2010, and the strong La Niña of 2008, respectively.

We can also convert the values in Table 1 to percentages, to estimate the contributions of each effect to the observed warming (Table 2).

Table 2:  Percent contribution to global surface warming from each effect assessed in Lean and Rind (2008)

Period Warming Anthropogenic ENSO Volcanic Solar
1889-2006 0.76°C 78% 2.3% -1.4% 11%
1905-2005 0.74°C 80% 3.8% -3.9% 9.5%
1955-2005 0.64°C 106% 12% 0.8% 1.6%
1979-2005 0.48°C 112% -4.0% 10% -2.3%

Conclusion - Humans are Driving Global Warming

The fundamental conclusion in Lean and Rind's paper is that the observed global warming over the past century, and especially over the past 25-50 years, is predominantly human-caused:

"None of the natural processes can account for the overall warming trend in global surface temperatures. In the 100 years from 1905 to 2005, the temperature trends produce by all three natural influences are at least an order of magnitude smaller than the observed surface temperature trend reported by IPCC [2007]. According to this analysis, solar forcing contributed negligible long-term warming in the past 25 years and 10% of the warming in the past 100 years"

One key aspect of this type of study is that it makes no assumptions about various solar effects.  Any solar effect (either direct or indirect) which is correlated to solar activity (i.e. solar irradiance, solar magnetic field [and thus galactic cosmic rays], ultraviolet [UV] radiation, etc.) is accounted for in the linear regression.  Both Lean and Rind and Foster and Rahmstorf found that solar activity has played a very small role in the observed global warming.  Bottom line - it's not the sun.

Similar to the remaining warming trend in Foster and Rahmstorf (2011) after the short-term noise was filtered out, Lean and Rind found a very steady human-caused global warming trend from 1979 to 2005 (Figure 2d, green line), having contributed to more warming than has been observed over that period.  In short, the recent global warming is predominantly human-caused.

Note: the Lean and Rind results have been incorporated into the rebuttals to It's the sun (Intermediate and Advanced), A drop in volcanic activity caused warming, and It's El Niño.

0 0

Printable Version  |  Link to this page

Comments

Comments 1 to 17:

  1. That inverse correlation between aerosols and GhGs in Fig. 2 really has me concerned. That looks like a really serious problem looming if and when we get the Co2 reductions that are needed.
    0 0
  2. tmac57, it probably isn't quite as bad as it looks because aerosol pollution is a short term effect while CO2 is long term and cumulative. Put another way... the warming due to CO2 is determined by the area under the red curve, but the cooling due to aerosols is determined by a point on the blue line. Given that the primary source of both CO2 and aerosol pollution is coal power plants it is likely that any significant reduction in CO2 output would be matched by an accompanying reduction in aerosols... and since the total atmospheric level of CO2 would then remain at the accumulated level for centuries while the aerosol load would fall within a few years we can expect a period of accelerated warming if/when this happens. However, because of the cumulative nature of the CO2 forcing we are already seeing a great deal of its resultant warming now... rather than the current temporary aerosol load masking all/most of it.
    0 0
  3. tmac57 - Yes, Strong present-day aerosol cooling implies a hot future. The Andreae 2005 paper is well worth a read.
    0 0
  4. A couple of interesting observations. 1st, as the period becomes shorter and closer to the present the Anthro' contribution is getting larger, suggesting not just the dominance of the Anthro' part but its increase over time, just as you would expect as CO2 levels and emission rates rise. 2nd, for the last two shorter and more recent periods the sum of all 4 components is around 120%. Implying that there is another factor(s) that contributes some cooling. Yet this isn't there when the data covers a longer period. This means this other factor must have changed more recently. The key independent variable that L&R haven't analysed for (because they can't, we don't have adequate data on it) is non-Volcanic Aerosols. So what changed in the more recent period to change this? Us. Human air pollution from all sorts of sources. This might even be reflected in the values for those last 2 numbers in Table 2 1955-2005 is 120.4% total while 1979-2005 has dropped to 115.7% Does this reflect the fact that 1955-2005 includes the 50's, 60's and earlier 70's before the worlds various Clean Air Acts improved air pollution while the later period from 1979 was a world with somewhat cleaner air. That simple bar graph pretty clearly show the dominance of the Anthro' component, its increasing influence over time and Non-Volcanic aerosols look like strong candidates for a moderating effect, much as expected. It's always nice when new data and analyses show repeated confirmation of previous results. 'Settled Science'? Well just how settled does it need to be?
    0 0
  5. Glenn - re your 1st point, the lack of natural warming (due to flat solar and volcanic forcings since mid-century) also contributes to the increasing anthropogenic component. re your 2nd point, LR08 do include anthropogenic aerosols (see the inset in Figure 2d). The fact that their individual contributions sum to more than 100% is probably mostly due to the model not quite fitting the data over that timeframe.
    0 0
  6. Interesting to see that they've used only used TSI to measure the sun's contribution. What about changes in EUV, UV, solar wind speed, geomagnetism etc...? To confine the sun's influence on climate to TSI is about as sensible as measuring the sound-effect of a symphony orchestra by reference to the volume of the first violinist.
    0 0
  7. #6, TSI is not just visible light - it includes the radiation beyond visible light. As for solar wind speed and geomagnetisn (though the geomagnetic field is technically the Earth's magnetic field), you'd need a mechanism by which the solar wind, or charged particles from the Sun and beyond could affect Earth's climate. So far, no mechanism has been found, and there is no evidence of any event being caused by magnetic field variations. If you have evidence otherwise, reply on an appropriate thread. So really using TSI for the Sun's contribution is like measuring the entire orchestra's output, yet perhaps ignoring the slightly squeaky floorboard beneath the tuba player's foot...
    0 0
  8. ms2et @6, because the solar influence is determined by a regression against TSI, that influence includes all influences of the Sun on Earth's temperature that are correlated with TSI. Svenmark's theory of the influence of cosmic rays on climate argues that low solar magnetic field (as when the TSI is low in the sunspot cycle) results in more clouds, and hence lower temperatures, and conversely when TSI is high. Hence it is correlated with TSI in its influence on temperature, and is therefore included in the regression. Therefore the solar influence detected by Lean and Rind is the sum of the influences of TSI, cosmic rays, and what have you.
    0 0
  9. ms2et @6 - ditto what Tom Curtis said @6, which was also pointed out in the penultimate paragraph of the post above. Anything correlated to TSI, which includes EUV and cosmic rays, is taken into account through this multiple linear regression approach.
    0 0
  10. #6, 8, 9 : this point of TSI-UV-EUV correlation, albeit probably marginal or null in terrestrial temperature trend, is still in debate among solar scientists. For example, see Frölhich 2009 : long term trends of TSI and UV seem to differ, the minimum of TSI for 2008 did not produce a similar minimum in UV irradiance.
    0 0
  11. skept.fr - "...this point of TSI-UV-EUV correlation, albeit probably marginal or null in terrestrial temperature trend, is still in debate among solar scientists." (emphasis added) That, the emphasized portion, is a critical point - the largest part of solar variance seems correlated with TSI (or sunspots - Foster and Rahmstorf 2011 found no significant difference when substituting sunspot number for a TSI index). And once the major contributors to temperature change are identified we gain a better understanding of climate - some ability to predict future temperature evolution. The results in Lean and Rind 2008/2009, Foster and Rahmstorf 2011, and others - these all indicate that we have a pretty good grip on the major influences behind climate change. Other influences are certainly there, with varying degrees of uncertainty - but they appear quite small. While small changes around the edges are interesting, and quite worthy of research effort, we really do know what the elephant in the room is - anthropogenic greenhouse gases.
    0 0
  12. I have to say, clinging to UV as a significant cause of global warming at this point isn't skepticism, it's desperation. There's just no evidence for it.
    0 0
  13. dana1981 @ 5: Re your point about the model’s estimated changes, according to the data provided by LR08 (Table 1), the model over-estimates the actual temp change by 16% for the 25 year period, over-estimates it by 20% for the 50 year period and under-estimates it by 11% for the 100 year period. Given the considerable uncertainty in the temperature change itself, not to mention in some of these components other than athro forcing, maybe taking the point estimates of each and using them to express model variable impacts as a percent of actual temperature change, as you have done, causes more confusion than it provides insights. Of course, you hear this same thing in effect done fairly frequently and I’d personally say to good rhetorical effect. But for a more rigorous summary, maybe the way to go would be to use some bootstrapping of the model—including these post-estimation calculations—to show the full uncertainties in these percentage attributions. Thanks for another good post, though.
    0 0
  14. #11 : I think my point was clear, but whatever the (non) influence of spectral / total solar irradiance on Earth climate, you've not to say that TSI variance is correlated to UV-EUV variance if it is not in reality or if scientists debate about the nature and scale of this correlation (see also Lockwood et al 2010, Lukianova et Mursula 2011 ). There's no reason to doubt that GHGs are the main driver of T for the past 50 yrs, but also no reason to overestimate our level of confidence in solar physics understanding, still low to medium. They are many debates in solar physics community but 99% of solar specialists interested in climate do not think the TSI could have a warming influence on Earth for cycle 21-23 (I think the 1% is Scafetta alone :-)). So, LR08 and FR11 are not in question for their major conclusion. #12 Who is "clinging to UV as a significant cause of global warming"? Certainly not me, you should not be so "warming-centered" in your interpretations. I think the following sentence in the article "Any solar effect (either direct or indirect) which is correlated to solar activity (i.e. solar irradiance, solar magnetic field [and thus galactic cosmic rays], ultraviolet [UV] radiation, etc.) is accounted for in the linear regression" is not enough precise. If you look for example at Harder et al 2009 , figure 1, giving results for the SIM-SORCE instrument (=measurement of spectral irradiance), you observe that changes in the different bands are sometimes orthogonal (200-400 nm bands = UV are down whereas others in visible or near IR are up). So I think the linear regression used by LR08 informs us about TSI (what is de facto linearily regressed in regards of T), but not specially about particular components of this total irradiance. Maybe I'm wrong, I'm not familiar with statistics (nor solar physics by the way). If you agree with me (with the papers I linked) that spectral and total irradiance are not necesseraily correlated in a cycle (or in trend of cycles), this is just a suggestion for a more precise formulation. Feel free to ignore it if unsound.
    0 0
  15. skept.fr @14, so long as the change in relative strengths in different bands is consistent across all solar cycles, it will correlate with TSI, and its effect on temperature will be included in the regression. That effect may have the same sign as the effect of change in TSI, and hence strengthen the TSI signal. Alternatively it may be of opposite sign, and weaken the signal. It will still be incorporated in the regression. It is only if the effect is largely random with respect to the strength of TSI that the regression will not include it as either a strengthening or weakening effect on the TSI, but I am unaware of any suggested solar mechanism effecting climate that is not correlated with TSI.
    0 0
  16. Thanks, guys. I now understand why my analogy was a very poor one: TSI correlates well with the other solar variables that I was curious about, so it's appropriate to use it in the regression.
    0 0
  17. Zachary Shahan at PlanetSave has reposted the article with the following introduction: "The folks over at Skeptical Science recently put together a great summary post of a Lean and Rind paper on human and natural factors influencing global warming. The obvious conclusion was that humans are driving global warming. In particular, there’s no way solar activity, volcanic activity, and the El Niño Southern Oscillation are causing the warming. The first chart below says it all. But, for those who want more than a chart, I’m just going to repost the whole piece (click to enlarge any of the images or charts). Thanks to Skeptical Science for the great work they do on this front!" Source: Planetsave (http://s.tt/15cER)
    0 0

You need to be logged in to post a comment. Login via the left margin or if you're new, register here.


The Consensus Project Website

THE ESCALATOR

(free to republish)


© Copyright 2024 John Cook
Home | Translations | About Us | Privacy | Contact Us