


 Arguments


Levitus et al. Find Global Warming Continues to Heat the Oceans
Posted on 25 April 2012 by dana1981
Levitus et al. had previously published updated ocean heat content (OHC) data on the National Oceanic Data Center (NODC) website, labeled as "Levitus et al. in preparation" (Figure 1).
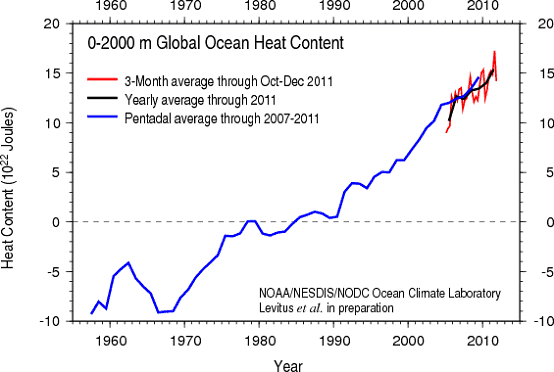
Figure 1: Global OHC for the upper 2000 meters of oceans (NODC)
Levitus et al. (2012) is now in press, discussing the OHC data published by NODC. Figure 2 below (from Levitus et al.) presents the data in a similar fashion to Figure 1 above, but breaks out the data to show the OHC contribution from the 700 to 2000 meter ocean layer.
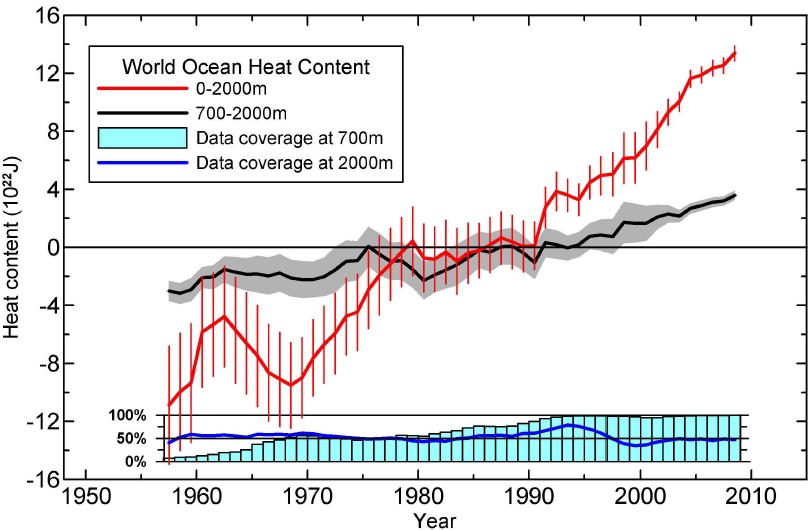
Figure 2: Time series for the World Ocean of ocean heat content (1022 J) for the 0-2000m (red) and 700-2000m (black) layers based on running pentadal (five-year) analyses. Reference period is 1955-2006. Each pentadal estimate is plotted at the midpoint of the 5-year period. The vertical bars represent +/- 2 times the standard error of the mean (S.E.) about the pentadal estimate for the 0-2000m estimates and the grey-shaded area represent +/- 2*S.E. about the pentadal estimate for the 700-2000m estimates. The blue bar chart at the bottom represents the percentage of one-degree squares (globally) that have at least four pentadal one-degree square anomaly values used in their computation at 700m depth. Blue line is the same as for the bar chart but for 2000m depth. From Levitus et al. (2012)
Data and Main Findings
Levitus et al. use OHC measurements from ARGO floats corrected for systematic errors, as well as data from expendable bathythermographs (XBT) and mechanical bathythermographs (MBT), with the necessary corrections applied. A bathythermograph is an instrument which has a temperature sensor and is thrown overboard from ships to record pressure and temperature changes as it drops through the water. These were the main instruments used to measure OHC before the ARGO float network was deployed starting about a decade ago to provide more accurate and consistent data.
The authors discuss some of their key results:
"The World Ocean accounts for approximately 93% of the warming of the earth system that has occurred since 1955. The 700-2000m ocean layer accounted for approximately one-third of the warming of the 0-2000m layer of the World Ocean. The thermosteric component of sea level trend was 0.54 ±.05 mm yr-1 for the 0-2000m layer and 0.41 ±.04 mm yr-1 for the 0-700m layer of the World Ocean for 1955-2010."
Significant Ocean Heating Below 700 Meters
This harkens back to some of the discussions between Skeptical Science and Roger Pielke Sr., who rightly noted that we cannot adequately measure global warming by considering surface temperatures alone, as most of the global heating has accumulated in the oceans. However, we noted at the time that Dr. Pielke was only considering the heating of the upper 700 meter ocean layer, which is also an incomplete measure of global warming. Levitus et al. confirm this by noting that in the upper 2000 meters, approximately one-third of the total heating has occurred below 700 meters.
Dr. Pielke had argued based on the 700 meter OHC data that global warming had slowed. Levitus et al. note this leveling off in the upper 700 meters in recent years, but that this recent flattening is much less apparent in the 2000 meter data, meaning that more heat is being stored in the 700-2000 meter layer recently (Figure 2).
"One feature of our results is that the previous multidecadal increase in OHC700 that we have reported [Levitus et al., 2009] (updated estimates available online at www.nodc.noaa.gov) leveled off during the past several years. This leveling is not as pronounced in our OHC2000 estimates indicating that heat is being stored in the 700-2000m layer as we have shown here."
Consistent with Meehl's Hiatus Periods
Meehl et al. (2011) examined what climate models predict will happen during 'hiatus' decades in which surface temperatures plateau for short periods of time. They found that during these hiatus decades, less heat accumulates in the upper layers of the ocean, and more accumulates in the deeper layers (Figure 3).
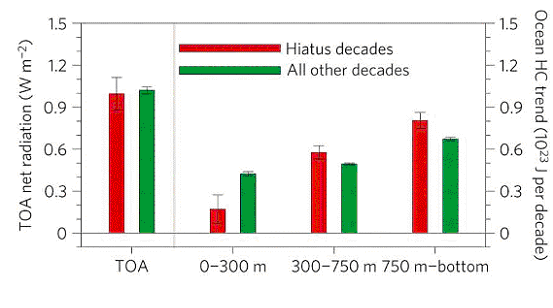
Figure 3: Left: composite global linear trends for hiatus decades (red bars) and all other decades (green bars) for top of the atmosphere (TOA) net radiation (positive values denote net energy entering the system). Right: global ocean heat-content (HC) decadal trends (1023 J per decade) for the upper ocean (surface to 300 m) and two deeper ocean layers (300–750m and 750 m–bottom), with error bars defined as +/- one standard error x1.86 to be consistent with a 5% significance level from a one-sided Student t-test. From Meehl et al. (2011)
The Meehl model results are exactly what Levitus find is happening. We are in the midst of a hiatus decade where global surface warming has been dampened, the increase of the upper OHC has slowed, but more heat is going into the deeper ocean layers.
Putting Ocean Heating Into Perspective
The amount of global warming which has gone into the oceans over the past 55 years is quite impressive.
"The global linear trend of OHC2000 is 0.43x10²² J yr-1 for 1955-2010 which corresponds to a total increase in heat content of 24.0±1.9x10²² J"
This is an immense amount of energy being added to the oceans which Levitus et al. put into perspective (emphasis added):
"We have estimated an increase of 24x1022 J representing a volume mean warming of 0.09°C of the 0-2000m layer of the World Ocean. If this heat were instantly transferred to the lower 10 km of the global atmosphere it would result in a volume mean warming of this atmospheric layer by approximately 36°C (65°F)."
Levitus et al. note that of course this heat won't be instantly transferred to the atmosphere (fortunately!), and that this comparison is simply intended to illustrate the immense amount of energy being stored by the oceans.
This heating amounts to 136 trillion Joules per second (Watts), which as Glenn Tramblyn noted in a previous post, is the equivalent of more than two Hiroshima "Little Boy" atomic bomb detonations per second, every second over a 55-year period. And Levitus et al. note that this immense ocean heating has not slowed in recent years - more of it has simply gone into the deeper ocean layers.
Spoiler Alert
Coincidentally, a team led by several Skeptical Science contributors recently submitted a paper for review which uses this NODC OHC data from Levitus et al. and comes to many of the same conclusions regarding continued global warming. With any luck, the paper will be published in a few months and we'll have more to say on the subject at that time. In the meantime, Levitus et al. have once again reminded us that although the surface warming may have been dampened in recent years, global warming hasn't magically vanished, and that heat stored in the oceans will eventually come back to haunt us.


I have a question about ocean warming – how is that possible from increased CO2? From my understanding, increased CO2 reduces IR flux to space and the back IR radiation warms the surface and troposphere. Since water completely absorbs any IR within the first few centimeters, how can IR from CO2 heat the ocean at any meaningful depth?
Second, how can ocean temperature be measured to determine this? Assuming 2.5e23 extra joules (based on the chart of this thread) are dumped into the ocean from 1960 to today from 0 to 2000 meters of depth. Using 60% of the earth surface that has water to 2000m, I compute this is roughly 6.12e17 cubic meters of water, or 6.12e26 cubic centimeters, or 6.12e26 grams of water. Using 4.18 J/g/C for water I compute that 2.5e23 joules would heat this volume of the ocean only 0.0001 deg C, which has to be immeasurable. So, how have they figured out the ocean has warmed this miniscule amount? It doesn’t seem possible to make a direct measurement.
Third, assuming all this energy passed through the ocean surface, I compute that this is approximately 0.4 W/m^2 increased energy into the ocean. Again, I am only assuming 60% of the earth has water to 2000 meters, so this is about 3.06e14 square meters. 2.5e23 joules / 3.06e14 meters is 8.17e8 extra joules per square meter over 53 years. Divide that by the number of seconds in 53 years (~1.7e9 seconds) and I get 0.4 W/m^2 for the last 53 years. That doesn’t sound that impressive given the reduced IR flux due to CO2 is on the order of 1 W/m^2 over this same time period. Or, this could mean that 40% of the IR back radiation from CO2 is absorbed by the ocean, but how, given that IR doesn’t penetrate water?
Stealth, what JasonB said, and it was not meant to be demeaning. Your overall response moved the DK spectre well back into the forest.
As for thermal infrared warming the ocean, the ocean's thermal gradient starts at the skin of the ocean. That's one answer. SoD has more on this, and I think there's an SkS thread somewhere on it. The circumstantial evidence for this is enormous, but the actual physsical mechanism is not well-described or, perhaps more accurately, not well-observed (for obvious reasons).
Stealth @28:
1) "Heat" is an active verb. The better term is "warm". The increased IR back radiation slows the cooling of the ocean by slowing the rate at which heat from below the first few millimeters comes to the surface. So, the Sun heats the ocean, but it heats it more because of the warming effect of the back radiation makes the ocean's cooling less efficient. (This is exactly analogous to the way CO2 "warms" the Earth.) Science of Doom has an excellent series of posts covering, and demonstrating the physics, if you want a more technical explanation. The starting point is "Does back radiation heat the ocean part 1".
2) You misplaced a decimal point. There are one million (100^3) cubic centimeters in a cubic meter, not one billion. Ergo there are 6.12x10^(17+6) cubic centimeters in the first 2000 meters of the ocean. Hence the average temperature increase is 0.1 C over the period. Note that the increase near the surface is significantly larger, with most of the warming being in the first 700 meters. Consequently, while the error is quite large, the measurement is statistically significant.
3) The TOA energy imbalance equals on average total forcing from all factors since 1750 (by convention) minus the increase radiation to space due to increased surface temperature. On top of that there are year to year fluctuation due to short term changes in humidity, cloud cover, surface temperature and change in temperature distribution which can be ignored for this discussion. Current climate models estimate that TOA imbalance to be 0.47 W/m^2 for the mean value between 2000-2010 inclusive (see figure 2a of Stevens et al). The TOA energy imbalance as measured by the 0-2000 meter change in OHC over the same period is 0.57 +/-0.4 W/m^2 (90% confidence interval). The 0-2000 meter OHC underestimates total TOA imbalance because, of course, there is additional warming at greater depths, heat used to melt ice, and heat used to warm land and atmosphere. That figure is greater than your estimate solely because the TOA energy imbalance was much smaller in the mid-twentieth century, and has been increasing since then.
I would second the SoD articles (and see the followup on the cool skin also). This is all the nitty-gritty textbook stuff that SoD does so well. For detail on the ocean measurement system and its limits, then I guess start with Von Schuckmann and La Treon.
Check you math. I get 6.12e17m3 of water give 6.12e20 kg (density at 1000kg/m3) and 6.12e23g (actually more like 7.23e23g using more accurate estimate of ocean area).
Tom Curtis @30: You’re everywhere on this site, yes? And I like your answers. They have the most detail and explanation. What is your background?
TC @30.1: I need to read your link to see what it says.
TC @30.2: Doh! My Homer Simpson moment. I triple checked my math as not to embarrass myself, but I computed cubic millimeters instead of centimeters. Still embarrassed myself, though. But it’s not like I mixed up English and metric units and crashed a probe into Mars. :-) Okay, I easily believe they can measure 0.1 C.
TC @ 30.2: I find the warming in the first 700m interesting as some light colors (mostly blue at 490nm) penetrate fairly deep (but not 700m). The average ocean surface temperature is about 22C and the average surface air temperature is 15C, so the ocean surface is much warmer than the air. If the air warms to 16C from CO2, then this would reduce the thermal gradient from the ocean to the air, reducing the cooling from the ocean. The question though, is this enough to warm the oceans this amount? Another explanation is that the oceans have been warmed by more light from reduced cloud cover – perhaps? The more sun light that hits the ocean the more energy that penetrates deep to warm the top 700m. It seems hard to figure out the components of ocean warming – is it more light from reduced clouds, or reduced cooling due to a warmer? If you assume the amount of solar energy hitting the ocean is constant (it can’t be because that would require clouds to be constant) then it all has to be reduced cooling due to reduce ocean/air thermal gradient. Perhaps your link above discusses this.
TC @ 30.3: “Energy balance”. I still want to see the numbers and discuss this. I think this is closely related to my above point about what is warming the oceans.
Stealth - The relevant SkS thread for ocean heating is How Increasing Carbon Dioxide Heats The Ocean.
Long story short: the surface of the oceans have a viscous skin layer where surface tension out-matches turbulence/convection, thermal energy from SW sunlight must pass through that layer via conduction to get to the atmosphere, downwelling IR reduces the thermal gradient and hence rate of energy lost to the atmosphere - all in the last fraction of a millimeter. This has been directly and experimentally confirmed. Further discussion of that particular topic should go to that thread.
As to how fractions of a degree are measured, I would strongly suggest looking at the Central Limit Theorem and the reduction of errors and deviations with large sample numbers. This is a core element of sampling theory - the size of sampling error is inversely related to the sampling size. If you don't understand that, you just don't understand sampling statistics. And direct measurements of temperature are quite straightforward, whether done with the ARGO system, XBTs. or even just thermometers on ropes.
---
I've noticed that your posts are, quite frankly, skipping around quite a bit - jumping from topic to topic. In the process, it is not entirely clear whether your questions have indeed been answered - just that you've moved on to yet another question.
I would suggest you read through some of the summaries on the topic of the greenhouse effect, and the anthropogenic influences upon it - such as Spencer Weart's excellent Discovery of Global Warming site, in particular the Carbon Dioxide Greenhouse Effect. I believe a good overview will answer a great many of your questions up front, and provide more of a framework for the discussions you have been in.
Stealth, regulars here use the "comments" tab to see new comments made anywhere on the site. This makes it possible to have all comment threads open while also keeping comment threads on topic.
KR @33: I was questioning the ability to measure 1/10,000th of a degree. I made a math error and was off by 3 orders of magnitude -- the actual temperature change is 0.1 degrees, and I can easily see that as measureable. While I make no claims to be a statistician, I do understand the Central Limit Theorem, and I understand the difference between precision and accuracy.
I am posting and asking questions from topic to topic because questions have to stay on topic or the moderator will delete them. I have a method to my madness and I am mostly gathering data. I have to find the right thread to ask my questions to get specific data. And my questions are being answered and I have learned a little bit all ready. Many thanks to all, especially Tom Curtis!
Wattsup has a blog post about this wherein he claims:
"The nice thing about the ocean is that the temperature and heat content are mathematically related by the fact that it takes about 4 megajoules to warm a tonne of water by 1°C. This lets us convert from heat content to temperature and back as needed.
Remember that the three layers have very different volumes. So a terajoule of energy added to the shallow 0-100 metre layer will warm it more than the same terajoule of energy added to the more voluminous 700-2000 metre layer. Fortunately, NOAA also provided the ocean depths on a 1° x 1° grid, so we can calculate the volume of each of the layers. Once we know the volumes, we can calculate the temperature changes. Figure 4 shows the same data as in Figure 3, except expressed as a temperature change rather than as a change in heat content."
http://wattsupwiththat.com/2013/05/10/the-layers-of-meaning-in-levitus/
Comments on that?
dvaytw - Aside from the (unsupported) aspersions on OHC data at the end, that post really doesn't say anything new. The oceans have a vertical temperature profile, they have accumulated huge amounts of energy over the last half-century of measurements, that translates into different amounts of warming over the vertical ocean profile.
While the temperature changes he plots are interesting, the raw temperature data is already available on the very same site he got the OHC information from - and by reversing to degrees C he's thrown away (cancelled out) the volume and total energy values of interest.
Overall, that post contains nothing much of interest. Far more informative to read the original Levitus 2012.
dvaytw @36.
Is there anything specific that bothers you. My main take-away from that Wattsupian post is that the author is a total idiot. 45+100+60. That's a lot smaller than 205. An' it ain't CO2 wot dun it, neever!! Then such arrant stupidity is quite a common on that planet.
MA Rodger - Oh my, I missed that throwaway line the first time through. Eschenbach (somehow) dismisses CO2 in a sentence completely unrelated to anything else in the blog post, with no supporting evidence whatsoever.
So: a discussion that adds nothing to Levitus 2013, with unsupported aspertions on OHC data accuracy and a complete non sequitur regarding CO2 tacked on the end. I believe that sums up that Eschenbach post - in my opinion it's not worth the time to read.
Thanks for the feedback guys and this again just shows these discussions are over my head and sadly it often falls to guys like me to argue with guys equally as clueless about these topics! But that's just how it goes, so as always I appreciate your feedback.
Now to double check, if I understand what you're saying, it is that in fact temperature isn't the relevant criterium here, so Eschenbach's chart showing ocean floor temperatures as flat is irrelevant? Is there an easy way for you to explain to me why this is so?
dvaytw - There are some interesting graphical tricks in that post, such as plotting the layers energy changes as separate overlaid plots rather than as a cumulative sum as in the opening Levitus graph. That minimizes apparent visual extent and changes.
The last graph, temperatures of layers with different thicknesses, is particularly misleading - the large rise in surface temperature (very little energy involved) shown over the deep layer temperature changes (a huge amount of energy) is a case of apples/oranges. Energy is the proper comparison. In an energy consideration to be consistent with the 0-100m layer depiction the 100-700m line should be 6x larger, the 700-2000m line 13x larger, and SST has no place whatsoever in an energy comparison without a specified layer thickness and thermal mass.
Regardless - temperatures are not flat, not even on Eschenbachs misleading chart. Energy is the relevant criteria, all observed layers are accumulating energy at a rate near 0.5-0.6 W/m2 globally over the last 50 years, and that imbalance is warming the entire climate.
PS my opponent in the discussions response to your critiques was the following:
"Total energy values are of interest to him because it shows the deep ocean is "warming," when it isn't warming. Warming has only to do with temperatures. He may be interested in this because he thinks more energy is somehow transferred to the bottom of the ocean even though it isn't really warming it because there is so much volume there. But Watt's argument is that El Nino and La Nina events are constantly charging and discharging waters, they are moving around, so volume has little to do with it. For example, if water is being warmed on the surface, and then that warmer water is moved down to the deep ocean due to trade winds during La Nina, changing equations to volume and total energy is unnecessary."
That's the equivalent of a 3 years old covering his eyes in an attempt to make what he sees go away. Seriously, I would advise staying away from the buffoonery that masquerades as reasoning at Watts' site. Any time spent on that pile of nonsense is wasted.
dvaytw - Energy is the central issue, energy drives the temperatures.
"Warming has only to do with temperatures" - Incomplete, warming has to do with temperatures, and volumes, and thermal mass.
Increasing greenhouse gases cause a top of the atmosphere (TOA) imbalance in energy, which can only be rebalanced (preserving the first law of thermodynamics) by the climate warming, and radiating enough additional IR to balance what energy is coming in. The energy going into the oceans (~5x10²² Joules per decade over the last 50 years) is a measure of that imbalance and energy accumulation.
Additional energy will accumulate until the climate warms enough to rebalance at TOA. The increasing ocean heat content (OHC) is the spin-up of the climate flywheel. Temperatures of deep ocean constrain, over the long run, surface temperatures. Both are rising; your opponent should be concerned. See this post, show him those graphs.
dvaytw @42.
In the quote you present it says that somebody "thinks more energy is somehow transferred to the bottom of the ocean even though it isn't really warming it because there is so much volume there." Given the subject here is the 700-2000m layer (I assume, it being the deepest discussed in the Wattsupia link), that somebody's thinking would be at least partially correct. At present there is more OHC accumulating 700-2000m than there is 0-700m. The "so much more volume there" is only about 50% more and the "more energy" has since 2005 been not far short of being 50% more. Looking at the numbers, 0-700m OHC 2005ave - 2012ave OHC = 25.3ZJ. 700-2000m 34.9ZJ putting the average temperature increase 700-2000m at 92% of the 0-700m increase.
Of course the devilish mathematics practised by these denialist types is a good match for their devilish physics where there is "warming" which is irrelevant and proper warming which is very relevant. So it isn't impossible that the 92% is somehow the wrong sort of %.
KR and MA Rodger thanks for the feedback.
I actually relayed KR's response directly and he said some stuff back. I feel silly copying back and forth, but if anyone's interested, the debate is here:
http://www.forumosa.com/taiwan/viewtopic.php?f=86&t=120785&start=250
He and I get into it about ocean heat content on page 25 (if you want to comment, I think you can do so as a guest poster.)
Most of what he said suggests to me he doesn't really understand what KR said, but I would like to ask about this one thing:
"Of course we all know that the sun's radiation has effect on the oceans, especially on the top layers. To count the energy on the top layers and combine it with the energy rise in the deep ocean, which they hope is caused by greenhouse gases, is deceptive.
The radiation caused by greenhouse gases, on the other hand, is very shallow and only hits the surface, compared to that of the sun, which goes in deeper. What they often forget is that surface water evaporates. Greenhouse radiation will only increase that evaporation, carrying away that precious energy back into the sky."
That bit about deep and shallow penetrating radiation... is there any truth to that?
dvaytw - See How Increasing Carbon Dioxide Heats The Ocean, or the RealClimate Why greenhouse gases heat the ocean posts.
Long story short - IR gets absorbed in the first millimeter or so of water, visible light penetrates a few meters. But that surface layer, with surface tension, is relatively stable (not turbulent), heat from solar warming has to go through the skin layer by relatively inefficient thermal conduction, not mixing or radiation, and the downward IR from the atmosphere reduces the thermal gradient across that last millimeter and hence the ability of the oceans to lose energy. Conduction is a function of thermal conductivity and of gradient; IR decreases the gradient and slows cooling.
Hence the oceans gain energy until the increased temperature of the ocean re-establishes a thermal gradient across that skin layer once again sufficient for the oceans to lose as much energy as they gain from the sun - warmer waters.
I will note that this surface layer effect is experimentally confirmed.
dvaytw:
Nobody "forgets" evaporation. Nobody ignores thermal loss to the atmosphere, either. Everyone looks at the enire energy balance in their models/analysis:
- absorption of solar radiation (can penetrate metres, as pointed out)
- reflection of solar radiation (energy that arrives at the surface, but immediately is lost again)
- absorption of IR radiation (a few mm)
- emission of IR radiation
- evaporation (an energy transfer to the atmosphere, due to the latent heat of evaporation)
- thermal transfer to the atmosphere (driven by turbulent mixing in the atmosphere)
- and finally, thermal transfer ito the ocean (conduction, turbulent mixing, etc.)
None of these exists in isolation. Change one, and all are likely to change in response. Increase the downward IR absorbed at the surface, and the energy has to go somewhere. If the water surface temperature increases, then the likely response is that emitted IR will increase, thermal losses to the atmosphere will increase, and thermal transfer into the ocean will increase as well.
Your "opponent" is suffering from Single Factor Syndrome, where he/she thinks that compartmentalizing your thinking to look at only a small part of the picture means that the rest doesn't matter. The statement "Greenhouse radiation will only increase that evaporation" is just simply wrong. The word "only" is the warning flag: as soon as someone thinks that there is only one factor in climate, they are mostly likely talking through their hat.
dvaytw - I took a look at your discussion, and have some comments.
If your friend wants to discuss science, he's welcome to read or engage in topics on SkS, or RealClimate, where points are best backed by published peer-reviewed science and data. Rather than WUWT, where bloggers toss off the random and (a critical point here) contradictory objections of the day, and the wildest unsupportable hypotheses hold sway.
dvaytw @46.
Courtesy of SkS, some light reading for you or your 'friend'. How Increasing CO2 Heats the Ocean.