


 Arguments


9 Months After McLean
Posted on 25 October 2011 by dana1981
 In our previous post, The Day After McLean, we examined the 2011 global surface temperature prediction made by data analyst and climate "skeptic" John McLean. McLean's prediction was rather extreme, calling for the 2011 temperature anomaly to return to (or below) 1956 levels:
"it is likely that 2011 will be the coolest year since 1956 or even earlier"
To be blunt, this was an unwise and uninformed prediction. For example, Figure 1 shows the monthly global surface temperature anomalies (from NOAA NCDC, whose accuracy the BEST project has confirmed) for the past decade (2001-2011) and for 1956.
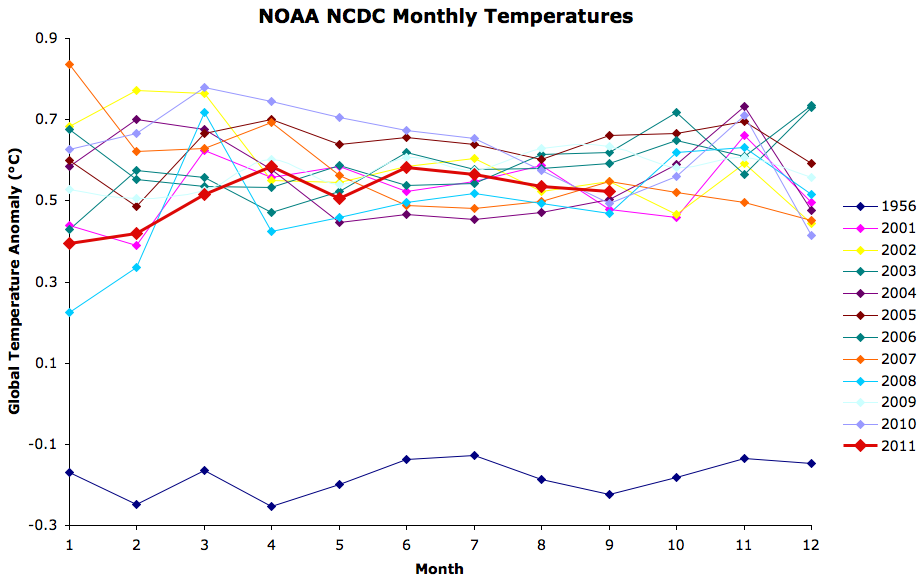
Figure 1: NOAA NCDC monthly temperature anomalies
Every single month over the past decade has been at least 0.35°C warmer than the hottest month in 1956. And not surprisingly, every month in 2011 has been much warmer than the hottest month in 1956 as well, by 0.52 to 0.71°C through September. The annual data tells a similar story (Figure 2).
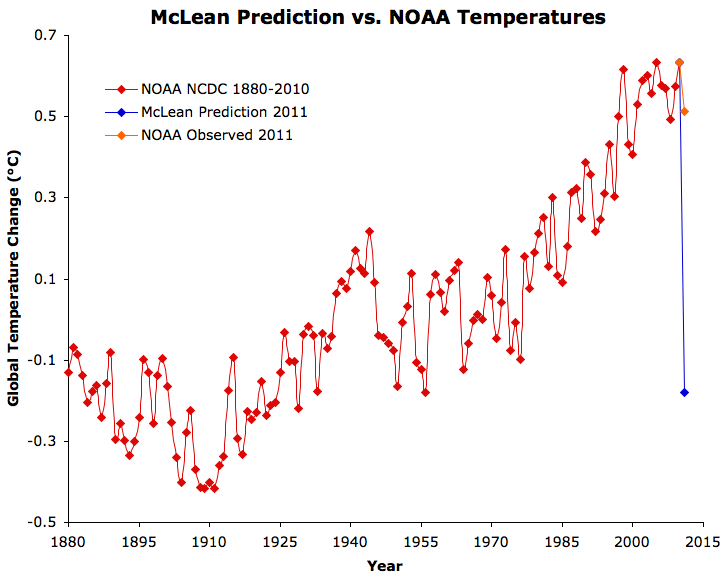
Figure 2: McLean 2011 prediction vs. NOAA annual global surface temperature anomalies, including 2011 anomaly through September.
As we discussed in The Day After McLean, average surface temperatures simply don't change from one year to the next by anywhere near the magnitude McLean predicted. The largest year-to-year temperature change from 1880 to 2010 according to NOAA data was 0.26°C (1963 to 1964). The average annual change was 0.078°C. McLean has predicted a 0.81°C cooling from 2010 to 2011 - more than 10 times the average change, and more than 3 times the largest year-to-year change on record.
Standing Behind Wrongness
Halfway through 2011 the NOAA global surface temperature anomaly was 0.50°C, on track to be 0.63°C hotter than McLean had predicted. I encountered McLean commenting on an article on the Australian website The Conversation, which publishes articles written by academics and researchers. I confronted McLean with his prediction and the fact that the planet was not on its way to freezing over, to see if he would admit his error. On the contrary, McLean stood behind his initial prediction:
"Last time I looked 2011 wasn't over yet. It's a bit premature of you to be crowing about an annual average when the year isn't complete."
Seeing an opportunity to cash in on his false bravado, I offered him a wager. If McLean’s prediction were wrong by less than half a degree Celsius at the end of 2011, he would win. If it winds up being incorrect by a least half a degree Celsius, I would win. Given that the average global surface temperature has not changed by more than 0.26°C from one year to the next, I thought that giving him a 0.5°C margin of error was a generous offer, but alas, McLean did not respond to my offer.
Figure 3 shows an example of how temperatures in the second half of 2011 would have had to change in order for McLean's prediction to be accurate at that point, and how they will have to change over the last 3 months.
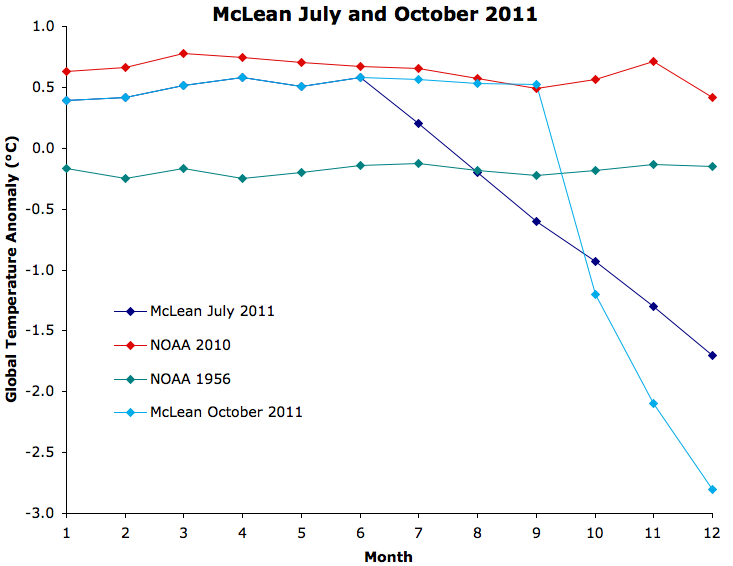
Figure 3: Example of how the average global surface temperature would have had to change in the second half and third quarter of the year for McLean's 2011 temperature prediction to become accurate.
Such a radical temperature change would literally send us towards a new ice age, and yet McLean refused to admit in July 2011 that his prediction was wrong.
Basis for McLean's Wrong Prediction
So what possessed McLean to make such a radical prediction to begin with? The basis of the prediction was a paper we have previously examined, McLean et. al (2009). In their paper, McLean et al. found that the El Niño Southern Oscillation (ENSO) has a large influence on global temperature variability (i.e. short-term changes), but they also slipped a conclusion into their paper which was not supported by their research:
"Overall the results suggest that the Southern Oscillation exercises a consistently dominant influence on mean global temperature"
This claim is simply incorrect, and could not be supported by their research, because the first step in the McLean et al. analysis removed any long-term trends from the original temperature data. Thus their analysis was incapable of determining the dominant influences on long-term temperature changes. Although Foster et. al (2010) made this point, McLean apparently continues to believe that ENSO is the dominant driver behind global temperature changes. However, ENSO is an oceanic cycle which merely moves heat around between oceans and the surface, and thus cannot cause a long-term warming trend.
The failure of McLean’s prediction proves that the conclusion of his paper was wrong. 2011 has indeed been slightly cooler than 2010 because the former was influenced by a La Niña cycle, while the latter was influenced by an El Niño. However the difference between 2010 and 2011 has only been 0.12°C thus far, nowhere near McLean's predicted 0.81°C, because man-made global warming hasn’t disappeared, and ENSO (and other ocean cycles) aren’t really the dominant effect on global temperatures. They certainly have large short-term effects on temperatures on the order of a couple of tenths of a degree, but nowhere near as large as McLean seems to believe.
We contacted McLean for a comment on this post, and his only response was to say
"I'll be posting a comment on my web pages after the December data is available."
It will be interesting to see how he defends this ill-conceived prediction.


[DB] Perhaps that is due to the multiple (here, here and here) takedowns Tamino has performed on Tisdale.
[DB] "The UAH charts you have produced, DB, are exactly the same as the data I used for my regressions."
Care to point out where I used these supposed UAH charts? Perhaps I've forgotten what I've posted (after all, you've been wrong on so many things so far, I'd hate for this to be another).
"We are (or I am, if you prefer) looking for evidence of AGW in the mid-troposhere to support the “higher is colder” theory"
Yes, that would be "you". GHG, and their attendant warming observed typically produce tropospheric warming and stratospheric cooling, matching observations.
"The most obvious test would be to compare the two sets of data over the period 1979 to 1997."
Cherry-pick. Less than 20 years of data while ignoring the much larger datasets we have.
"no temperature change over a period of 19 years"
More cherries/IBID. Tiresome, very tiresome.
As for the rest, you waste all of our time. Unless you can contribute something positive to this dialogue other than regurgitated PRATT, your comments will cease to appear.
Please note that posting comments here at SkS is a privilege, not a right. This privilege can and will be rescinded if the posting individual continues to treat adherence to the Comments Policy as optional, rather than the mandatory condition of participating in this online forum.
Moderating this site is a tiresome chore, particularly when commentators repeatedly submit off-topic posts or intentionally misleading comments and graphics or simply make things up. We really appreciate people's cooperation in abiding by the Comments Policy, which is largely responsible for the quality of this site.
Finally, please understand that moderation policies are not open for discussion. If you find yourself incapable of abiding by these common set of rules that everyone else observes, then a change of venues is in the offing.
Please take the time to review the policy and ensure future comments are in full compliance with it. Thanks for your understanding and compliance in this matter, as no further warnings shall be given.
Can I suggest, as a valedictory comment, that you go to "Global Warming at a Glance, transfer to Hadley Centres new radiosonde product, and click onto the Met Office "frequently used plots and graphics". Look at the Global Lower Stratospheric Anomalies from 1958 to 2010. Certainly there is cooling from 1958 to 1992, before the surface and atmospheric warming periods, of about 2 degrees C per century. Are we to disregard the obstinately flat period thereafter? Finally, look at the "more images updated in near real-time", and click on the "Global and tropical trends" plot, full size png. The blue line is the trend at all altitudes from 1958 to 1978, all negative (cooling). The red and black are the trends, positive at just over 1 degree per century, which depend on the (relatively) sharp increases from 1999 to 2001. So I ask again. Does this data give any support to a TOA theory of AGW, caused by the exponentially increasing CO2 levels?[DB] Off-topic struck out. And, for the record, you have studiously avoided answering my question to you in my response to your previous comment.