Climate Science Glossary

Term Lookup

Enter a term in the search box to find its definition.

Settings

Use the controls in the far right panel to increase or decrease the number of terms automatically displayed (or to completely turn that feature off).

Term Lookup

Settings


All IPCC definitions taken from Climate Change 2007: The Physical Science Basis. Working Group I Contribution to the Fourth Assessment Report of the Intergovernmental Panel on Climate Change, Annex I, Glossary, pp. 941-954. Cambridge University Press.

Home Arguments Software Resources Comments The Consensus Project Translations About Support

Twitter Facebook YouTube Mastodon MeWe

RSS Posts RSS Comments Email Subscribe


Climate's changed before
It's the sun
It's not bad
There is no consensus
It's cooling
Models are unreliable
Temp record is unreliable
Animals and plants can adapt
It hasn't warmed since 1998
Antarctica is gaining ice
View All Arguments...


Username
Password
New? Register here
Forgot your password?

Latest Posts

Archives

A Comprehensive Review of the Causes of Global Warming

Posted on 20 January 2012 by dana1981

At Skeptical Science, we have examined several recent studies which have used a number of diverse approaches to tease out the contributions of various natural and human effects to global warming.  Here we will review the results of these various studies, and a few others which we have not previously examined, to see what the scientific literature and data have to say about exactly what is causing global warming.

All of these studies, using a wide range of independent methods, provide multiple lines of evidence that humans are the dominant cause of global warming over the past century, and especially over the past 50 to 65 years (Figure 1).

HvA 50 years

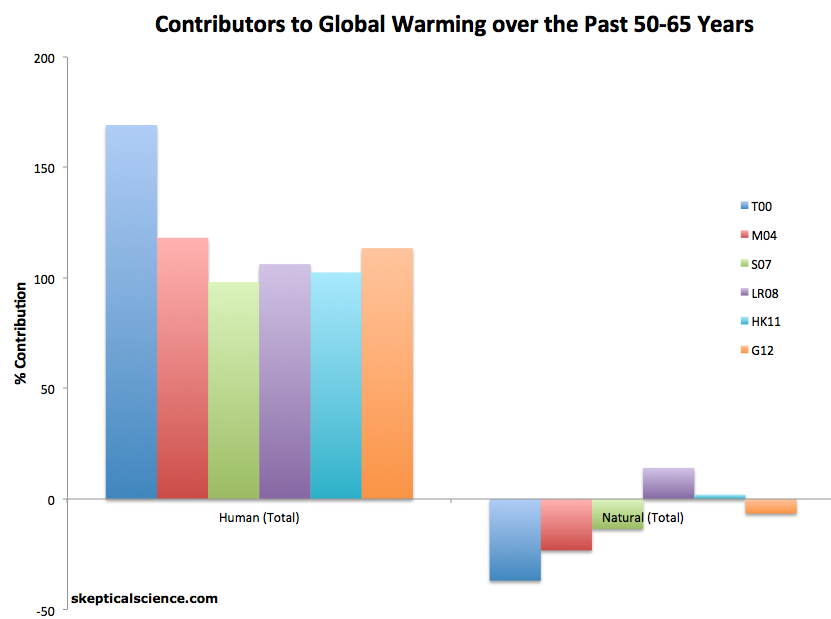
Figure 1: Net human and natural percent contributions to the observed global surface warming over the past 50-65 years according to Tett et al. 2000 (T00, dark blue), Meehl et al. 2004 (M04, red), Stone et al. 2007 (S07, green), Lean and Rind 2008 (LR08, purple), Huber and Knutti 2011 (HK11, light blue), and Gillett et al. 2012 (G12, orange).  This has been added to the SkS Climate Graphics Page.

Note that the numbers provided in this summary post are best estimates from each paper.  For the sake of simplicity we have not included error bars, but we have provided links to the original research for those who would like to see the uncertainty ranges in each estimate.

A Quick Look at the Various Effects on Global Temperature

Most of the studies discussed below looked at the same few influences on global temperature, because they are the dominant effects.

As we know, human greenhouse gas (GHG) emissions warm the planet by increasing the abundance of greenhouse gases in the atmosphere, thus increasing the greenhouse effect.

Solar activity also warms or cools the planet by increasing or decreasing the amount of radiation reaching the Earth's atmosphere and surface.

Volcanic activity generally cools the planet over short timeframes by releasing sulfate aerosols into the atmosphere, which block sunlight and reduce the amout of solar radiation reaching the surface.  However, unlike many greenhouse gases, aerosols are washed out of the atmosphere quickly, mostly after just 1-2 years.  Thus the main volcanic impact on long-term temperature changes occur when there is an extended period of particularly high or low volcanic activity.

Human aerosol emissions (primarily sulfur dioxide [SO2]) also tend to cool the planet.  The main difference is that unlike volcanoes, humans are constantly pumping large quantities of aerosols in the atmosphere by burning fossil fuels and biomatter.  This allows human aerosol emissions to have a long-term impact on temperatures, as long as we keep burning these fuels.  However, because aerosols have a number of different effects (including directly by blocking sunlight, and indirectly by seeding clouds, which both block sunlight and increase the greenhouse effect), the magnitude of their cooling effect is one of the biggest remaining uncertainties in climate science.

The El Niño Southern Oscillation (ENSO) is an oceanic cycle which alternates between El Niño and La Niña phases.  El Niño tends to shift heat from the oceans to the air, causing surface warming (but ocean cooling), whereas La Niña acts in the opposite manner.  As we'll see, a few studies have begun examining whether ENSO has had a long-term impact on global surface temperatures.  Because it's a cycle/oscillation, it tends to have little impact on long-term temperature changes, with the effects of La Niña cancelling out those of El Niño.

There are other effects, but GHGs and SO2 are the two largest human influences, and solar and volcanic activity and ENSO are the dominant natural influences on global temperature.  Now let's see what the scientific literature has to say about the relative influences of each effect.

Tett et al. (2000)

Tett et al. (2000) used an "optimal detection methodology" with global climate model simulations to try and match the observational data.  The inputs into the model included measurements of GHGs in the atmosphere, aerosols from volcanic eruptions, solar irradiance, human aerosol emissions, and atmospheric ozone changes (ozone is another greenhouse gas).

Tett et al. applied their model to global surface temperatures from 1897 to 1997.  Their best estimate matched the overall global warming during this period very well; however, it underestimated the warming from 1897 to 1947, and overestimated the warming from 1947 to 1997.  For this reason, during the most recent 50 year period in their study (shown in dark blue in Figure 1), the sum of their natural and human global warming contributions is larger than 100%, since their model shows more warming than observed over that period.  Over both the 50 and 100 year timeframes, Tett et al. estimated that natural factors have had a slight net cooling effect, and thus human factors have caused more than 100% of the observed global warming.

Meehl et al. (2004)

Meehl et al. 2004 used a similar approach to Tett et al., running global climate model simulations using various combinations of the different main factors which influence global temperatures (GHGs, solar activity, volcanic aerosols, human aerosols, and ozone), and comparing the results to the temperature data from 1890 to 2000.  They found that natural factors could account for most of the warming from 1910 to 1940, but simply could not account for the global warming we've experienced since the mid-20th Century.

Meehl et al. estimated that approximately 80% of the global warming from 1890 to 2000 was due to human effects.  Over the most recent 50 years in their study (1950-2000), natural effects combined for a net cooling, and thus like Tett et al., Meehl et al. concluded that human caused more than 100% of the global warming over that period.  Over the past 25 years, nearly 100% of the warming is due to humans, in their estimate.

Stone et al. (2007)

Stone et al. actually published two studies in 2007.  The first paper examined a set of 62 climate model simulation runs for the time period of 1940 to 2080 (the Dutch Meteorological Institute's "Challenge Project").  These simulations utilized measurements of GHGs, volcanic aerosols, human aerosols, and solar activity from 1940 to 2005, similar to the Tett and Meehl studies discussed above, and then used projected future emissions from the Intergovernmental Panel on Climate Change (IPCC) to project future global warming.  Whereas Tett and Meehl examined the climate response to each individual factor (and/or combinaton of factors), Stone compared these 62 climate model runs to a series of energy balance models, each representing the climate's response to a different effect.  Over the 60 year period, Stone et al. estimated that humans caused close to 100% of the observed warming, and the natural factors had a net negative effect.  As with Stott, their model did not fit the data perfectly, though they had the opposite result, underestimating the observed warming.

In their second 2007 paper, Stone et al. updated the results from their first paper by including more climate models and more up-to-date data, and examining the timeframe of 1901 to 2005.  Over that full 104-year period, Stone et al. estimated that humans and natural effects had each contributed to approximately half of the observed warming.  Greenhouse gases contributed to 100% of the observed warming, but half of that effect was offset by the cooling effect of human aerosol emissions.  They estimated that solar and volcanic activity were responsible for 37% and 13% of the warming, respectively.

Lean and Rind (2008)

Lean and Rind 2008 used more of a statistical approach than these previous studies, using a multiple linear regression analysis.  In this approach, Lean and Rind used measurements of solar, volcanic, and human influences, as well as ENSO, and statistically matched them to the observational temperature data to achieve the best fit.  Analyzing what is left over after summing the various contributions shows whether the most significant contributions are being considered.

LR08 did this over various timeframes, and found that from 1889 to 2006, humans caused nearly 80% of the observed warming, versus approximately 12% from natural effects.  As with the previous studies discussed, this doesn't add up to exactly 100% because the statistical fit is not perfect, and not every effect on global temperature was taken into consideration.  From both 1955 and 1979 to 2005, they estimated that humans have caused close to 100% of the observed warming.

Stott et al. (2010)

Stott et al. (S10) used a somewhat similar approach to LR08, but they used their statistical multiple linear regression results to constrain simulations from five different climate models.  S10 calculated regression coefficients for greenhouse gases, other human effects (dominated by aerosols), and natural effects (solar and volcanic), and estimated how much warming each caused over the 20th Century.  The average of the five models put the human contribution at 86% of the observed warming, and greenhouse gases at 138%, with a very small natural contribution.

Stott et al. also corrobarated their results by looking not only at global, but also regional climate changes by reviewing the body of scientific literature.  They note that human influences have been detected in changes in local temperatures, precipitation changes, atmospheric humidity, drought, Arctic ice decline, extreme heat events, ocean heat and salinity changes, and a number of other regional climate impacts.

Huber and Knutti (2011)

Huber and Knutti 2011 implemented a very interesting approach in their study, utilizing the principle of conservation of energy for the global energy budget to quantify the various contributions to the observed global warming from 1850 and 1950 to the 2000s.  Huber and Knutti took the estimated global heat content increase since 1850, calculated how much of the increase is due to various estimated radiative forcings, and partition the increase between increasing ocean heat content and outgoing longwave radiation.  More than 85% of the global heat uptake has gone into the oceans, so by including this data, their study is particularly robust.

Huber and Knutti estimate that since 1850 and 1950, approximately 75% and 100% of the observed global warming is due to human influences, respectively.

Foster and Rahmstorf (2011)

Foster and Rahmstorf (2011; FR11) implemented a very similar statistical approach to that in Lean and Rind (2008).  The main difference is that FR11 examined five different temperature data sets, including satellites, and only looked at the data from 1979 to 2010 (the satellite temperature record begins in 1979).  They also limited their analysis to the three main natural influences on global temperatures - solar and volcanic activity, and ENSO.  What remains once those three effects are filtered out is predominantly, but not entirely due to human effects.  For our purposes, we will classify this remainder as the human contribution, since FR11 removed the three largest natural effects.

Using the temperature data from the British Hadley Centre (which was used by LR08, and is the most frequently-used temperature data set in these studies), FR11 found that the three natural effects in their analysis exerted a small net cooling effect from 1979 to 2010, and therefore the leftover influence, which is predominantly due to human effects, is responsible for more than 100% of the oberved global warming over that timeframe.

One key aspect of this type of study is that it makes no assumptions about various possible solar effects on global temperatures.  Any solar effect (either direct or indirect) which is correlated to solar activity (i.e. solar irradiance, solar magnetic field [and thus galactic cosmic rays], ultraviolet [UV] radiation, etc.) is accounted for in the linear regression.  Both Lean and Rind and Foster and Rahmstorf found that solar activity has played a very small role in the observed global warming.

Gillett et al. (2012)

Similar to S10, Gillett et al. applied a statistical multiple linear regression approach to a climate model - the second generation Canadian Earth System Model (CanESM2).  They used data for human greenhouse gas and aerosol emissions, land use changes, solar activity, ozone, and volcanic aerosol emissions.  In their attribution they grouped some of the effects together into 'natural', 'greenhouse gas', and 'other'.  The authors estimated the effects of each over three timeframes: 1851-2010, 1951-2000, and 1961-2010.  For their attributions over the most recent 50 years, we took the average of the latter two, and used their 'other' category as an estimate for the influence of human aerosol emissions (which will result in somewhat of an underestimate, since most 'other' effects are in the warming direction).

Gillett et al. estimated that over both timeframes, humans are responsible for greater than 100% of the observed warming.

Human-Caused Global Warming Consensus

The agreement between these studies using a variety of different methods and approaches is quite remarkable.  Every study concluded that over the most recent 100-150 year period examined, humans are responsible for at least 50% of the observed warming, and most estimates put the human contribution between 75 and 90% over that period (Figure 2).  Over the most recent 25-65 years, every study put the human contribution at a minimum of 98%, and most put it at well above 100%, because natural factors have probably had a small net cooling effect over recent decades (Figures 3 and 4).

Additionally, in every study over every timeframe examined, the two largest factors influencing global temperatures were human-caused: (1) GHGs, followed by (2) human aerosol emissions.  This is a dangerous situation because as we clean our air and reduce our SO2 emissions, their cooling effect will dissipate, revealing more of the underlying GHG-caused global warming trend.  Note that not all studies broke out the effects the same way (i.e. only examining 'natural' and not solar or volcanic effects individually), which is the reason some bars appear to be missing from Figures 2 to 4.

100-150

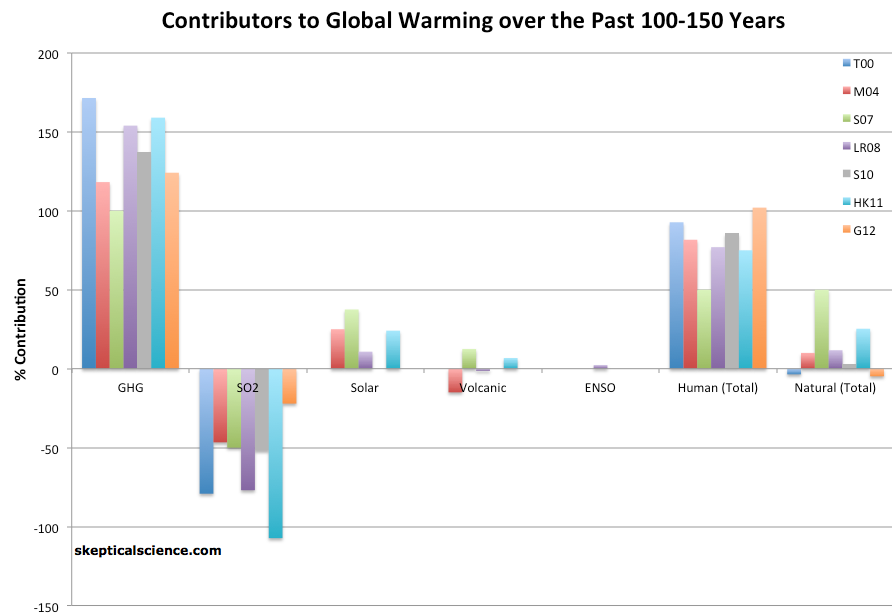
Figure 2: Percent contributions of various effects to the observed global surface warming over the past 100-150 years according to Tett et al. 2000 (T00, dark blue), Meehl et al. 2004 (M04, red), Stone et al. 2007 (S07, green), Lean and Rind 2008 (LR08, purple), Stott et al. 2010 (S10, gray), Huber and Knutti 2011 (HR11, light blue), and Gillett et al. 2012 (G12, orange).

50-65 years

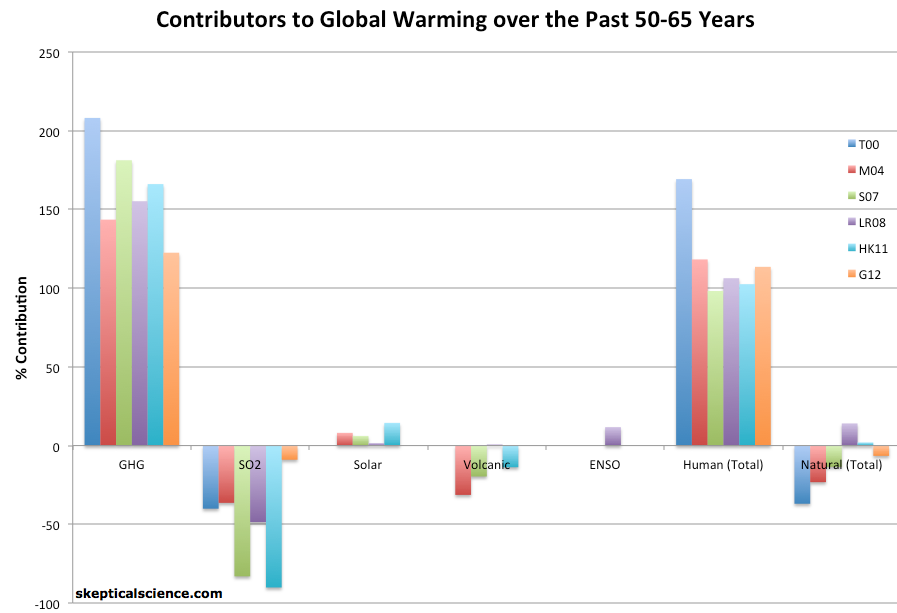
Figure 3: Percent contributions of various effects to the observed global surface warming over the past 50-65 years according to Tett et al. 2000 (T00, dark blue), Meehl et al. 2004 (M04, red), Stone et al. 2007 (S07, green), Lean and Rind 2008 (LR08, purple), Huber and Knutti 2011 (HK11, light blue), and Gillett et al. 2012 (G12, orange).

25-30

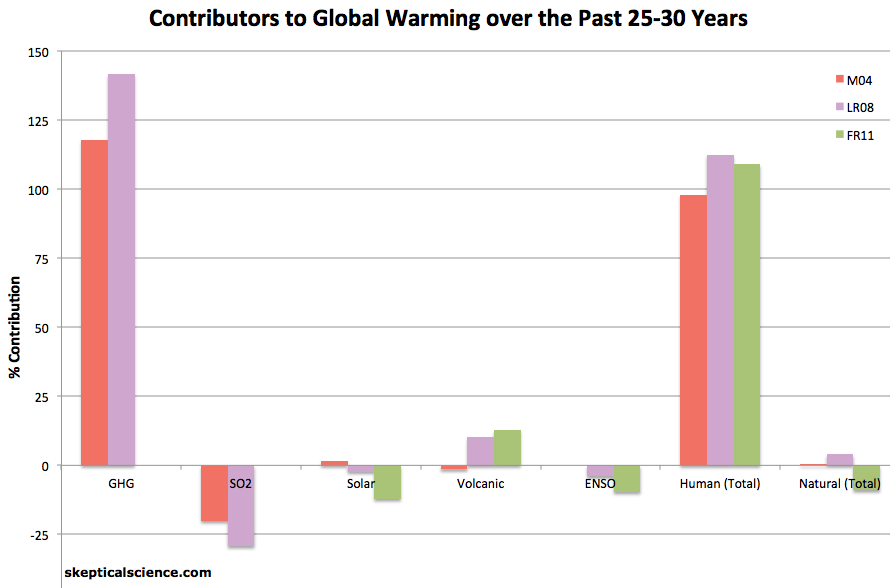
Figure 4: Percent contributions of various effects to the observed global surface warming over the past 25-30 years according to Meehl et al. 2004 (M04, red), Lean and Rind 2008 (LR08, purple), and Foster and Rahmstorf 2011 (FR11, green).

There was a period of warming between 1910 and 1940 which was predominantly caused by increasing solar activity and an extended period of low volcanic activity, with some contribution by human effects.  However, since mid-century, solar activity has been flat, there has been moderate volcanic activity, and ENSO has had little net impact on global temperatures.  All the while GHGs kept increasing, and became the dominant effect on global temperature changes, as Figures 3 and 4 illustrate.

A wide variety of statistical and physical approaches all arrived at the same conclusion: that humans are the dominant cause of the global warming over the past century, and particularly over the past 50 years.  This robust scientitic evidence is why there is a consensus amongst scientific experts that humans are the dominant cause of global warming.

Note: this post has been incorporated into the rebuttals to It's not us (Advanced), Increasing CO2 has little to no effect (Advanced), It's the sun (Intermediate and Advanced), and A drop in volcanic activity caused warming.

1 0

Printable Version  |  Link to this page

Comments

1  2  Next

Comments 1 to 50 out of 78:

  1. I am very surprised that in the summaries of each research paper you've not included any figures, nor the error ranges. This quantitative information is absolutely needed to add to the visualization provided in the charts. I can (just) understand the decision not to put the error ranges on the charts (but a high low and median chart is just as visually useful as a bar chart) but not to include any numerical data whatsoever in this piece seems to have missed out vital data. In preparing the charts you must have this data, why not share it with us - now I've got to go to the original research and hunt it out myself. Surely providing such numbers is just as important as the nice graphics. As far as I am concerned the median is of less use than the range which is by far the most important part of any scientific study.
    0 0
  2. Chinahand As they are, those graphs are easy to grasp, and therefore they're a useful means of science communication to the broader audience. I assume this is the goal of many of SkS's graphs. Feel free to hunt the original research. Please come back and tell us if you do find some relevant innacuracy. Or even make some graphs of your own: you may have some good idea on how to convey lots of scientific information in a way that's intelligible in a glance. As for Dana, thanks for doing all the work of putting this together.
    0 0
  3. Dana - at least one of the links is not set up correctly, the Tett 2000 hyperlink at the start of its section.
    0 0
    Response: [DB] Thanks for the heads-up. Updated the various Tett links to this
  4. Chinahand- I think you mean mean? In any case, as Alexandre said you can search the papers themselves, it's not like the data is being hid away from readers. The Tett 2000 data for instance was derived from figure 6, at the bottom of the linked PDF (BTW, all of the Tett links are broken it seems - one has to delete the skepticalscience leading text, before the harvard abstract part). The anthro component for 1947-97 predicts a temperature trend of 1.35˚C/century, and the observed was 0.8 - that percentage of observed is about the 170% given in the figure.
    0 0
  5. There's always a trade-off between detail and clarity. The figures are already getting cluttered, and adding more information makes them more difficult to interpret. I know most SkS readers have no problem interpreting more complex graphics, but these are the sorts of things that could potentially get spread around to a larger audience, in which case simpler graphics have much more impact. There's a phrase good communicators abide by, and is discussed at length in the Debunking Handbook - in short, K.I.S.S. As noted in the post and the comments above, the links to every paper are provided so that you can read them yourself if you want more information (thanks for fixing the link DB).
    0 0
  6. Readers, What emerges from this literature review and from the data presented in the figures, is that even given the inherent uncertainties, there is a convergence towards a relatively narrow range of values from multiple independent research papers showing that humans most contributed between 75% and 90% of the warming over the last 100-150 years, and that "over the most recent 25-65 years, every study put the human contribution at a minimum of 98%, and most put it at well above 100%". That is a significant and robust finding. That is the message that is being conveyed here and that should cause us all concern. It is also a nail in the coffin for people like Dr. Patrick Michaels who repeatedly to try and mislead Congress and the American people by trying and demonstrate that the majority of the observed warming is not attributable to the GHGs that we humans have been adding to the atmosphere. Here was Dr. Michaels' most recent (failed) attempt and Dr. Ben Santer was having none of it. Additionally, none of the six papers discussed above support the claims being made by "skeptics". When will the public finally tire of the misinformation and distortion being peddled by "skeptics" and those who deny the theory of AGW? I have.
    0 0
  7. On a note related to Albatross @7, although the "skeptics" often put forth alternative hypotheses (i.e. maybe the sun or oceanic cycles or astrological cycles or GCRs or [etc. etc.] has contributed more to global warming than we think), I did not find any attribution studies which attributed less than the vast majority of the recent warming to human effects. It's all well and good to say "maybe it's the sun", but as far as I could find, the 'skeptics' have been unable to back up their "it's not us" assertions with a robust physical and/or statistical analysis like those discussed in this post.
    0 0
  8. Dana, this is a nice review. Would it be worthwhile to try to turn it into an actual paper and publish it in the peer reviewed scientific literature? Scientific literature often is hard to interpret because it's very fragmented. This kind of reviews are the kind of thing we need, IMHO. Thanks for the hard work!
    0 0
  9. > these are the sorts of things that could potentially > get spread around to a larger audience ... > the links to every paper are provided ... That's the key. Keep the links with the pictures, preferably as part of the image since images otherwise easily get copied or linked to without the source information being included. It'd be good to see an annotated version with error bars or uncertainty ranges -- but the important fact clear from the simplified bar chart is how they fall around the 100 percent line.
    0 0
  10. dana1981 - Excellent summary. Multiple model studies using the best physics understanding available, plus multiple regressions of time-varying forcings against temperatures, all independently supporting a common conclusion of anthropogenic influences. Very very clear.
    0 0
  11. The papers all seem to make excessively confident statements about solar influences. See http://www.leif.org/research/The%20long-term%20variation%20of%20solar%20activity.pdf So if Solar influence on Climate is "on shaky ground if we don’t even know solar input" then any paper that uses “solar forcings” as a part of its analysis has very dubious value. I also read suggestions that ENSO was a cooling influence during the period from 1979 to around 2005 and this is just bizarre - http://i43.tinypic.com/33agh3c.jpg The similarity between this graph and this http://hadobs.metoffice.com/hadcrut3/diagnostics/global/nh+sh/annual.png is surely no coincidence so how can anyone suggest the influence of ENSO during the period mentioned could be anything but strongly positive?
    0 0
  12. Woody@12 - the sunspot paper clearly concludes a reduced role for solar variations. The ENSO graph needs an unobscured link - it reflects neither the cycles shown in SKS on October 10: http://www.skepticalscience.com/el-nino-southern-oscillation.htm nor the NOAA report (p.22) of Jan 17, 2012: http://www.cpc.ncep.noaa.gov/products/analysis_monitoring/lanina/enso_evolution-status-fcsts-web.pdf The Timmerman analysis and the NOAA report line up, the tinypic link ... not so much.
    0 0
  13. Zachary Shahan at Planetsave reposted Dana's article with the following introduction: “In another wonderful post on global warming, Skeptical Science conducts a comprehensive review of scientific studies on the causes of global warming.”
    0 0
  14. We learn in Science, there is progression in knowing through 1)Hypothesis, 2)Theory and 3)Law. Scientific law is the place where one can validated a claim, and after validation time and again, its agreed to get settled. I am not a Climate scientist, but I have the capability to understand science & technology of Physic, Chemistry, Mathematics, Fluid Dynamics, Thermodynamics, Heat & Mass Transfer. People who claimed to be "Subject Authority in climate science", claims there is AGW(impact of human induced co2). If I assume for a minute to be absolutely true "Like a law of Science"for a minute, then May I humble ask those who claim with 100% certainty to produce (or refer me to any scientifically validated research article) a formula which I and many others can "validate agw (impact of human induced co2)conclusively" for any point of earth's history of temperature during which we have temperature and natural (and human induced)co2 record? I expect the response must produce/pointer towards general mathematical formula that can be used without any exception T(temp at time t) = f (X1, X2, X3, . . . . . Xn)* + c, by the people who claim to be 'Authority in the Subject', claim that their claim is Conclusive. * Where X1, X2, . . . . , Xn are variables, and they may very well be multidimensional
    0 0
    Response:

    [DB] As one possessing Subject Authority in this site's Comment Policy, I must humbly ask you to both familiarize yourself with said policy and expect you to also refrain from posting in all-caps without any exceptions.

    Also, claims made must be supportable with source citations (this is a science website, after all).  Please provide a supportive cite for your assertion:

    People who claimed to be "Subject Authority in climate science", claims there is AGW(impact of human induced co2).

    Or withdraw it.

  15. Patonomics: You do not understand the basic definations of Theory and Law in science. Theories do not grow up to be laws. Laws are descriptions of a number of observations. Theories explain how things work and predict future observations. Both theories and laws can be changed if new data becomes available, but that does not happen very often. Climate is too complicated to have a simple mathematical formula to describe it. In the past the land masses were in different places, the sun was colder and many other things were different. There are explainations of all these differences but you need to search them on your own. I suggest you start with The Discovery of Global Warming by Spencer Weart. It conatins all the information you seek. If you have a less combative tone you will find people more helpful.
    0 0
    Moderator Response: [Sph] Link fixed.
  16. patonomics: The twelve part series, “Atmospheric Radiation and the ‘Greenhouse’ Effect” posted on The Science of Doom website, would be a good place for you to start. It is a 12-part series providing more explanation of how the atmosphere absorbs and emits radiation, including a simple model to provide insight. The model uses fictitious molecules pH2O and pCO2 (which have only a passing resemblance to the real molecules) to demonstrate some key points. Part Six even explains the real equations used.
    0 0
  17. I agree with patonomics, except my area of concern is modern medicine. Doctors and nurses and such expect me to believe they are able to cure and prevent certain diseases, and to suggest lifestyle changes that I should adopt in order to improve my chance of a longer, healthier life. I think that if this were true, they should be able to provide me with a general mathematical formula that can be used without any exception L(lifespan at time t) = f (X1, X2, X3, .... Xn)* + c by the people who claim to be "Authority in the Subject', claim that their claim is Conclusive. * Where X1, X2, ...., Xn are variables, and they may very well be multidimensional.
    0 0
  18. patonomics#15: "those who claim with 100% certainty" No one produces claims with 100% certainty in any science. Global warming is a prediction (or a result) based on known physics: Energy in - Energy out = energy gain -> increasing temperature. That was shown to be scientifically valid many years ago. Anything that alters the flow of energy will thus have a predictable result, which matches what we observe. By your highly artificial requirement of a 'general mathematical formula,' there are no fully complete sciences at all. So that requirement is nonsensical.
    0 0
  19. There needs to be an Internet version of the proverb: "It is better to remain silent and be thought a fool than to speak up and remove all doubt."
    0 0
  20. Patonomics, we don't learn in science about the hierarchy of certainty that you enumerated. Hypothesis, law and theory are 3 differents concepts with different functions that can not be fitted in a hierarchy of increasing certainty. A hypothesis is a key element of scientific reasoning on a particular problem, and could be described as a provisional explanation for an observed phenomenon. That provisional explanation can be tested in a variety of ways, the easiest being through its implications: if hypothesis a is correct, then it implies that its consequences x and y should be observed, are they? Another way to test it is by experimentation. A law is a stripped down, basic relationship between objects or forces that always holds true, as far as we know, under certain conditions. Newton's laws of motion and gravity are useable for all practical purposes within the Newtonian domain of application, but they are not sufficient when velocity or mass goes beyond that domain, hence the necessity of using Einstein's laws for the orbit of Mercury or GPS calculations. Laws are not always true and break down near or at the limits of their domain. A theory is a generalization, a far reaching construct explaining an aspect of the physical world for which a law is not enough. Theories put the laws together and make sense of them. They can allow to make predictions, which can be verified by observations, and that are beyond what a single law would allow to predict. All of Wien's law, Schrodinger's equation and Heisenberg's unertainty principle are necessary to Quantum Theory. The theory does not have a lower level of certainty than any one of its laws, principles, or any given underlying component. In fact, it has a rather higher level. If any of the laws I mentioned above was to be found not quite as true as we thought, it would not draw from the theory, which still remains extremely successful at predicting what we can observe. It would have to be revised, but its past sucesses would not cease to exist. By the same token, Einstein did not invalidate Newton, it simply changed its domain of application. I don't know where you received that hierarchy of certainty idea from but you should rethink it. I do know that it is an argument often touted by creationists denying Evolution. It does not correspond to the reality of how science works and it misrepresents what a scientific theory is.
    0 0
  21. RE #15 Patonomics: " a formula which I and many others can "validate agw (impact of human induced co2)conclusively" I don't have a formula, but I have an experiment you can try: Find a Infrared microscope, look at the spectrum you get then exhale across the viewing area. You will see infrared absorption by the CO2 in your breath. This experiment doesn't show GHG are exculsively to blame for warming - but it is startlingly difficult to show they are not a significant contributor.
    0 0
  22. Patonics@15 The groundwork you're looking for appears to be in section 4a of "A Survey of the Radiative Properties of Carbon Dioxide", published in 1968: http://naca.central.cranfield.ac.uk/reports/arc/cp/0981.pdf Your multi-disciplinary background suggests you'll find this easy to digest. hth.
    0 0
  23. @15 patonomics Look at the paper cited as "Evans 2006" "Measurements of the Radiative Surface Forcing of Climate" W.F.J. Evans, North West Research Associates, Bellevue, WA; and E. Puckrin Abstract: http://ams.confex.com/ams/Annual2006/techprogram/paper_100737.htm quote: "... Radiance spectra of the greenhouse radiation from the atmosphere have been measured at ground level from several Canadian sites using FTIR spectroscopy at high resolution. The forcing radiative fluxes from CFC11, CFC12, CCl4, HNO3, O3, N2O, CH4, CO and CO2 have been quantitatively determined over a range of seasons. The contributions from stratospheric ozone and tropospheric ozone are separated by our measurement techniques. A comparison between our measurements of surface forcing emission and measurements of radiative trapping absorption from the IMG satellite instrument shows reasonable agreement. The experimental fluxes are simulated well by the FASCOD3 radiation code. This code has been used to calculate the model predicted increase in surface radiative forcing since 1850 to be 2.55 W/m2. In comparison, an ensemble summary of our measurements indicates that an energy flux imbalance of 3.5 W/m2 has been created by anthropogenic emissions of greenhouse gases since 1850. This experimental data should effectively end the argument by skeptics that no experimental evidence exists for the connection between greenhouse gas increases in the atmosphere and global warming." Extended abstract: http://ams.confex.com/ams/pdfpapers/100737.pdf
    0 0
  24. More about human causes and current approaches.. Natural Gas venting – a major Global Warming Contributor ..leaking gas are the subject of a paper that Phillips, Crosson, and Ackley presented at a conference last spring sponsored by the National Oceanic and Atmospheric Administration. Their research suggests that 7 percent to 15 percent of manmade methane (the main component of natural gas) in the atmosphere comes from these urban emissions. Jan. 19, 2012 — Researchers Note Gas Emissions From Marcellus Shale and Other Sites Linked to Significant Increased Risk of Near-Term Climate Change “Shale Gas creates 40-60% more methane to the atmosphere from the natural gas industry, than conventional gas.” – Professor R. Howard Link
    0 0
  25. Re #15 & #22 Go here for a visual explanation based on heat sensitive camera, about the heat trapping properties of carbon dioxide http://www.youtube.com/watch?v=sfkLHxQe-SU&t=20m30s , starts at minute 20-21
    0 0
  26. Here is a shorter version of above video part, of the Greenhouse Effect: Carbon Dioxide, heat trapping
    0 0
  27. A typo in the text:
    Tett et al. (2000) used an "optical detection methodology".
    I believe it should say "optimal".
    0 0
  28. We learn the following about Science " Theories are more certain than hypotheses, but less certain than laws." I happen to be involved in 3D heat generating equation calculation and validation in a closed miniature atmospheric calculation in 1990 & 1991 for grain silos. I am amazed by a even 2011 publication which claims only over 34% error bound [(3.1-2.3)*100/2.3] and still claim "model is considered sufficiently accurate and reliable". Then what to expect from real earth atmosphere predictions, where closed system experimentation and observation is not feasible. There gain silo case is as follows
    The standard error of predicted versus observed headspace air and wall temperatures was in the range of 2.3°C to 5.3°C and 3.1°C to 5.5°C, respectively. The standard error of predicted versus observed headspace humidities was around 7%. The developed model is considered sufficiently accurate and reliable to predict air temperature and relative humidity at multiple locations in the headspace of a grain storage silo. What to expect when one claims to see what the scientific literature and data have to say about exactly what is causing global warming I will highly appreciate if anyone refer me to "Climate Science Laws", if there are any, for my assimilation of knowledge as I am getting hunted by close friends who claim there are ready prove & certainty about AGW but could not substantiated by any validated document so far. - If there is none, I do not want any initiative to throw any unsubstantiated articles as references (about certainty) is this regard.
    0 0
    Moderator Response:

    Grain silos are not good models of the Earth's climate system. For actual results of climate models compared to observations, see the Skeptical Science argument "Models are Unreliable." (Type that into the Search box at the top left of this page.)

  29. patonomics @29, it may be a "34% error bound", but it is an accuracy of approximately 99% (3 degree K temperature range at approximately 290 degree K). Whether that is accurate enough depends critically on the reason the temperature is being modeled.
    0 0
  30. patonomics#29: "I will highly appreciate if anyone refer me to "Climate Science Laws"" The laws you seek are no more than the laws of physics, such as Conservation of Energy, Stefan-Boltzmann, Planck's Radiation Law, Kirchoff's Law of thermal radiation, etc. Do you insist that every sub-discipline have its own unique set of laws? If so, what are the 'Laws of Quantum Mechanics'? If, by your earlier comment, we cannot capture all of quantum mechanics in a single deterministic equation, do you claim to invalidate what is often called the most successful scientific theory we have?
    0 0
  31. patanomics. Not wanting to seem to dump on you, but the idea of a few equations that encapsulate what you are looking for is rather simplistic. The function you are looking for probably has lot more aspects than that, including complex time domain relations. Why do you expect such eqns? Surely the appropriate approach it to take the findings from a wide range of scientific disciplines and combine th0em together. Rather than look for a simple set of eqns.
    0 0
  32. Patanomics, the equation you seek is called a climate model. See the climate model thread which starts with a simple equation just like you asked for!
    0 0
  33. Patonomics your repeating of the same sentence as if it was a mantra does not flatter others' perceptions of your intrinsic ability to reason on your own. The U. of Waikato's language is overly simplified and erroneously compares level of certainty of concepts that can not be put on the same scale. It is inadequate and misleads the readers into thinking that there is a hierarchy where there isn't one. Thinking critically involves scrutiny of even the sources that teach us to think. Are you always going to recite the same mantra from U.Wai?
    0 0
  34. Earth sciences taught at the University of Waikato is appalling. My youngest son just finished at Waikato (not studying Earth sciences though) and was flabbergasted at the fake-skeptic nonsense Earth sciences students were mouthing. So if Patonomics is going there I fully understand his confusion on climate science. Earth sciences at Otago or Victoria University are of a far higher standard.
    0 0
  35. I must humbly acknowledge all responses and offer personal respect to each individual (in favor and against my views as critics) individually for your kindness so far. I think I am blessed. Here I will record some of clarification which will give clarity about my views further. To respond respected Moderator’s Response at #29 : I 100% agree with you “Grain silos are not good models of the Earth's climate system.” And I never claimed that, if you read between the lines in #29. The central point to mention there was “Grain silos are simplistic and manageable and completely observable and verifiable case if one compare with climate science. And even with today’s critical skills in modeling and with super computers, still it create lots of error. Climate science is with multitude of variables and much more complex. So when simple case (Grail silos) is NOT accurate what to expect predictions accuracies in complicated science of Climate”. To respond #30 @Tom Curtis: The case I have referred is part of scientific analysis with temperature in Centigrade, and I have NOT discussed this as Scientific Jugglery, so please please give attention about what they (researchers) said and done and measured temperature in Centigrade only NOT in Kelvin, also “in that particular case” science of seed/grain has no need to be referred with base of Temperature Kelvin 0, so please stop distorting the facts. I know most of the participants in this forum are serious and they do understand you are trying to distort the facts. To respond #31 @muoncounter: I definitely agree with you is lot of laws to explain something in physics. My submission is: if someone in this earth, claims human generated CO2 as deterministic reason (or most likely, and cannot be unlikely) for surface temperature rise of earth, it should be quantitatively deterministic. “So the claim such claim” temperature can be expected (if it’s NOT too much expectation form a lifelong student of science) to ask for deterministically defined in an equation along with many other variables which have positive and/or negative impact on surface temperature variations in this earth. To respond #32 @Glenn Tambly: in the following general equation f (X1, X2, X3, . . . . . Xn) is neither simplistic nor complicated, its general equation, and capable to be actually derived as simple or as complicated once wants to make it. So the general equation is left to one who wants to make it deterministic with respect to all integrated knowledge of co2 generation from all known sources, from land, sea, other water bodies, all animals (including amebas to humans), and all plants, and ALL other variables in climate that one claims to vary the temperature T(temp at time t) = f (X1, X2, X3, . . . . . Xn)* + c, * Where X1, X2, . . . . , Xn are variables, and they may very well be multidimensional To Respond #34 @Philippe Chantreau: I respect you as a person that you are doing your best to respond. I need to clarify I have no connection with “University of Waikato” what so ever, I just googled for and I get references and just refer it to make my point. Here I have again googled for World’s top university in Physics and now will be using some reference from University of Cambridge (that claims to be number 1 University in Physics)” which may not be offensive to you (I can just hope with a positive mind). I respect your views and you any way, and still we both can agree to disagree with our own individual perceptions. I hereby submit to you, please see the following, if you will like to agree or disagree with information, I agree with. (-snip Philosophy of Science What Is Science? Hasok Chang, Anna Alexandrova (8 lectures, Michaelmas Term) What makes science better than, or at least different from, other systems of human thought? Is there such a thing as the scientific method? Is the development of science a linear, orderly and cumulative process, or an unpredictable sequence of changes? Karl Popper rejected empirical proof as the ideal of scientific knowledge, arguing that a genuine attempt to falsify one's own theories was the hallmark of the critical attitude essential to science. In contrast, Thomas Kuhn regarded a dogmatic adherence to a paradigm as the hallmark of 'normal' science. Imre Lakatos attempted to reconcile these views, to show how critical progress was compatible with a degree of dogmatism, according to his 'methodology of scientific research programmes'. Paul Feyerabend saw such attempts as futile, arguing that science progressed best when it was not constrained by any rigid notions about method. After reviewing these conflicting views on the nature of science and its method, we will finish with some careful reflections on whether science can reliably attain the truth about nature. Introductory reading: Alan F. Chalmers, What Is This Thing Called Science?, 2nd or 3rd edition (I have just read the book in 2011, and find really eye opening for me, and I think I should had read this book much much earlier probably in my primary school days as I had started with curiosity in science) Theory and Evidence Hasok Chang (4 lectures, Michaelmas Term) Whatever one might think of the scientific method, it would be difficult to deny that we do give more credence to a theory as it accumulates more positive evidence. But there are many complex questions. Measuring the degree of confirmation is not a trivial matter. Some classic paradoxes show that what we mean by 'positive evidence' at all can be highly ambiguous. The theory-ladenness of observation creates a threat of circularity in the confirmation relation. The presence of auxiliary assumptions blunt the force of any confirmation or refutation that an observation may have on a theory. And what kind of theory can we confirm by evidence, in any case? Is it a law of nature embodying causality or necessity? Or is it merely an empirical regularity? Or a model that is not meant to be literally and completely true of the world? Introductory reading: Alan Musgrave, Science, Common Sense and Scepticism Hidden obnoxious comment here-) To respond #35 @ Rob Painting: refer my response to #34 that I have no relation or connection to “University of Waikato”, I have just googled to find references from a University, to make my point. And I do respect you and your views, even when I have possess an individual mind, to agree or disagree with some science. I claim that I do not have “A sheep's herd mentality” – I own a mind of my own, and can validate facts when logically presented and stand alone with my own judgments or change my judgment, even when whole world is against me. So please keep your personal attack mentality for responding to someone. You can neither heart me nor make me happy.
    0 0
    Response:

    [DB] Long off-topic segments snipped.

  36. patonomics, it seems you asked something quite unreasonable in reality. Reality is a lot more complex than a physical model of reality (google "spherical chicken" or "spherical cow"), yet some consequences of complex interactions are adequately modelled by simplifications, and other consequences are not dependant on the details of the complexity. You cannot write an equation for the totality of a volcanic eruption, with magma, tephra fall, gas released, pyroclastic flows, landslides, lahars, earthquakes and the rest. But you would not expect a single equation for such a complex process, yet it would be utterly naive to suggest we have no idea of how volcanoes work, or their environmental and even climatic impacts. Not all science works by deriving individual equations or laws. Why not look at the following thread: Ten indicators of a human fingerprint on climate and see if you can find a reason why these indicators are not valid. See if you can find fundamental reasons why Richard Alley's AGU presentation on CO2 as the key 'control knob' on climate is fundamentally flawed. The physics of human-caused global warming and more broadly of the greenhouse effect is not a theory on its own, but a consequence of the theories governing atmospheric physics, and absorption/emission of radiation by materials at specific wavelengths See Spencer Weart's excellent history of the CO2 greenhouse effect. Without these theories, most of astronomy and astrophysics, dependant on understanding stellar chemistry based on the absorption and emission of radiation by gases at specific wavelengths would not work. Heat-seeking missiles would miss - their development is inextricably tied to our understanding of the greenhouse effect). A myriad of other modern technologies do not work if you disregard the principles behind the greenhouse effect. But not everything that "works" has a single meaningful equation that describes its operation. The challenge for those doubting the validity of climate science is to find a way that the overarching physics works, yet somehow does not apply to our atmosphere, where it has been observed to work.
    0 0
  37. To Respond #34 @Philippe Chantreau: The (-snip-) part by moderators at #36 , I am linking only a part of Philosophy of Science What Is Science? & . . . . . . Karl Popper rejected empirical proof as the ideal of scientific knowledge, arguing that a genuine attempt to falsify one's own theories was the hallmark of the critical attitude essential to science. . . . Theory and Evidence . . . . . The theory-ladenness of observation creates a threat of circularity in the confirmation relation. The presence of auxiliary assumptions blunt the force of any confirmation or refutation that an observation may have on a theory. . . . . .
    0 0
  38. patonomics#36: "claims human generated CO2 as deterministic reason ... for surface temperature rise of earth, it should be quantitatively deterministic." It largely is. We can see what the forcing factors are and calculate temperature changes that result. There are many posts here explaining all the intricate details behind these calculations. -- source The figure shows clearly that we cannot account for current warming without anthropogenic factors (GHGs). Climate scientists are not unaware of the requirements of science in general and physics in particular. One should be very careful not to assume that everyone working in the field is wrong. That happens rarely - once every few generations at most. There is much to learn about climate science theory and observations available here at SkS, if you care to invest the necessary time - and if you have an open mind.
    0 0
  39. To respond to #37 @skywatcher . . . . . "Not all science works by deriving individual equations or laws." . . . . . & . . . . ."The challenge for those doubting the validity of climate science is to find a way that the overarching (how) physics works, yet somehow does not apply to our atmosphere, where it has been observed to work" . . . Both claims above is a real eye opener for me. I have NO questions to you anymore!
    0 0
  40. muoncounter#39: about "quantitatively deterministic" support by your source is using "circularity" logic of theory as mentioned in #38, and not cause effect or "clear quantification equation" that other can verify of cause and effect, as you might like to claim Please refer #37 and here I like to ask - do you agree with the following statement? "You cannot write an equation for the totality of a volcanic eruption, with magma, tephra fall, gas released, pyroclastic flows, landslides, lahars, earthquakes and the rest"
    0 0
  41. patonomics#41: There is nothing circular about calculating a temperature anomaly from changes in forcing. Perhaps you need to look into these concepts and the relevant evidence. Your volcano/earthquake question is irrelevant. We understand the atmospheric effects and account for them. Are you now claiming that earth science is invalid because it is not described by an equation? This is physics, not engineering.
    0 0
  42. patonomics: The twelve part series, “Atmospheric Radiation and the ‘Greenhouse’ Effect” posted on The Science of Doom website, would be a good place for you to start in your quest for the penultimate general equation of climate change.
    0 0
  43. muoncounter#42: My close friend shared with me the following reference, please guide me shall we understand Physics/Physical Science (yes NOT engineering) with assumption alone? "The practical appeal of the radiative forcing concept is due, in the main, to the assumption that there exists a general relationship between the global mean forcing and the global mean equilibrium surface temperature response (i.e., the global mean climate sensitivity parameter, λ) which is similar for all the different types of forcings." Source - http://www.ipcc.ch/ipccreports/tar/wg1/pdf/TAR-06.PDF
    0 0
  44. Patonomics I read your link from the University of Cambrige and I do not see at all how it supports the idea of a hierarchy between hypothesis, law and theory. I also read your link to the Guardian article and I see nothing showing that U. of Cambridge claims to be number one. The Guardian article ranks it as number one. I did not spend enough time on it to see what were their criteria. I'm sure if the N.Y. Times was doing a ranking of best Physics Universities in the World, they would come up with something different. It seems you are now trying to go to a hierarchy of universities so as to establish that what comes out of one is "better" than what comes out of another. I'll add that one of my links about the vanity of a hierarchy of concepts came from Berkeley, ranking #5 in the Guardian list. And I will not agree to disagree with you in the sense implying that we hold different, equally valid opinions. There is a right answer. A hierarchy of certainty for vastly different concepts has no merit. This is drifting far off the topic of this thread, however, and I will not pursue it any longer.
    0 0
  45. Philippe Chantreau#45: I respect your communication. I completely understand your statement - "And I will not agree to disagree with you in the sense implying that we hold different, equally valid opinions. There is a right answer." . . . . . We just could not agree together. - but I respect you. Thank you very much for your clear communication so far.
    0 0
  46. Philippe Chantreau#45: Respected moderator deleted the part I put for you in #36, so I put a brief fraction in #38 May I personally recommend you to read the following 2 books when you get time, it might surprise you (it does to me at least in 2011) 1. What Is This Thing Called Science? - by Alan F. Chalmers 2. Science, Common Sense and Scepticism - by Alan Musgrave
    0 0
  47. What are laws of nature? What does it mean to say that one thing caused another? It is natural to suppose: that these observations provide a neutral testing-ground for competing theories; that they can reveal how theories should be modified, and that they could tell us which theory is true. . . . .that the situation is not as clear-cut as it might appear. http://www.ice.cam.ac.uk/component/courses/?view=course&cid=4133
    0 0
  48. patonomics#44 Your friend has chosen a single sentence out of the 'Executive Summary' of Chapter 6 of the 2001 TAR, which is somewhat out of date. This hardly constitutes thorough scientific research. I suggest you review the following pages of Chapter 6 on Radiative Forcing, where the research is thoroughly discussed. Or consider Chapter 2 section 2.2 of the AR4 report of 2007: The concept [of radiative forcing] arose from early studies of the climate response to changes in solar insolation and CO2, using simple radiative-convective models. However, it has proven to be particularly applicable for the assessment of the climate impact of LLGHGs. -- emphasis added These foundational questions should make it clear to you that you should do a significant amount of reading before summarily deciding that climate science is circular, non-falsifiable or similarly flawed.
    0 0
  49. Patonomics, every so often someone shows up on SkS asking for 100% certainty that the theory is true. It sounds like you're willing to spend a lot of time telling people here things that they already know. If you want absolute proof that atmospheric CO2 provides additional warming to the troposphere, surface, and ocean, too bad. You're not going to get it. You're going to get theory. And you're going to get observations. The alternative to the theory of AGW is . . . what? Or perhaps there is no way to theorize the climate, because there are simply too many variables. In that case, there is no way to theorize anything, because all "things" exist within the same universal context. Words, words, words. If you're philosophically incapable of accepting an answer, why ask the question of those who are capable of accepting the answer? If you are capable, you should realize that no climate scientist would take the "assumption" you point to as a simple assumption. There is strong theoretical evidence that the relationship exists. If you're truly concerned and not simply trolling like an overexcited philosophy major, read Spencer Weart's The Discovery of Global Warming.
    0 0
  50. patonomics #49, I wonder if you can expand on any disagreements you might have with what I wrote? Or by having "no questions", do you agree with the two statements I made that you quoted? I have spent a great deal of time in cold places with inclement weather doing fieldwork aimed at understanding some aspect of Earth surface processes, and a great deal of that time I was not deriving an equation(!). I was increasing the level of understanding of some processes or of the past climate of the area, yet you seem to suggest that is not valid science? Or have you followed the links I provided (Richard Alley, Spencer Weart, 10 human fingerprints) and found specifically where there are fundamental problems with the theory of climate as it is understood today? I would be particularly interested, in the light of your quote in #44, whether you have watched the Richard Alley presentation, where quite a lot of the evidence of Earth's climate sensitivity under different past conditions was discussed (see also Knutti and Hegerl 2008). General unfounded claims of fundamental failings within the field of climate science ought to be supported with evidence if they are not going to be dismissed as spurious.
    0 0

1  2  Next

You need to be logged in to post a comment. Login via the left margin or if you're new, register here.


The Consensus Project Website

THE ESCALATOR

(free to republish)


© Copyright 2024 John Cook
Home | Translations | About Us | Privacy | Contact Us