Climate Science Glossary

Term Lookup

Enter a term in the search box to find its definition.

Settings

Use the controls in the far right panel to increase or decrease the number of terms automatically displayed (or to completely turn that feature off).

Term Lookup

Settings


All IPCC definitions taken from Climate Change 2007: The Physical Science Basis. Working Group I Contribution to the Fourth Assessment Report of the Intergovernmental Panel on Climate Change, Annex I, Glossary, pp. 941-954. Cambridge University Press.

Home Arguments Software Resources Comments The Consensus Project Translations About Support

Twitter Facebook YouTube Mastodon MeWe

RSS Posts RSS Comments Email Subscribe


Climate's changed before
It's the sun
It's not bad
There is no consensus
It's cooling
Models are unreliable
Temp record is unreliable
Animals and plants can adapt
It hasn't warmed since 1998
Antarctica is gaining ice
View All Arguments...


Username
Password
New? Register here
Forgot your password?

Latest Posts

Archives

Scafetta's Widget Problems

Posted on 24 February 2012 by dana1981, Dikran Marsupial

We have previously examined the work of Nicola Scafetta, a climate "skeptic" and solar-climate researcher at Duke University.  Scafetta's pet hypothesis is that astronomical cycles are somehow responsible for most of the observed global warming over the past century; a concept we have termed "climastrology," because Scafetta has proposed no plausible physical mechanism through which the orbital cycles of various planets should exert so much influence over the climate on Earth.

In recent papers, Scafetta has put forth predictions as to how the average global surface temperature will change in the future.  He has also now created a widget to compare his prediction to the IPCC projections and the monthly observed global surface temperatures.  However, as we will discuss here, there are problems with both the widget itself, and the research on which it is based.

Extreme Curve Fitting

The widget is based on Scafetta (2011), which is very similar to a paper we previously examined, Loehle and Scafetta 2011 (LS11).  The latter created a very simple climate model using two cycles (of 60- and 20-year periods) plus a linear warming trend, and adjusted the parameters in their model to fit the observed temperature data.  As we showed, this simple model does not accurately hindcast past temperature changes (Figure 1), and thus there is little reason to expect it to accurately predict future temperature changes.  It was merely an excercise in curve fitting, matching up a model with the temperature data without any physical constraints.

L&S failure

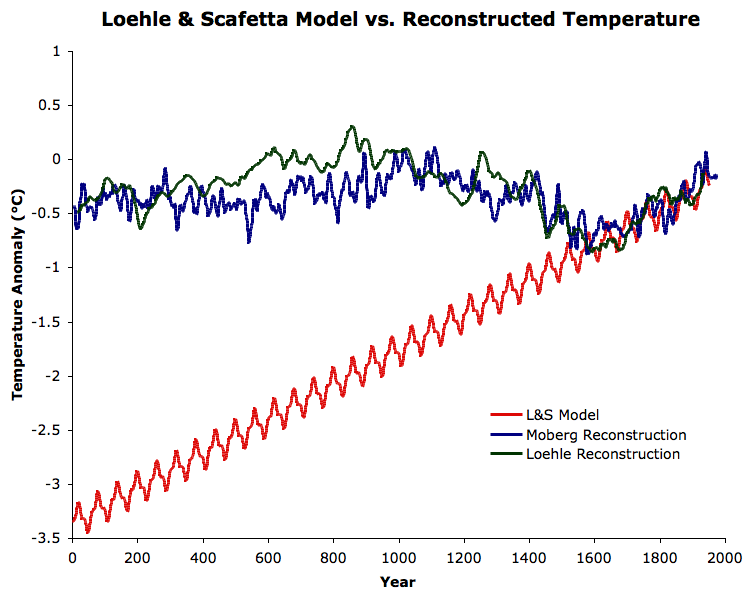
Figure 1: The LS11 Case 2 model projected backwards in time (red), compared to the Moberg et al. (2005) millennial northern hemisphere temperature reconstruction (blue) and the Loehle (2008) millennial global temperature reconstruction (green).

In his newer paper, Scafetta has taken this curve fitting process several steps further yet.  As in LS11 he uses a model with 60- and 20-year cycles and a linear warming trend, but now he has also added a 10.44- and 9.07-year cycle, as well as a quadratic term. 

With so many parameters in his model (each astronomical cycle has a time and amplitude variable, in addition to the quadratic, linear, and constant parameters), we're reminded of Barry Bickmore's examination of Roy Spencer's efforts to attribute global warming to internal natural cycles.  Bickmore referenced a quotation from the famous mathematician, John von Neumann (h/t Tim Lambert).

With four parameters I can fit an elephant, and with five I can make him wiggle his trunk.

With so many parameters to work with, it's not surprising that Scafetta is able to match his model well with the temperature record.  However, as with LS11, Scafetta (2011) has no hindcasting power.  It is specifically fit to the 1850-2011 temperature record, and thus is not intended to apply to past temperatures.  But if it can't hindcast past temperatures, then why should we expect it to accurately forecast future temperatures?

In fact, not even Scafetta expects his model to create accurate temperature predictions.  He applies a different formula to predict post-2000 temperatures than he does to fit the 1850-2000 temperatures.  His argument for changing the model is essentially that solar and volcanic effects contributed to his quadratic and linear warming trends during the 1850-2000 period, and he does not expect those contributions to continue into the future.  Thus for the post-2000 period, he rather arbitrarily eliminates the quadratic term, and simly models a small linear warming trend of approximately 0.09°C per decade into the future, or approximately 0.9°C warming from 2000 to 2100.

However, there is little purpose in creating a model if we simply discard its predictions and replace them with our own rather arbitrary adjustments.  Scafetta's astronomical cycles do not explain the warming trend from 1850-2000, because they are cyclical.  This is illustrated in Figure 2, which removes the quadratic and linear terms from Scafetta's model.  The influence of the remaining cycles results in nearly zero long-term temperature trend.

scafetta astronomical only

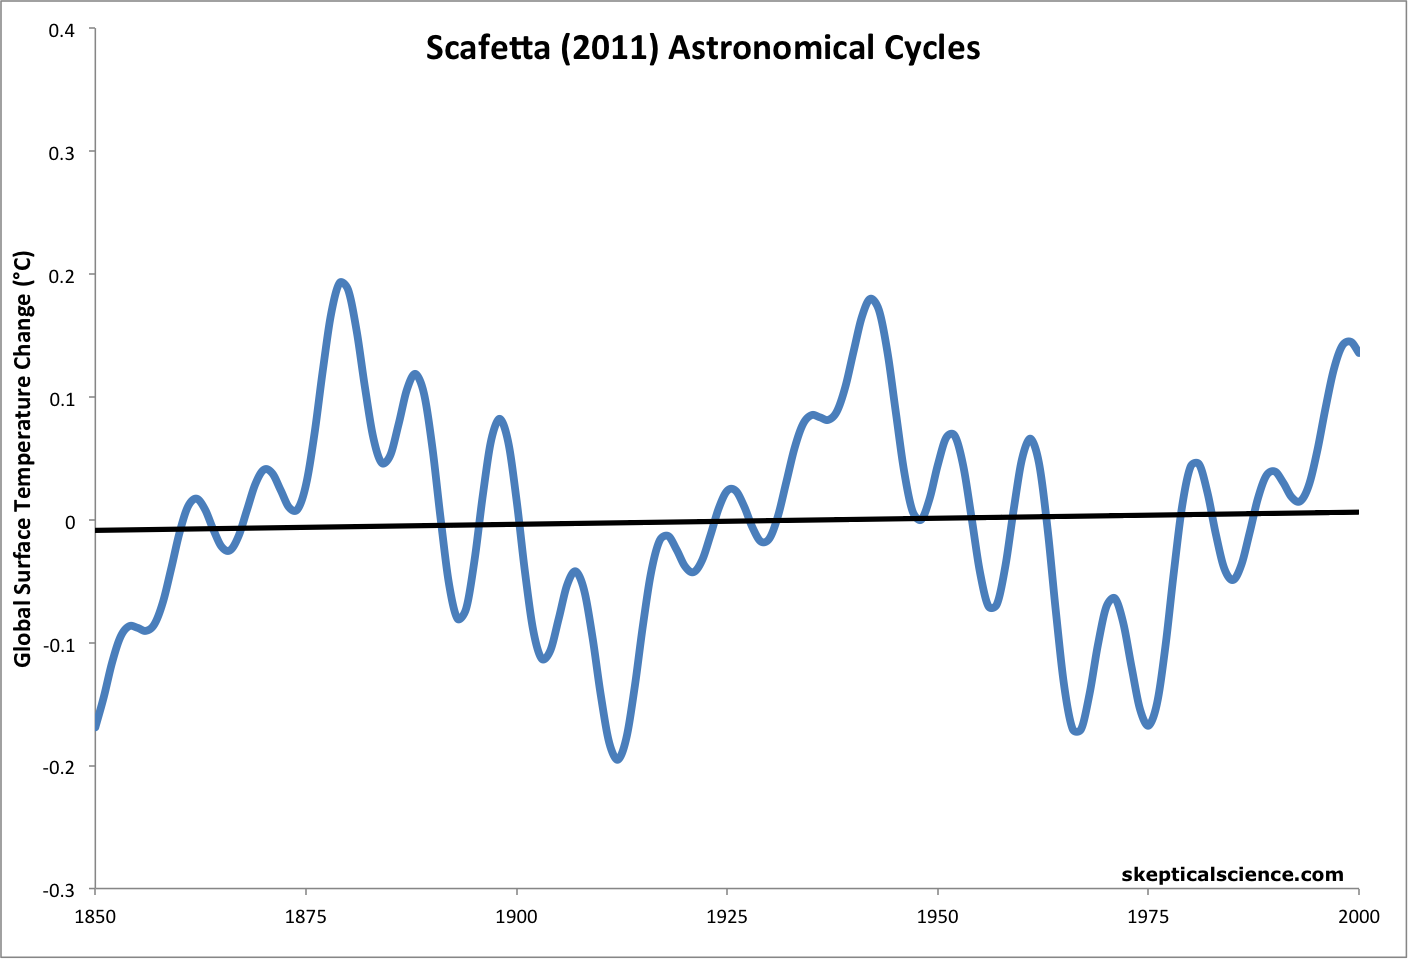
Figure 2: Running the Scafetta (2011) model with the quadratic and linear warming factors removed, leaving just the astronomical cycles.

In short, the quadratic and linear terms explain virtually all of the warming trend, and at most the astronomical cycles could explain the temperature variations.  Additionally, Scafetta's model without the quadtraic term is not a better fit to the data than when the quadratic term retained post-2000 (Figure 3).

Scafetta with and without quad term

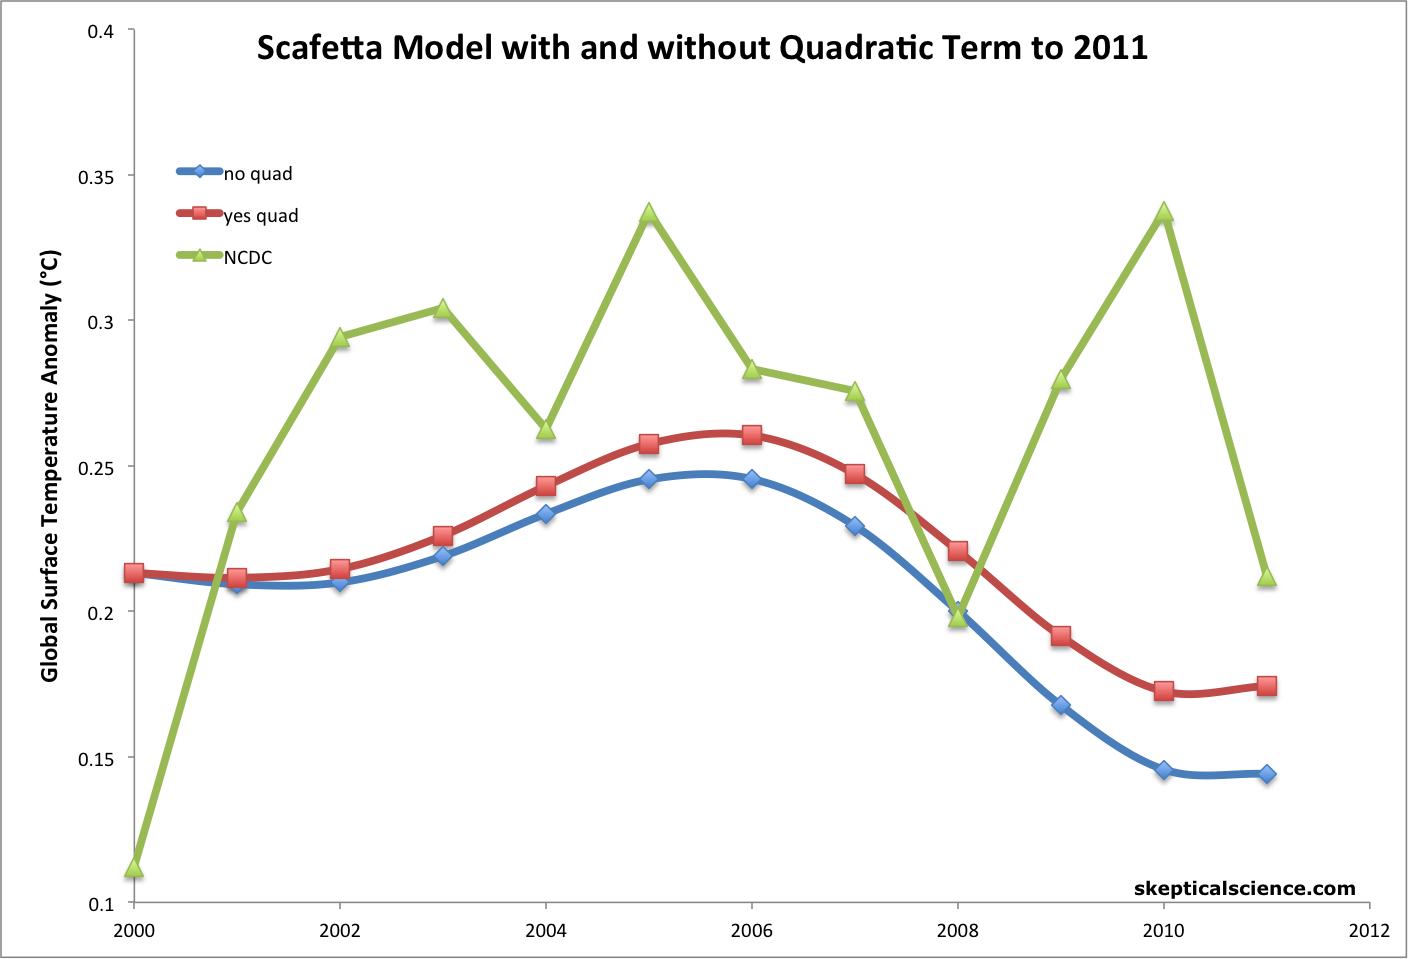
Figure 3: Scafetta model with (red) and without (blue) the quadratic term vs. NCDC annual surface temperature (green) from 2000 to 2011.

Since Scafetta's 1850-2000 model fits the data better than his post-2000 adjustment, he has no justification for making this adjustment.  Running the 1850-2000 model to 2100 nearly doubles the surface warming prediction from 0.9 to 1.6°C between 2000 and 2100.

Climastrology

The quadratic and linear terms in Scafetta's model must be associated with an external radiative forcing, and as we have previously shown, greenhouse gases are the dominant contributors to that radiative forcing and thus the consequent temperature change (Figure 4).

100-150

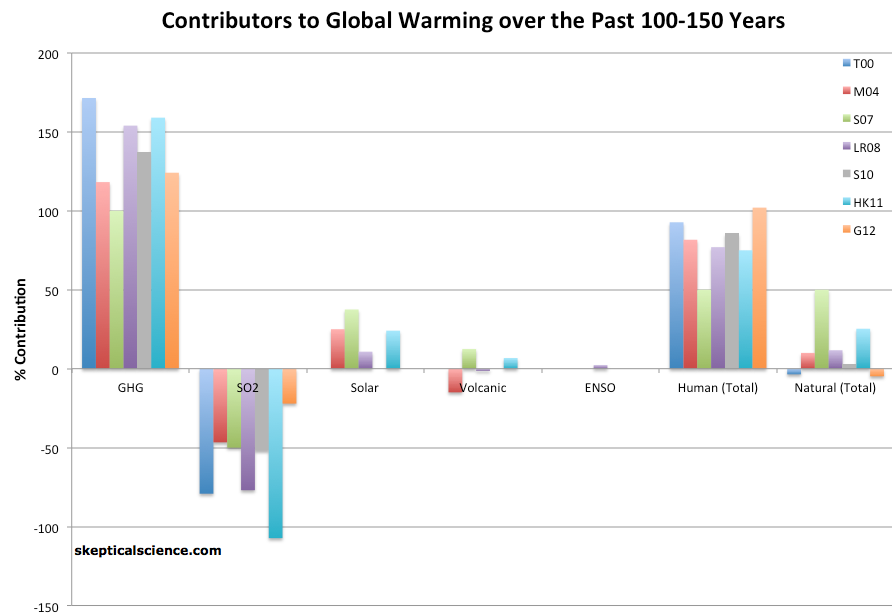
Figure 4: Percent contributions of various effects to the observed global surface warming over the past 100-150 years according to Tett et al. 2000 (T00, dark blue), Meehl et al. 2004 (M04, red), Stone et al. 2007 (S07, green), Lean and Rind 2008 (LR08, purple), Stott et al. 2010 (S10, gray), Huber and Knutti 2011 (HR11, light blue), and Gillett et al. 2012 (G12, orange).

Scafetta tries to downplay the role of greenhouse gases by making passing comments about galactic cosmic rays and other effects which he asserts climate scientists have underestimated.  However, Scafetta has not supported these assertions in his research.  All he has done is create a simple model in which short-term temperature variations are attributed to various cycles and the long-term global warming trend is attributed to quadratic and linear terms.  Based on the body of scientific evidence, these two terms are mainly due to greenhouse gases (Figure 4).

Scafetta also attributes his two new hypothesized cycles to Jupiter-Saturn and Sun-Moon tidal cycles, respectively, but as in his previous paper with Loehle (in which the 60- and 20-year cycles are also attributed to Saturn and Jupiter), he does not propose a physical mechanism through which these cycles could impact temperatures on Earth.  Thus we are again forced to describe this hypothesis as "climastrology," and since these cycles only explain temperature variability (not long-term trends), they give us no reason to doubt the anthropogenic global warming theory.

Since he has diregarded his own model in predicting post-2000 temperature changes, we have little reason to believe that prediction will be accurate.  Scafetta gives a range of possible surface warming trends from 2000 to 2100 (0.66 to 1.3°C), but does not explain how greenhouse gas emissions changes will play into this range.  The IPCC issues temperature projections based on specific emissions scenarios, but because Scafetta's model has no physical basis, he cannot do the same.  Thus his prediction is based on little more than his interpretation of the body of climate science literature (i.e. overemphasizing the role of cosmic rays on climate), and his reading of the scientific literature is itself quite problematic.

Selective Reading

Since Scafetta's hypothesized astronomical cycles have no impact on the long-term warming trend, his prediction that future global warming will be minimal is based entirely on his interpretation of the scientific literature.  For example, he twice mentions that galactic cosmic rays may play a significant role in influencing global temperatures, but fails to mention any of the dozens of papers which have found little if any correlation between cosmic rays and cloud cover on Earth.  Scafetta also fails to mention that solar magnetic field, which influences the amount of cosmic rays reaching Earth, has no long-term trend over the past ~60 years, nor does cosmic ray flux on Earth.  Thus how can cosmic rays possibly explain the rapid warming over that period?  This question remains unanswered.

Additionally, Scafetta references a number of papers which have received peer-reviewed responses, without even mentioning any of those papers:

Scafetta (2011) was published in a solar rather than climate journal (the Journal of Atmospheric and Solar-Terrestrial Physics), so perhaps the reviewers were unfamiliar with the body of climate science literature and thus allowed this selective reading to pass, but if so, the lack of reviewers informed about the body of climate science literature is itself a problem.  Regardless, Scafetta's justification in predicting a small amount of global warming over the next century is based on little more than this selective reading and disregarding of most of the body of climate science literature.

The Widget and IPCC

Scafetta has taken a graphic from his 2011 paper comparing his prediction and IPCC projections to the observational temperature data to create a 'widget' which can be updated to see which is closer to the data at any given time (Figure 5).

scafetta widget

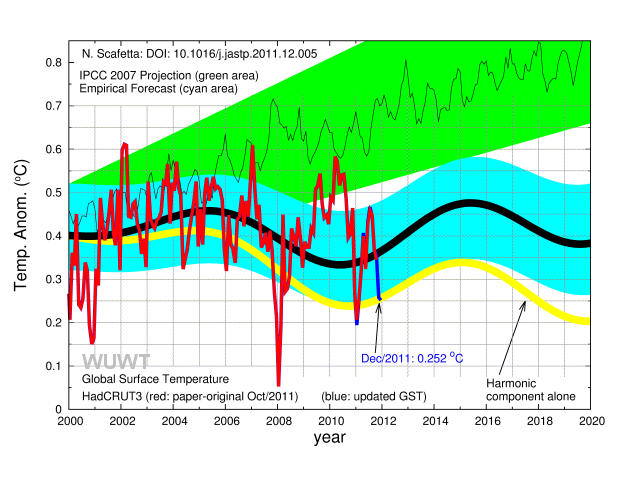
Figure 5: Scafetta's Widget.

However, aside from the issues with Scafetta (2011) discussed above, this widget has some problems of its own.  First, the IPCC projections come from this figure, which only depicts the 1-sigma uncertainty range.  Most readers would interpret the green area in Scafetta's widget to be a region that the IPCC would confidently expect to contain observations, which isn't really captured by a 1-sigma interval, which would only cover 68.2% of the data (assuming a Gaussian distribution).  A 2-sigma envelope would cover about 95% of the observations, and if the observations lay outside that larger region it would be substantial cause for concern.  Thus it would be a more appropriate choice for Scafetta's green envelope.

Second, while the IPCC envelope (Scafetta's green) is based on annual data, in his widget Scafetta plots monthly data, which has greater variability and thus is much more likely to fall outside of the envelope. 

Third, Scafetta has used HadCRUT3 data, which has a known cool bias and which will shortly be replaced by HadCRUT4

Fourth, although the widget itself only shows post-2000 data, Scafetta has used a 1900-2000 baseline.  The choice of baseline is not an important issue when discussing trends, which are independent of the baseline choice.  However, when only comparing the data graphically, as Scafetta's widget does, the choice of baselines can deceive the eye.  For example, if Scafetta's widget were to use the 1980-1999 baseline (as in the IPCC report), the apparent discrepancy between the data and green envelope would be reduced.  If Scafetta wants to use the 1900-2000 baseline, an argument can certainly be made to do so, but he should also update the uncertainty of the model projections to account for the change in baseline (which was not done, and as a result likely further biases the test against the IPCC models).  If a longer baseline is used, this will necessarily increase the variance in the 1980–1999 period, making the uncertainty envelope wider in 2000 than depicted using the original baseline.

We have made these adjustments to Scafetta's widget in Figure 6, showing both 1-sigma and 2-sigma IPCC uncertainties, using annual NCDC temperature data, and using the 1980-1999 baseline on which the IPCC projections are based.

scafetta widget revised

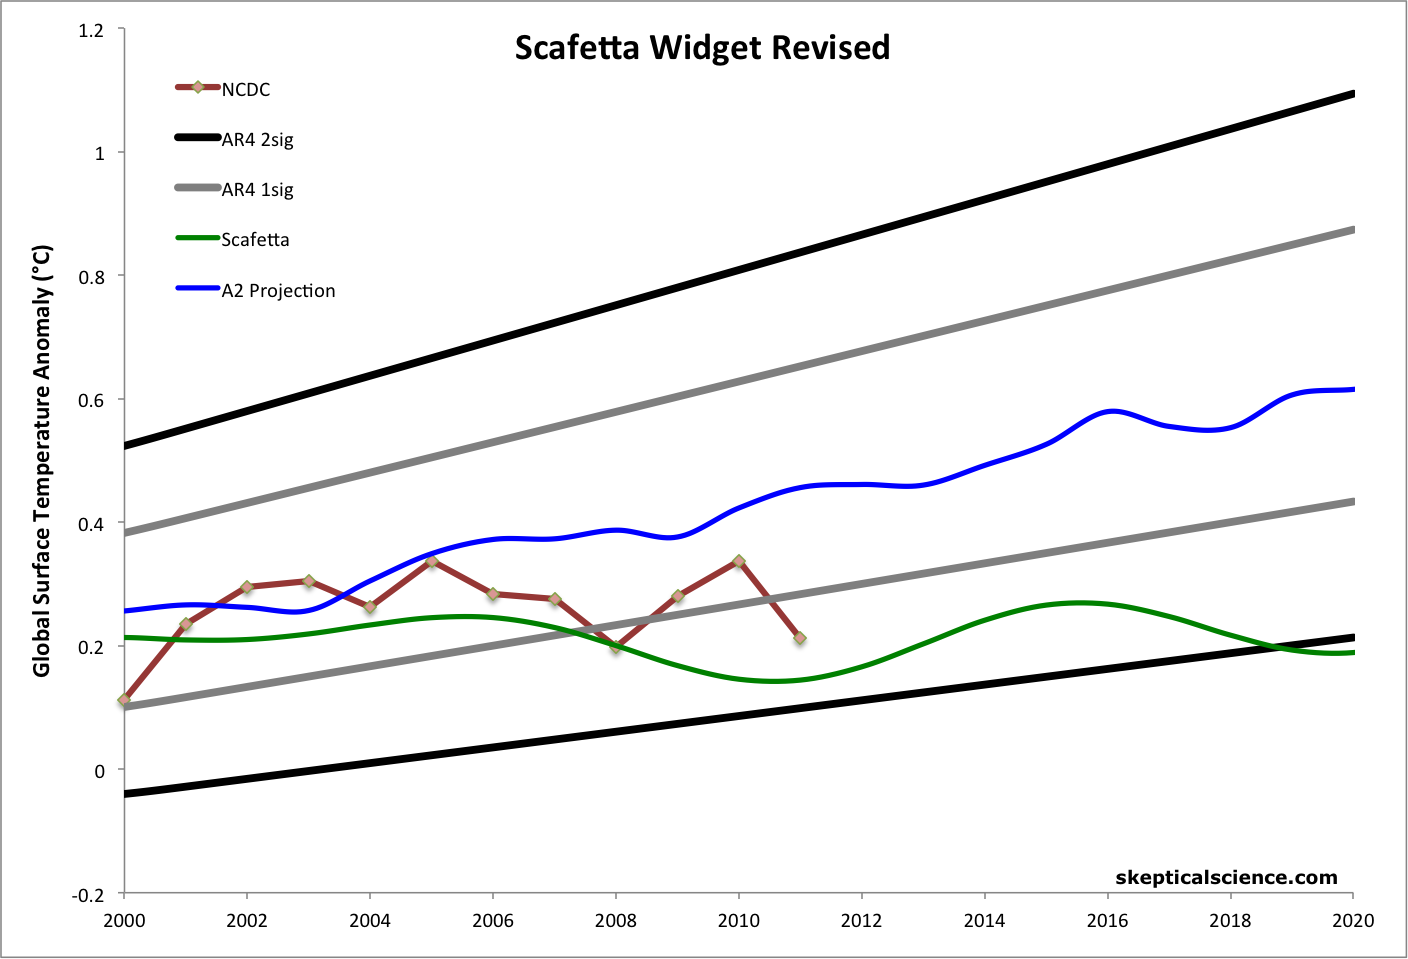
Figure 6: IPCC AR4 envelope of model runs with 1-sigma (grey) and 2-sigma (black) uncertainty range, NCDC annual surface temperature (red), Scafetta (2011) prediction (green), and multi-model mean for IPCC Scenario A2 (blue).

As Figure 6 shows, while the NCDC data falls outside the 1-sigma envelope in 2008 and 2011, it has not fallen outside the 2-sigma envelope.  Thus there is no evidence of a significant inconsistency between the IPCC models and the observations.

Wonky Widget

In summary, the basis of Scafetta's widget (Scafetta 2011) has a number of flaws.  Scafetta's model is little more than an extreme example of curve fitting without a sound physical basis.  The proposed astronomical cycles only explain the variability in the temperature data, not the long-term trend.  The trend is explained by quadratic and linear terms, which he arbitrarily adjusts starting in 2000, based on a very selective reading of the climate science literature.  And his model does not fit the post-2000 data any better with the arbitrary adjustment.

The widget itself is similarly problematic.  It only displays the IPCC 1-sigma uncertainty range when a 2-sigma range would be more appropriate.  It uses monthly data, which has more variability than the annual data in the IPCC figure.  It also uses HadCRUT3 data, which is biased low and will soon be superceded with HadCRUT4.  And the choice of baseline in the figure exaggerates the visual difference between the data and IPCC projections.

While it is commendable that Scafetta is putting his money where his mouth is with this specific temperature prediction, there is little if any reason to expect the prediction to have any accuracy, and the widget itself should be revised to address the issues discussed above, as in Figure 6.

0 0

Printable Version  |  Link to this page

Comments

1  2  Next

Comments 1 to 50 out of 70:

  1. I was going to ask why you would even bother to cover this nonsense. Surely no one would take this guy seriously. Then I found this: Forget global warming - it's Cycle 25 we need to worry about Although the Daily Mail isn't exactly a scientific journal. *Rolls eyes*
    0 0
  2. Estiben did you see the reply from the Met office to that article?
    0 0
  3. Is he really bragging about a 6-month long "accurate prediction" (the blue part of his graph)? or did I miss something?
    0 0
  4. Alexandre - I would say post-2000 counts as a prediction, because that's when Scafetta arbitrarily changed his model formula. On the one hand he was still able to fit the model to the data from 2000 to 2011, but on the other hand, it's an arguably worse fit than if he hadn't changed the formula (as shown in Figure 3). The blue line in his figure is kind of useless, because it's noisy monthly data. He's mostly bragging that the red line is closer to his prediction than the IPCC projections, but the annual data is between the two, and well within the spread of IPCC model runs (as shown in Figure 6). Estiben - I think it's worth covering because Scafetta made this widget, which some websites (i.e. WUWT) display prominently. So it's important to assess its accuracy (which, as discussed above, is not good).
    0 0
  5. dana1981 at 02:58 AM on 24 February, 2012 I understand, but when did he change his model formula? If he changed his model in 2011, than 2000-2011 is "calibration period", not prediction. His paper was written in 2011. Was it about a prediction he did 11 years earlier? Either way, it's poor and pointless curve-fitting, that fails miserably to hindcast past centuries - as you already pointed out.
    0 0
  6. Alexandre - he changed it in 2011, but the change during the did not make the 'calibration period' fit any better (although maybe it does when using annual HadCRUT3 data, though I doubt it). The way I look at it, Scafetta is taking a rather wild and unsupported guess as to how future temperatures will change, and he applied that guess starting in 2000. Granted he knew the 2000-2011 temperature changes at the time, but since the fit is no better, he didn't really use that knowledge to his advantage. Then again, it's such a short timeframe and his model is so oversimplified that he couldn't really have used it to his advantage (i.e. the reasons for the short-term slowed global warming are not incorporated into his oversimplified model).
    0 0
  7. Alexandre I think it would be fair to say that the the calibration period of the cyclic component of Scafetta's model includes 2000-2011, so the cycles are not predictions, but hindcasts/nowcasts. The non-cyclic component is not directly calibrated on 2000-2011 so it is a prediction in that sense. However I wouldn't call it a prediction unless Scafetta had made a prediction in 2000 that temperatures would rise linearly at approximately that rate, rather than 2011. I haven't read all of his papers, so it is possible that he did. The linear trend from 2000 of 0.09°C per decade seems to me to essentially represent Prof. Scafetta's subjective opinion about the future trend in surface temperatures. It is only very weakly supported by the data by his rather arbitrary attribution of part of the rise in temperatures since the 1970s to various factors. There is little physical or statistical justification given for a linear rise as far as I can see.
    0 0
  8. Scafetta was busy in 2011, with a paper on the shared periodicity of auroral cycles and temperature. ... historical records of mid-latitude auroras from 1700 to 1966 present oscillations with periods of about 9, 10–11, 20–21, 30 and 60 years. The same frequencies are found in proxy and instrumental global surface temperature records since 1650 and 1850, respectively, ... This has the climastrology folks all up in a swirl. Scafetta finds these cycles by first removing an accelerating (concave up) quadratic trend from the temperature data. --source is first link above Among the residuals are numerous cycles, which these folks tie to the harmonices mundi, among other things. But isn't the accelerating quadratic trend the point? It is entirely non-periodic and fits the result of increasing greenhouse gas quite well.
    0 0
  9. muoncounter quite, it also leaves them with the problem of explaining why, for example, sulphate aerosols don't cause cooling. I suspect he magnitude of the 60 year cycle is largely dependent on the post 1940s cool period, which is currently largely atrributed to aerosol cooling. If aerosols do cause cooling then Professor Scafettas' analysis is likely to over-estimate the strength of this apparent cycle.
    0 0
  10. So prediction time. 2018 will come and I rather expect climate to follow physics rather than imaginary cycles. Will Scafetta concede the issue - or magically find another cycle to make the data fit. Ladies and gentlemen, your bets please!
    0 0
  11. Well, Scafetta says that if (when) his prediction is proven wrong, he'll admit it. We'll see if he lives up to his word.
    0 0
  12. DM: "the problem of explaining why, for example, sulphate aerosols don't cause cooling" I think that's their goal. If everything is a natural cycle, there's no need for those messy physical causes. But this is hardly new science. See Kepler's Trigon, based on the positions of the 60 year conjunctions of Saturn and Jupiter: From the last date shown (1763), fast forward in 60 year increments: 1823, 1883, 1943, 2003! Clearly this explains life, the universe and everything. Of course, the conjunctions actually happen every 20ish years, but we can only count every third one (because that is what fits our preconceived notions). Rhetorical question: how do you prove imaginary cycles wrong?
    0 0
  13. Ok, so there's this 60-year planetary cycle that is making Earth hot. For whatever reason - let's not nitpick. I suppose we should see regular peaks each 60 years, then. Why is this one the hottest of them all, as far as records/paleorecords go? The dawning of the Age of Aquarius, perhaps?
    0 0
  14. muon - Scafetta does have a 20-year cycle too. And a 10.4, and a 9-year. I'm sure he'll add a couple more in his next paper! Alexandre - this one is hottest because of Scafetta's linear and quadratic terms. Which he wrongly mostly attributes to solar and volcanic forcings. Hence the inclusion of Figure 4 above to show the actual physical cause of the warming trend. What's really interesting is the lack of physical understanding of radiative forcings from Scafetta, who has a PhD in physics (from both the University of Pisa and of North Texas). I'm not sure how you transition from 2 physics PhDs to climastrology in just over 1 decade's time.
    0 0
  15. could someone explain why all the "skeptics" who are convince the climate system and it's models are unpredictable due to chaos etc. Aren't attacking this? I did a search of wozupwidat and found it both supported various 'it's chaos' theories and Nicola Scafetta... I'm confused now.
    0 0
  16. les, I suspect you're being rhetorical? Of course, WUWT espouses ABC--"anything but carbon." They seem to find consistency overrated.
    0 0
  17. hmm I really need to make a list of all the people who in 2020 will have to apologize for predicting cooling.
    0 0
  18. Why, wingding? They'll still be publishing the same stuff at WUWT in 2020, oblivious.
    0 0
  19. We are trying to get these predictions on the record to hold them accountable. Hence the Lessons from Predictions series.
    0 0
  20. dana1981: "... hold them accountable." Good luck with that. You're talking about the crowd that says 'we'll accept the BEST results even if they don't agree with our position' ... until the BEST results didn't agree with their position. The crowd that quickly 'changes the metric' when they don't get what they want. All Scafetta needs to do is add another cycle.
    0 0
  21. It's only natural that those who are antagonistic to the very idea that GHGs play a role in AGW should look at cycles. Firstly they exclude any influence of GHGs and secondly they realise that climate models currently are not very good at modelling cycles such as the AMO and El Niño. Without expecting much to come out of it I tried two simple regression models. One regressing temperature against three independent variables: sunspots (as proxy for solar radiation), optical depth (as a proxy for aerosols) and the Atlantic Multidecadal Oscillation. The second model was the same as the first but I included CO2 as a fourth independent variable. The fist model was poor with an r2 value of 0.19 and no representation of the increase in temperature. The second model, including CO2, had an r2 value of 0.89 and performed quite well. You can see more details at: Climatedata opinions
    0 0
    Moderator Response: [Dikran Marsupial] Nice, especially the caveats at the end. The key with regressions is to remember that they can only tell you what might be explained by some factor, not what is explained by that factor. It would be interesting to see the difference adding ENSO into the model as well.
  22. Ron Manley - Very nice. Did you run a regression including the AMO and ENSO (plus solar, aerosol, and CO2), out of curiosity? Scafettas inclusion of a quadratic term essentially renders his cycles meaningless WRT anything but variations - the quadratic term is an unacknowledged stand-in for CO2.
    0 0
  23. These "cyclical variations explain the warming/lack of warming" theories remind me of the biorhythms fad of the 70s. The use of the cycles (to explain climate variation) by so called scientists is really just like seeing imagined patterns in Rorschach ink blots.
    0 0
  24. First, thanks for the positive comments. I did consider the El Nino index (e.g. Extended MEI) but data for it don't go back as far as the AMO. I could have included both MEI and AMO but while it might have added something to the accuracy it would have added little to the understanding of climate. I could also have included other measures of greenhouse gases. Basically my simple regression model has shown that if you include CO2 and a climate cycle you can simulate temperatures quite accurately. Using CO2 as an independent variable is more justified than using either the MEI or AMO. CO2 is a recognised forcing factor. The cycles/oscillations are not and it would not be legitimate for the IPCC to use them input in their models.
    0 0
  25. It sounds preposterous that planets can affect our climate in any astrological sense, and I think we can safely discount any radiative forcing from them, but it is well known that Jupiter and Saturn are largely responsible for the Milankovich effect modifying our orbit's eccentricity, although this happens over hundreds of millennia. I looked for some details of orbital mechanics and found these, (the resonances are fascinating):    http://mrob.com/pub/planets.html    http://en.wikipedia.org/wiki/Milankovitch_cycles As the Sun and Jupiter are the most massive bodies, their barycentre causes the Sun to wobble with an amplitude of 1.5m km over 12 years (0.01 AU). My thoughts on a cig packet: As this period is 12x longer than our year, Earth wouldn't 'see' all of that differential as a significant (1%) change in intensity, but I guess there may be some tiny decadal signal (1/12%) though I'm sure it would average out and be insignificant. Far far less than the effect of the Milankovich Cycle.
    0 0
  26. I then read the paper... He's obviously spent a lot of time and intellectual energy on this, so I don't dismiss it out of hand. (I take issue with the use of the word "astronomical" - apart from our sun, the nearest star is 4.25 ly away.) He has a point and I don't doubt that planetary influences add some multidecadal red noise to climatic data, but his objective appears to start already from a denialist perspective by distancing himself from AGW advocates: "To understand the reasoning a good start is the IPCC’s figures 9.5a and 9.5b which are particularly popular among the anthropogenic global warming (AGW) advocates" The sun isn't stationary, it is wobbling around a barycentre following a complicated path with approximately a 0.01AU deviation. Consequently the Earth's orbit is not perfectly elliptical and its distance from the Sun also has an n-order Lissajous component. Instead of looking for cycles to fit and then attempting to match them to the climate record to try to mask recent warming, I would tackle it from a signal processing and noise reduction point of view - start by subtracting the effect of everything we know from the climate record - volcanic eruptions, ENSO, CO2 signatures etc, and see what is left over. Then, calculate the waveform of the *distance* of the Earth from the Sun modulated by the sunspot cycle to calculate the irradiance. This is the only method that the planets can affect our climate, short of a collision or extended eclipse. At this point a Fourier transform of both climatic history and derived planetary-influenced irradiance should reveal some common frequencies. Applying the irradiance function to the climate record should automatically damp the signal in the right places, subject to some phase shifting to identify possible latencies in climate response. Anything left over is attributable to something else. Lastly, my favourite sentence: How easy it would be to quantify the anthropogenic effect on climate if we could simply observe the climate on another planet identical to the Earth in everything but humans! But we do not have this luxury. ... ... yet! :-)
    0 0
  27. andylee - "I would tackle it from a signal processing and noise reduction point of view - start by subtracting the effect of everything we know from the climate record - volcanic eruptions, ENSO, CO2 signatures etc, and see what is left over." And that's exactly what Foster and Rahmstorf 2011 did for the last 30 years, and what Lean and Rind 2008 did for the last 120 years. Turns out that there really isn't anything left after you account for solar, volcanic, ENSO, and anthropogenic forcings. No mysterious unknown cycles (MUC's), no 'recovery from the LIA', no cosmic ray influence, or distant supernovae, or orbital resonance from Jupiter/Saturn - it's actually just what we expect from the physics. Oh, and our own actions...
    0 0
  28. “Since Scafetta's hypothesized astronomical cycles have no impact on the long-term warming trend, his prediction that future global warming will be minimal is based entirely on his interpretation of the scientific literature. For example, he twice mentions that galactic cosmic rays may play a significant role in influencing global temperatures, but fails to mention any of the dozens of papers which have found little if any correlation between cosmic rays and cloud cover on Earth. Scafetta also fails to mention that solar magnetic field, which influences the amount of cosmic rays reaching Earth, has no long-term trend over the past ~60 years, nor does cosmic ray flux on Earth. Thus how can cosmic rays possibly explain the rapid warming over that period? This question remains unanswered.” Agree. But there are real astronomical cycles – I prefer the dimension frequency [1/sec] or [1/y] – called heliocentric synodic tide functions, which have correlations with some terrestrial data. Solar tide function of Mercury/Earth is phase coherent with the measured sea level oscillation but also visible in the global temperature data from UAH. http://www.volker-doormann.org/images/sealevel_vs_xyzo.gif Solar tide functions of some two or three objects in the solar system are in coincidence with the reconstructed TSI anomaly after F. Steinhilber, et al. over 5 ky: http://www.volker-doormann.org/images/ghi_vs_tsi_6ky.gif Because the solar tide functions easy can be calculated from NASA ephemerides 1000 years ahead daily, a prediction of the global climate with a resolution of month is now possible. V.
    0 0
  29. Volker Doormann I have had a look at the sea-level/temperature/Mercury/Earth phase coherence, and I have to say that the evidence isn't very compelling. Why show only data from 2009 to 2012? We have sea level and UAH data extending further back than that and if there is a meaningful phase coherence then it should be coherent as far back as the satelite observations extend. The problems with correllations between noisy signals is that if you look hard enough, you will almost always be able to find one purely due to random chance. This is why statistical tests should be used to determine if the degree of correllation is surprising given the noise levels of the data and the number of correlations investigated.
    0 0
  30. I've now updated my model using CO2-equivalent rather than CO2. The regression is slightly improved. What is interesting is that new model gives less influence to sunspots and a better estimate of sensitivity for CO2-equivalent doubling - 0.89 C.
    0 0
  31. @Dikran Marsupial “Volker Doormann I have had a look at the sea-level/temperature/Mercury/Earth phase coherence, and I have to say that the evidence isn't very compelling. “ OK. But it is scientifically not relevant what your evidence detector reject; relevant would it be, if you would state, that there is only a correlation coefficient of about ~0.0 between the solar tide function and sea level and no significant phase coherence between the solar tide function and see level oscillation on the graph seen. “Why show only data from 2009 to 2012? We have sea level and UAH data extending further back than that and if there is a meaningful phase coherence then it should be coherent as far back as the satelite observations extend.” Old trick. How many black swan want you to see, to accept that there are really black swans living? http://www.volker-doormann.org/images/sealevel_1996.gif http://www.volker-doormann.org/images/sealevel_2000.gif http://www.volker-doormann.org/images/sealevel_2004.gif http://www.volker-doormann.org/images/ghi_had_1960_3.gif http://www.volker-doormann.org/images/ghi_11_had1960.gif http://www.volker- doormann.org/images/ghi4_vs_patzelt_dsh1.jpg http://www.volker-doormann.org/images/ghi_11_1.gif http://www.volker-doormann.org/images/echo_g_vs_ghi.gif “The problems with correllations between noisy signals is that if you look hard enough, you will almost always be able to find one purely due to random chance. This is why statistical tests should be used to determine if the degree of correllation is surprising given the noise levels of the data and the number of correlations investigated.” You miss the core of the object. These two graphs are examples of the result of more than two years research in astronomy and climate proxies, and the results are unique in the field of climate simulation and prediction. There is no better tool as summing up solar tides from real objects. Scafetta’s cycle’s have no astronomical basis; time cycles of ~60 years are not astronomy based. My have. V.
    0 0
  32. Volker, correlation is not causation. If the coherence exists over the extend of the satelite record, then plot a graph of the coherence across the satelite record, better still, perform a proper statistical analysis. I suspect the coherence doesn't extend over the whole period of the observations, which would imply that the correllation is no more than a temporary correllation and is essentially meaningless. This advice is well intentioned. Perform statistical tests to determine whether your results can be explained by random chance. It is the safeguard that is widely used in science to prevent jumping to conclusions. If you don't do that, then your efforts are likely to be wasted investigaing meaningless correllations. You wouldn't be the first, you won't be the last, but it would be better if you applied more self-skepticism and didn't make this mistake at all.
    0 0
  33. The sea level data are detrended and retain the seasonal cycle which is what the solar tide function apparently matches. Temperature anomalies are detrended as well and not a very compelling proof. The best case scenario is that it contributes to variblity, though I'd wait for a proper analisys by Volker Doormann.
    0 0
  34. @Dikran Marsupial I do not belief in repipition. I'm off.
    0 0
    Response:

    [DB] If you did not wish to participate in science-based dialogue, of which experimental repeatability is an integral part, than why are you here?

    As an FYI, this forum has witnessed curve-fitting exercises based on the CET before.  And is therefore dubious.

  35. Volker Doorman I don't believe in repetition either, especially if the cycle in question has no statistical significance nor a plausible physical mechanism that can explain the strength of the effect. Sorry, the irony of your response was just too tempting! ;o)
    0 0
  36. Riccardo at 07:13 AM on 1 March, 2012 says: “The sea level data are detrended and retain the seasonal cycle which is what the solar tide function apparently matches. “ Let’s check your theory. There is a science of algebra. From this we can count the number of sea level oscillations in 3 calendar years { http://www.volker-doormann.org/images/sealevel_vs_xyzo.gif } as 19. From astronomy books we can take the frequency of Mercury with 4.15207 [y-1] and the frequency of Earth with 0.9998 [y-1]. The synodic frequency of this couple is f_syn [y-1] = 4.15207 -0.99998 = 3.15209 [y-1]. And because a (solar) tide function is twice the synodic function, because springtides occur as well on conjunctions and also on oppositions, the solar tide frequency of Mercury/Earth is f_sol_tid = 2 x 3.15209 = 6.30418 [y-1]. This means from the logic of algebra that the number of solar springtides from this couple in 3 years counts 3 x 6.30418 = 18.9125 oscillations, mostly equal to the number of terrestrial sea level oscillations in 3 calendar years. In contrast to the (terrestrial) seasonal cycle, which is locked to the frequency of the Earth (http://sealevel.colorado.edu/content/2012rel1-global-mean-sea-level-time-series-seasonal-signals-retained ) , there are only 3 oscillations in 3 calendar years. Conclusion: Your theory is wrong. Personal remark: I read that on this blog science from peer reviewed work is standard. But it seems to me that lacks in simple algebra do not match with that claim. V.
    0 0
  37. Volker Doormann inflammatory or insulting personal notes are surely not welcome, please refrain. Actually I didn't exopose any theory neither have you. You have a hypotheses which you failed to support in any scientific sense. But my point, maybe badly expressed in the last paragraph of my previous comment, is that beig the data detrended they could at best account for part of the variability and that I was and still am waiting for proper statistical analisys. Belive it or not, here we tend to talk about science, I mean, the real one.
    0 0
  38. Scafetta has found a strong correlation between planetary motions and short term climate changes. He is all too well aware that he now faces a much harder task. For his theory to gain traction he must develop a plausible mechanism to support his theory. Will he succeed? I for one wish him well as this task may take many years. The IPCC's models are also examples of curve fitting and their predictions will diverge from observations as time rolls by. You complain when Scafetta refines his models yet have nothing to say about the continuing tweaks to the IPCC's models. Here is specific information obtained by comparing leaked AR5 WG1 drafts with AR4. The writer is Alec Rawls in a debate with William (Stoat) Connolley: "I agreed not to quote the AR5 draft, but I did provide a link to the equally ludicrous ratio of 14 to 1 used in AR4. (The exact number is 13.833.) Does Connolley want to call that a lie too? The raw evidence (solar climate correlations vs. CO2 climate correlations) says that the sun is the much stronger driver, yet the IPCC assumes that CO2 has many times the warming effect of solar variation. In for a penny in for a pound apparently. The exact AR5 FOD ratio is 39.857." All of you can check the 13.833 yourselves; it is in the AR4 documents. If you want to confirm the 39.857 number contact me: http://www.gallopingcamel.info/IPCC.htm
    0 0
  39. gallopingcamel You are right to say that for Scafetta to gain any traction he will need to develop a plausible mechanism that can explain not only the correlation, but also the strength of the effect. As it happens, I suspect the correlation is not actually all that good, given the number of unconstrained variables he has to play with. All I can say is "good luck with that!" ;o) However, you statement that the IPCC models are examples of curve fitting is simply wrong. GCMs are physical models, not statistical models. They do have some capacity to be tuned, but they are very constrained in this by having to obey the laws of physics programmed into them. Ever wonder why skeptics haven't made a GCM that can explain the observed climate change without CO2?
    0 0
  40. Jose_X - "The model states essentially 1850 < t < 2000 and 2000 < t < 2100 iirc. To hindcast further is interesting but void." In that case Scafetta's model is nothing more than a limited description of that data. Such a description provides no ability to extrapolate outside the period, either in hindcast or forecast (to quote, "interesting but void"). It's not a model, it's a frequency decomposition. I can look up at noon and provide a description of the sky - "It's blue!". But this says nothing about the physics of the interaction of light and air, and will not allow me to predict a red sky at dusk/dawn. Scafetta claims that he has a model of the climate based on cycles and trends - he does not. He only has a description. And that provides essentially zero predictive power.
    0 0
  41. KR, but if you guess blue, you will be right a fair amount of the time. If you identify that blue is correct 35% of the time, you may be able to improve your existing physics model which had been accounting for blue 40% of the time. Frequency decomposition is not the end of it because there truly are many cycles in nature (expect blue a very large portion of the time every 24hrs starting at noon). Further, I mentioned that a claim was made in the paper that weighing to 1850-1950(?) was able to do a very good job predicting (the untrended cycles) from 1950-2000. Also, teaching/testing with the periods flipped also did very well. You are ignoring that. The odds of that happening (for red noise) are very small. [I'm assuming there was actually a "good" job done.. say relative to what a typical climate model would do.]
    0 0
  42. gallopingcamel at 01:53 AM on 2 March, 2012 says: “Scafetta has found a strong correlation between planetary motions and short term climate changes. “ No. Scafetta has several time cycles in years of sinusoid function superimposed and fitted in time and amplitude to a short time interval of the global temperature spectrum. This has nothing to do with neither astronomy nor planetary motion. It’s simple Math. “For his theory to gain traction he must develop a plausible mechanism to support his theory.” (-snipI think here is a general misunderstanding about the basic elements in science. A mechanism is an element of the science of physics, because physics deals with forces and causality. Causality is the idea that a cause is followed in time by an effect. There are other elements in science than physics: logic and/or geometry, which have no mechanism. There are also motions of two objects and it is impossible to say, which object follows ( http://de.wikipedia.org/w/index.php?title=Datei:Orbit5.gif&filetimestamp=20050818225817 ) It is a perpetual mobile because it moves without any drive energy or loss energy over millions of years. There is no time delay in this motion, only a ratio of 3:2 in the geometry.-) (-snipThis may show, that geometry is first relevant, also in astronomy and gravitation, but not a mechanism. The logic goes that if there is a geometric connection from the science of geometry in nature than physics can look for a possible mechanism if there is any. -) V.
    0 0
    Response:

    [DB] Off-topic meanderings snipped.

  43. gallopingcamel @38 - the models used in the IPCC report are physically-based and physically-constrained. Scafetta's is not. That is why the latter is curve fitting (allowing variables to fit the data unconstrained by physical reality) and the former is not. To be blunt, Alec Rawls has no idea what he's talking about. He is clearly entirely unfamiliar with the body of climate science (and solar) literature. His comments are based on his 'gut feeling' whereas the IPCC is based on a comprehensive literature review. Not unlike the difference between the IPCC and Scafetta.
    0 0
  44. dana1981 (or anyone), what does climate science say about the ability to "predict" solar intensity? I really have very little idea of how much this intensity is anticipated, except that there is some sort of 11-year cycle. Do we have bounds for the range? Also, does anyone have a link to a sensitivity study? Thanks. [.. now back to google]
    0 0
  45. Jose_X - solar activity is very difficult to predict. Solar cycles 24 and 25 are both expected to be weak ones, however.
    0 0
  46. Jose_X - Since Scafetta's two fits (1850-1950 and 1950-2010) are both hand-tuned, using the same basic cycles and almost the same phase shift as each other, and since they are derived from his earlier work with much the same 60-year cycle, it is extremely difficult to tell whether they are different fits or not. Note that hand-tuning a small set of cycles (which are representative of, but not the primary components of, the signal - Tamino found a roughly 70-year cycle to be the peak for this data set) is not the equivalent of analyzing the data and seeing where it leads you. There's a significant risk of confirmation bias. I'm not ignoring the partial data sets he used - but I will point out that hand-tuning can lead you to assuming your consequent. Other notes: The Loehle and Scafetta 2011 paper referenced in the OP states that these cycles are strictly short term variations, that: "The residuals showed an approximate linear upward trend of about 0.66°C/century from 1942 to 2010. Herein we assume that this residual upward warming has been mostly induced by anthropogenic emissions, urbanization and land use change. The warming observed before 1942 is relatively small and is assumed to have been mostly naturally induced. The resulting full natural plus anthropogenic model fits the entire 160 year record very well. " (emphasis added) And given that Lean and Rind 2008 clearly show that short term variation is actually attributable to solar, volcanic, ENSO, and anthropogenic influences, not astronomical cycles, Scafetta's work really does not hold up. --- 'Curve-fitting' is analysis, a description. Not a model, not the underlying physics, and not terribly useful for predictions when the underlying forcings are changing.
    0 0
  47. KR >> it is extremely difficult to tell whether they are different fits or not. I think I see your point. I would assume that the fits followed some standard algorithm or goal (eg, maximize xyz). If key algorithm/function details for setting up the equation for each half actually come from an analysis of the whole (consciously or subconsciously), then that would spoil the predictive claims. >> hand-tuning ... There's a significant risk of confirmation bias. Yes. >> ..a small set of cycles ... There's a significant risk of confirmation bias. Well, the small number of cycles mostly appear to come from a standard approach I think. You did mention the 4yr cycle but that might just be a detail. >> not terribly useful for predictions when the underlying forcings are changing. Although frequency analysis can help identify patterns that were not seen before. It can augment MLR used by L&R08. It may give insight into PDO, AMO, and other such cycles. It may identify subtle coupling or small cycles within the cycles. I may help clean out their precise boundaries. It may also help understand shorter term ENSO. The derived data is data with a fresh face and that can help future efforts to understand the physics. I have not read Lean and Rind 2008 (nor the details of Scafetta'11), but I have heard that the models are not generally designed to deal with very short-term "weather". If a sound approach using frequency analysis proves to track future changes fairly closely for 1-30 years after the training period (ie, the range where many models are weak ??), then it seems modellers would want to improve the models in this way. It may be cosmetic to "tune" the model officially once per decade, but all else being equal who wouldn't prefer to have their model reduce short-term error significantly?
    0 0
    Moderator Response: [JH] Your serial posting of meandering comments suggests that your primary objective may be to "gum-up" the SkS comment threads. Deniers who have previously played this game have been banned. We are closely monitoring your activity.
  48. [DB] wrote: “If you did not wish to participate in science-based dialogue, of which experimental repeatability is an integral part, than why are you here?” (-snip'Complex question / Fallacy of interrogation / Fallacy of presupposition. The question presupposes a definite answer to another question which has not even been asked.'-) Dikran Marsupial wrote at 06:53 AM on 1 March, 2012: “If the coherence exists over the extend of the satelite record, then plot a graph of the coherence across the satelite record, better still, perform a proper statistical analysis. I suspect the coherence doesn't extend over the whole period of the observations, which would imply that the correllation is no more than a temporary correllation and is essentially meaningless.” I have given my arguments regarding that my astronomical method to forecast the climate is based on the real geometry and real objects in the solar system, while the math of N. Scafetta is not. If Dikran Marsupial has an idea or a theory or a personal suspection it is his personal opinion. A science based dialogue would take my given arguments and either one agree with or refute the method in a scientific manner. You are wrong, if you presuppose that the reply of D.M. is science based; it is not. On 1 March, 2012 at 06:42 AM I have given 8 URL’s of graphs, showing the results of my method including several thousand repetitions of solar tide periods. If you wrote your response some two hours later on 09:18 AM on 1 March, 2012, you must have had knowledge on the repeatability. Last point. If you are interested in a scientific based dialogue, the suspect to a person is not a method of science. V.
    0 0
    Moderator Response:

    [DB] Buck up, answer questions put to you directly and spell out the physical causal mechanisms that support your hypothesis (_not_ a theory) complete with what significance testing you have done. 

    Failure to do so is an abject admission that you are practicing climastrology, not science.

    Pointlessly off-topic snipped.

  49. Volker, the scientific component of my objection was that you had not demonstrated that the coherence was anything more than temporary and actually existed throughout the satellite records. I also pointed out that you had not performed a statstical analysis to see if a temporary coherence is surprising. Those are both valid scientific points, which you have refused to address. The component of my post that was speculation was clearly labelled as such, and so is no excuse to dismiss the substantive scientific issue. There is also the point that, like Scafetta, you need a plausible physical mechanism that can explain the strength of the effect, not just the correlation/coherence. If you are interested in scientific based dialogue, then you need to conform to the conventions of science, for instance performing a proper statistical analysis of the data, or responding constructively to criticism, by for example, demonstrating that the claimed coherence is not merely a temporary artefact.
    0 0
  50. JH#47, "meandering comments"? It would really help me know what you were talking about if you were a little more specific. I would like to know what questions or replies can be entertained here and which can't (maybe using a few samples of what I wrote). I can try to keep the forbidden comments to some other website and here stick to what is allowed. The closest possible violation I saw from the Comments Policy would be being off-topic. Although I was specifically invited to come and reply on this thread.
    0 0
    Moderator Response: [JH]You have astutely avoided telling us what you are attempting to acheive in your serial and rambling postings.

1  2  Next

You need to be logged in to post a comment. Login via the left margin or if you're new, register here.


The Consensus Project Website

THE ESCALATOR

(free to republish)


© Copyright 2024 John Cook
Home | Translations | About Us | Privacy | Contact Us