Of satellites and temperatures
Posted on 13 August 2010 by Ned
Guest post by Ned
There are a variety of rumors floating around the "skeptic" blogosphere involving claimed problems with satellite temperature measurements. Unfortunately, there is a great deal of confusion on this point. While a lengthy analysis of this topic would be useful, for now we will just briefly hit the main points:
- These stories were sparked by image maps of surface temperatures for the US/Canada Great Lakes posted by an automated processing system at the NOAA-funded Great Lakes Coastwatch program website. In areas with full or partial cloud cover, these maps sometimes show obviously erroneous temperature estimates over the lakes.
- There is a great deal of confusion about whether this represents a broader problem with satellite temperature measurements, and perhaps "invalidates" the satellite temperature record.
Are the Great Lakes Coastwatch data used in any of the global mean temperature records?
First off, the Great Lakes Coastwatch data products aren't part of any global climate data set. They are produced by a local team of investigators supported by the Michigan Sea Grant program and NOAA's Great Lakes Environmental Research Laboratory (GLERL), and are primarily used by fishing vessels, natural resource managers, and scientists with an interest in the Great Lakes.
The images posted at the Great Lakes Coastwatch site come from an automated algorithm that assimilates thermal infrared imagery from the Advanced Very High Resolution Radiometer (AVHRR) instrument on NOAA's Polar Orbiting Environmental Satellite (POES) constellation. Where clouds are present, the temperature measurements are not reliable, and the algorithm flags these areas with black or gray tints on the maps to indicate this uncertainty.
It's important to note immediately that these data have no connection whatsoever to the main global satellite temperature records, which are produced by researchers at Remote Sensing Systems (RSS) and at the University of Alabama at Huntsville (UAH). Those data sets come from measurements by different sensors entirely, operating in the microwave portion of the electromagnetic spectrum, rather than the thermal infrared range used by AVHRR.
The Great Lakes Coastwatch data are likewise not merged with any of the global mean temperature records produced by NASA, NOAA, the University of East Anglia, the Japanese Meteorological Agency, or others.
So, to allay people's fears, none of the Great Lakes Coastwatch data are used in any global temperature reconstruction, and the primary satellite temperature trends don't even come from the same sensor or the same portion of the electromagnetic spectrum. Conflating the two data sets isn't just like confusing apples and oranges, it's like comparing apples and salmon, or apples and lettuce (or pick any two completely unrelated food groups of your choice).
Implications for sea surface temperature measurements elsewhere
That said, data from AVHRR are used as one (among many) sources used to measure sea surface temperatures (SST). Do the errors in some of the Great Lakes Coastwatch images indicate potential problems for SST data sets elsewhere?
There is a particular concern about the status of the AVHRR instrument on the NOAA-16 spacecraft. The stories circulating in the skeptic blogosphere this week generally don't recognize that NOAA-16 is a "secondary" satellite in the POES constellation, that AVHRR is present on other satellites, and that there are additional sensors on other US and international spacecraft with similar wavelength ranges in the thermal infrared range that are used for sea (or lake) surface temperature measurement.
Satellite thermal infrared measurements of sea surface are one of the most important global weather and climate records, and are used for everything from tropical storm prediction to fishing vessel operations. These data are provided by different sensors on multiple spacecraft, and are continuously validated using in-situ temperature measurements from buoys and ships.
In summary
Stories in the "skeptic" blogosphere recently have given their readers a mistaken impression that there are reasons to question the validity of observed warming in the various satellite-derived global climate data sets. This is not the case.
The cited examples of temperature errors in the Great Lakes region are not incorporated in any of the global mean temperature records. In particular, there is no connection to the satellite microwave temperature analyses by RSS (Figure 1) and UAH, which use entirely different sensors operating in a quite different portion of the electromagnetic spectrum.
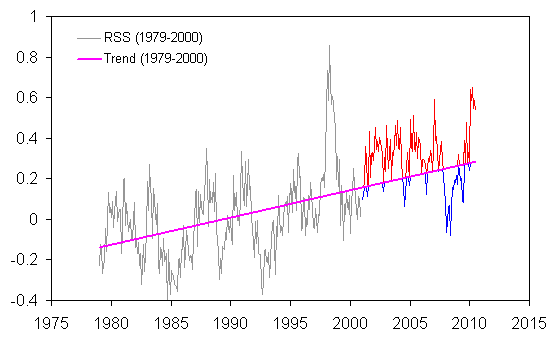
Figure 1. RSS (satellite-derived) monthly temperatures through 2000 (in gray) and 2001-2010 (red and blue). The pink trendline is the linear trend 1979-2000.

Arguments


More to the point, since metal has very low emissivity, the rest of the ship would probably lower the apparent temperature of the pixel more than the heated smokestack would raise it.... But at 1 km resolution, both effects would be trivial.
http://www.remss.com/msu/msu_data_description.html#rss_msu_data_analysis
ftp://ghrc.nsstc.nasa.gov/pub/data/msu/t2lt/readme.13Apr2010 (scroll to Dec 2006 updates)
It's unbelievable how little it takes for some people to cry foul. I think we should compile a list of all the times that accusations of "conspiracy" and "fraud" have been shown to be either completely baseless or of little significance. Anybody remember the boy who cried wolf?
-Alden
Well, science denialism is more like crying "sheep" when there's a wolf at the door ...
How high is this layer? How does it compare to the standard surface measurements like NCDC´s?
For folks interested in learning more about the NOAA constellation:
The National Environmental Satellite, Data, and Information Service (NESDIS) (complete information on orbiters including systems and subsystem status)
NOAA Satellite Services Division (quick data product access)
NOAA's "Satellites" page (a potpourri of links to satellite-related NOAA pages)
NOAA "Image of the Day" (just for fun)
Or, depend for information on websites making such broad and surprising remarks as "Official weather forecasting hasn’t improved since it began and is of insufficient accuracy to be useful."
How high is this layer?
It's up to about 5 km, but the intensity measured by the satellite in this band also depends on absorptivity of the layers above (e.g. clouds, humidity, aerosols, etc.) and vertical temperature distribution.
I don't know the actual frequencies and bandwidths. Anyone?
For the satellite/Hansen data divergence, check this out. Both the UAH and the RSS data show divergence with the GISS/NOAA ground station ADJUSTED temperature stations. GISS/Hansen has serious warming going on. About 0.3C* of it, out of 0.7C*. This makes the global warming part of the 1850-1982 "normal" warming, not the pCO2 induced hyperbole.
So TLT is roughly equivalent to AMSU-A 5. Frequencies are similar. A chunk of air far wider than the surface standard measurment.
Trends 1979-present
NASA GISS: +0.16 C/decade
HADCRUT: +0.16 C/decade
NOAA NCDC: +0.16 C/decade
RSS TLT: +0.16 C/decade
UAH LT: +0.14 C/decade
The only outlier is UAH, which is slightly lower than the others.
Assessing global surface temperature reconstructions
BP, this chart compares the bands on MSU and AMSU instruments.
Thanks.
All of these rotate with scan angle, whatever that means.
I still don't know the bandwidths and whether TLT uses AMSU-A or AMSU-B.
Another "leaping to conclusions" moment, one of many. I'm surprised Watts has not amended that article so as not to continue propagating an incorrect impression.
TLT uses AMSU-A channel 5, which as you can see is quite close to MSU channel 2.
"Rotate with scan angle" refers to fact that the plane of polarization changes as the instrument scans back and forth perpendicular to the nadir line.
Bandwidths for AMSU are here, along with a great deal of additional information that might be of interest. Bandwidths for MSU are here.
I think the other problem with that discussion at Watts's site is the analysis of 5-year (!) trends in the difference between RSS and GISS. Those fluctuate around a lot -- over the past few decades, they've ranged from GISS warming faster by +0.03C/decade to RSS warming faster by +0.03C/decade.
In other words, you can pick five-year intervals to show either one "diverging" from the other ... but they keep converging again. As noted above, over the entire 1979-present interval RSS and GISS both have a warming of +0.16C/decade
Bandwidths for AMSU are here, along with a great deal of additional information that might be of interest. Bandwidths for MSU are here.
Thanks. I see AMSU-A 5 is actually two closely packed channels at 53481 MHz and 53711 MHz, nominal relative bandwidth is 3.2×10⁻³ for both, pretty narrow. MSU 2 is 53740 MHz, relative bandwidth 4.1×10⁻³.
As these frequencies are much (by more than two orders of magnitude) lower, than the typical νmax for thermal radiation of Earth, energy flux in this narrow frequency band should be proportional to absolute temperature [at low enough frequencies Planck's law can be approximated by I(ν,T)=2kTν2c-2]. However, it is true only for a black body, one for which absorptivity/emissivity is one.
Temperature of a solid opaque surface can only be measured this way if its emissivity is known. With a semi-transparent medium (like the atmosphere) which has different temperatures at different depths and absorptivity can also vary, it gets much more tricky. With no additional information it is utterly impossible to recover anything remotely reminiscent to proper temperature from the signal measured.
As at the TLT channel temperature is measured down to the surface, at this frequency the atmosphere should be pretty transparent (meaning it also have a low emissivity by Kirchhoff's law). So thermal radiation directly from the surface (e.g. rock warmed by the sun) also makes through and at he instrument it is indistinguishable from the portion of radiation originating from the atmosphere itself.
Therefore not only a sophisticated model of atmosphere is needed to make sense of the dataset measured, but the radiative properties of the surface below have to be known as well. So this kind of temperature measurement is far more complicated than advertised and needs a lot of additional information that should be gathered (and validated) by other means.
sounds like a literature search is in order
Yes. And guess what I have found.
Atmósfera 23(3), 225-239 (2010)
A neural network approach for temperature retrieval from AMSU-A measurements onboard NOAA-15 and NOAA-16 satellites and a case study during Gonu cyclone
A. K. MITRA, P. K. KUNDU, A. K. SHARMA & S. K. ROY BHOWMIK
Received August 15, 2008; accepted March 11, 2010
There is a nice description of the usual procedure used to recover temperatures from channel data, in this case the workings and input data used by IAPP (International ATOVS (Advanced TIROS (Television Infrared Observation Satellite) Operational Vertical Sounder) Processing Package) under 2.1 (Temperature Profile Retrievals Approaches - IAPP). You should read it. It's pretty much what I've said above (in #18).
Three points should be stressed.
The situation is worse than I've thought for I happen to know a thing or two about Neural Networks (I've had the luck to work with them).
The first thing to mention is that NNs has not much to do with actual networks of neurons in the brain*. It is a computational technique inspired by the ideas of the late Donald Olding Hebb, published in his famous book The Organization of Behavior, 1949 (although Warren S. McCulloch and Walter Pitts reached similar, but more exact results as early as 1943 with networks of formal neurons of a kind). Neurophysiology has made some advance since then, therefore a sharp distinctions should be drawn between the concepts of ANN (Artificial Neural Network) and BNN (Biological Neural Network).
The work of these distinguished scientists is based on the former one, that is, ANN computations of a special kind. It is basically just another way of multi parameter curve fitting. It is not science per se, but a clever last resort engineering solution in cases when one does not have a clue what to do (like decoding handwritten text or speech).
The scary part is it gives better results than models based on sound atmospheric and radiation physics (still not good enough though, RMS error being 3°C).
It shows beyond doubt that satellite temperature measurements are not measurements of temperature at all in the traditional sense of the word, just some (remote) proxy to it and that some essential ingredient is still missing from climate science.
I'd reckon it's the role water plays. Its atmospheric distribution is highly irregular, based on images like the one below it can even be presumed to be fractal-like in nature. Calculating averages over fractals can be tricky (depends on model resolution).
Some more reading:
Indian Journal of Radio & Space Physics
Vol. 35, August 2006, pp. 286-292
Study of temperature and moisture profiles retrieved from microwave and hyperspectral infrared sounder data over Indian regions
Devendra Singh & R C Bhatia
Received 27 July 2005; revised 10 March 2006; accepted 4 April 2006
-------------------
*It is absolutely off-topic here, but shows a possibility (among many) how far off ANN may be from BNN. Some might enjoy it, anyway.
The case that mammalian intelligence is based on sub-molecular memory coding and fibre-optic capabilities of myelinated nerve axons
By R. R. Traill
Originally Published (1988) in Speculations in Science and Technology, 11(3), 173-181. Republished online (June 2009) by Ondwelle Publications, Melbourne — and by Gen.Sci.J. — with permission from Springer Verlag
Let's assume for the sake of argument that something's wrong w/microwave temperature soundings, freeing us to assess the impact of such a problem on the issue we're discussing here. An assessment of the gravity of an error here would seem to hinge on two questions:
--What is the value or relevance of absolute accuracy w/respect to detecting a trend in temperature?
--Is there an underlying error in the various methods used to derive temperature from microwave radiance that introduces a secular trend in the readings?
I suggest that absolute accuracy is not relevant. If there's a substantial issue it would be an error producing a trend artifact. Is there?
If there's a substantial issue it would be an error producing a trend artifact. Is there?
If there is one, it should be a secular downward trend in upper tropospheric humidity. Paltridge 2009 is still looming above.
He has used NCEP balloon radiosonde reanalysis data on face value and found considerable drying of upper troposphere. Of course there are known problems with radiosonde humidity measurements, but have a look at this graph (mid frame from Fig. 3 of the paper):
At 700 hPa (about 3000 m) temperature in the tropics is still well above freezing, so frost-related problems of humidity measurements can not possibly occur. I think this downward trend is particularly hard to be explained away.
If models used to convert brightness values in narrow microwave channels to proper temperatures do not take this trend into account, they can misidentify increased brightness due to increasing transparency of upper troposphere (making lower, warmer layers "visible" to satellites) to increasing temperature.
Theor Appl Climatol
DOI 10.1007/s00704-009-0117-x
Trends in middle- and upper-level tropospheric humidity from NCEP reanalysis data
Garth Paltridge, Albert Arking & Michael Pook
Received: 21 July 2008
Accepted: 4 February 2009
Published online: 26 February 2009
But not even average specific humidity has to decrease to fool model calculations. It is quite enough for horizontal humidity distribution to become a bit more uneven to increase average brightness. I do not know if we have ready-made data on trends in higher moments of humidity distribution, but it would worth the effort to have a peek.
Really, Peter, the company you keep. Tsk-tsk.
As to the humidity trend, what's with the "if?" If you don't know whether humidity trends are taken into account when deriving temperature, why not find out?
Christy & Spencer seem to place a high degree of confidence in deep atmosphere soundings: Assessment of precision in temperatures from the microwave sounding units
Derivations do take humidity into account and appear to be tested against radiosonde measurements, as described by Christy and Spencer: Error Estimates of Version 5.0 of MSU–AMSU Bulk Atmospheric Temperatures
http://www.skepticalscience.com/satellite-measurements-warming-troposphere.htm
And if you want way too much information then follow John's link to this by Scott Church
http://www.scottchurchdirect.com/docs/MSU-Troposphere-Review01.pdf
In particular, his review of the work by Quiang Fu and others, looking at compensating for the fact that the T2 MSU's, that are used to read the lower & mid Troposphere temp's are affected by the fact that 15-20% of the signal is actually coming from the lower stratosphere. As a consequence of the fact that the stratosphere has cooled more than the troposphere has warmed, the satellite data products from both RSS & UAH are probably under reporting the actual temperature of the troposphere due to 'contamination' of the signal by cooling of the stratosphere.
Church's review is thorough but long - 137 pages. But definitely worth reading.
Meta-comment, over and out.
Neither Spencer & Christy nor Remote Sensing Systems uses a neural network in their processing of MSU/AMSU measurements. Both the UAH and RSS methods have been scrutinized pretty carefully at this point, and S&C of course have a personal inclination towards the "skeptic" camp. The actual estimation of temperatures from the MSUs is not especially controversial or difficult; most of the uncertainty in the trends (RSS vs UAH) comes from disagreements in how to handle the intercalibration of different copies of the instrument as one satellite is replaced by another in the POES constellation.
I do think it's pretty neat that the RSS temperature trend matches the GISS, NOAA, and HADCRUT surface temperature trends to the nearest 0.01C per decade ... given that no microwave temperature data are included in the surface reconstructions and no surface measurements are used in the processing of the satellite data.
Thanks! Just saw the link-its deliberate misinformation-it keeps referring to the same BS, "The Great Lakes Coastwatch data are likewise not merged with any of the global mean temperature records produced by NASA, NOAA, the University of East Anglia, the Japanese Meteorological Agency, or others." I don't doubt that the secondary Great Lakes Coastwatch data isn't not fed into other data sets-that's not the issue. The issue is the failure of the SOURCE of the data-NOAA-16.-the RAW data was corrupted before Coastwatch got it. That's why the satellite was taken off commission. The RAW data from NOAA-16 is as "degraded" as the sensor. NOAA has been selling their "degraded" data products to national and international researchers knowing it was junk at least since 2005/6 as affirmed by the evidence given to me by Dr Spencer and Dr Christy and others. No reports of any system 'Degradation" on the sensors appears on the official NOAA-16 Subsystem Summary. Interestingly I've been tipped off that the link in my article to NOAA's subsystem summary page is broken-evidently NOAA has not only removed the satellite's images last week from the web after publication of my first 'satellitegate' article, its now removed the official subsystem summary in the exact same circumstance- its panicking that the wider public will see the obvious fraud.
As for SkepticalScience, all I can say is they are VERY desperate to try that obvious trick. Please pass this info on in to others in case any one buys the BS they're peddling.
UNQUOTE.
You should also read his latest article “Top Climate Scientists Speak out on the Satellitegate Scandal” at http://canadafreepress.com/index.php/article/26603
Best regards, Pete Ridley
(1) The satellite-based global mean temperature record doesn't even use the same sensor as the Coastwatch project (the former use microwave radiometers, the latter uses a thermal infrared imager).
(2) As Alden Griffith noted way up at the top of the thread, neither UAH nor RSS uses any data from NOAA-16, the satellite in question.
In other words, there's absolutely no connection whatsoever between the occasional errors in the NOAA Coastwatch-funded Great Lakes temperature maps and the global mean temperature records cited as confirmatory evidence of climate change. They are completely unrelated data sets.
In any case, regardless of whether Mr O'Sullivan understands it, I'm sure you get this point now, right? It's not like the problems with Mr O'Sullivan's claims are obscure or subtle.
It might be interesting to have a discussion about the current state of the international constellation of earth observing satellites. Working in this field myself I have strong opinions about this issue.
But Mr O'Sullivan's column isn't really a good place to begin that kind of conversation, because of the way it's saturated with lurid and inflammatory claims of fraud, deception, etc.
I do think it's pretty neat that the RSS temperature trend matches the GISS, NOAA, and HADCRUT surface temperature trends to the nearest 0.01C per decade ...
Come on, get real. Exaggerated claims do not help us understand what's going on. With an RMS error of ~4°C of individual satellite temperature "measurements", as a rule of thumb, it would require about 16,000 statistically independent data points in a decade to bring the error margin down to 0.01°C. And only if the error is unbiased noise, which, considering the procedure applied (model fitting) is unlikely.
The RMS error is for an ensemble of "pixels": samples at the spatial resolution of the instrument, which is about 40 km x 40 km. Pixels at the equator are sampled twice per day and pixels at the poles about 14 times per day. There are about 320,000 pixels over the surface of the earth, or more than 640K samples per day. Over a decade this is more than 2.3 Gigasamples. What limits the accuracy of determination of a trend in Global Average Temperature are time dependent systematic errors, such as the orbital decay/diurnal correction. Just because one can only determine the temperature of a single pixel at one sample time to within a few degrees doesn't imply that one can't determine the global temperature trend over a decade to much higher accuracy using billions of samples.
There are about 320,000 pixels over the surface of the earth, or more than 640K samples per day
Don't try to tell me they run the model for each pixel independently. Of course they don't, because it would not make sense. But that reduces the degrees of freedom drastically (as it should).
The data for both are available online. Calculate the trends, 1979-present. One is +0.16 C/decade and the other is ... +0.16 C/decade.
So what if they don't (and they normally don't) run the model for each pixel independently? The RMS error is reduced whether averaging is done before or after modeling or in some combination of averaging before and after modeling. For example, RSS first calculates monthly averaged 2.5 x 2.5 angular degree cells. So there are "only" about 10,000 of these cells covering the earth. Each of these cells is composed of about 2000 elemental samples and have a significantly reduced RMS error compared to a single elemental sample. These are then modeled and the 10,000 x 12 x 10 = 1.2 million cell samples covering a global decade are used to compute a global temperature trend. As long as the modeling and other processing don't introduce a time dependent systematic error then a global temperature trend can be computed at much higher accuracy than the temperature of an individual pixel sample.
He then links to physicist Charles R. Anderson’s An Objectivist Individualist blog article “Satellite Temperature Record Now Unreliable” in which he starts “I have written many posts that our unreliable the ground surface temperature record, based on the collapsing network of weather stations around the world, is biased upward with the urban heat island effect and by obviously bad grid interpolation schemes. I had thought that the only reliable temperature records were the satellite and ocean buoy temperature records. I was wrong. It now appears that since at least 2005, the satellite temperature records have not been reliable”.
He concludes that “It is now perfectly clear that there are no reliable worldwide temperature records and that we have little more than anecdotal information on the temperature history of the Earth. There is clearly no basis for the claims that the Earth has warmed at unusual rates in recent times or that we know anything more than some local temperatures, mostly from urban heat effect zones”.
The bits in between are interesting too – enjoy.
NOTES:
1) see http://johnosullivan.livejournal.com/22385.html
2) see http://objectivistindividualist.blogspot.com/2010/08/satellite-temperature-record-now.html
Best regards, Pete Ridley
That's great news! Its a sure sign of success when the argument switches from 'oh no its not' to 'the data is no good'.
I defer to Conan-Doyle once again:
Watson: What do you suppose this means?
Holmes: I have no data. It is a capital mistake to theorize before one has data. Insensibly, one begins to twist facts to suit theory, instead of theories to suit facts. --A Scandal in Bohemia
Neither the UAH nor the RSS satellite temperature record uses any data from the AVHRR instrument. Neither the UAH nor the RSS satellite temperature record uses data from NOAA-16.
It doesn't really help promote informed discussion to persist in implying that there is a non-existent problem with the satellite temperature record.
I would also suggest that highly-politicized and ideological websites are probably not the best source of information on any scientific subject, particularly one as complex as climate change. I have visited several of the sites you've linked to, and been dismayed at the lurid and alarmist character of the writing. If that is representative of where you go to read about climate-related topics, I can only suggest that you at least keep an open mind and consider reading a bit more widely. Actual science is generally more interesting than propaganda, and a more worthwhile investment in the long run.
This is now beyond parody, as far as denial is concerned. Someone recently predicted that, now that the satellites were showing similar trends to ground-based measurements of temperatures, those in denial would turn about-face and decide that those records had to be denied somehow. And so it came to pass. Amazing and a wake-up call to those so-called skeptics who still have a trace of credibility left to rescue : look at the sort of people you are associating yourself with and see how their views are determined by pre-conceived beliefs a long, long way away from scientific reality.
ersstv3
Before that avhrr data were inter-calibrated using ship and buoy data and cloud/aerosol contamination removed.