Climate Science Glossary

Term Lookup

Enter a term in the search box to find its definition.

Settings

Use the controls in the far right panel to increase or decrease the number of terms automatically displayed (or to completely turn that feature off).

Term Lookup

Settings


All IPCC definitions taken from Climate Change 2007: The Physical Science Basis. Working Group I Contribution to the Fourth Assessment Report of the Intergovernmental Panel on Climate Change, Annex I, Glossary, pp. 941-954. Cambridge University Press.

Home Arguments Software Resources Comments The Consensus Project Translations About Support

Bluesky Facebook LinkedIn Mastodon MeWe

Twitter YouTube RSS Posts RSS Comments Email Subscribe


Climate's changed before
It's the sun
It's not bad
There is no consensus
It's cooling
Models are unreliable
Temp record is unreliable
Animals and plants can adapt
It hasn't warmed since 1998
Antarctica is gaining ice
View All Arguments...


Username
Password
New? Register here
Forgot your password?

Latest Posts

Archives

Climate cherry pickers: cooling oceans

Posted on 11 November 2010 by John Cook

Most of global warming, over 80%, go into the oceans. So the amount of heat building up in the oceans is of great interest to climate scientists (and the rest of us climate wonks peering in from the sidelines). Some claim that the oceans are actually cooling, arguing that this proves global warming isn't happening. For example, one paper uses a reconstruction from Argo data as evidence that the oceans are cooling (Loehle 2008):

Figure 1: Ocean heat content smoothed with 1-2-1 filter and overlaid with linear trend (Loehle 2008).

However, this doesn't give you the full picture - there are a number of teams that have reconstructed ocean heat from the various datasets available. In an effort to create the most reliable measure of ocean heat, members from the various teams across the world combined their efforts into a single 'best estimate' of ocean heat (Lyman 2010). What they found was robust warming in the upper ocean over the 16 years from 1993 to 2008.
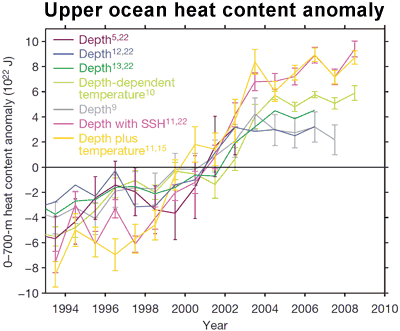
Upper ocean heat content anomaly
Figure 2: Ocean Heat Content anomaly from various teams. Ocean heat is calculated from 0 to 700 metres (Lyman 2010)
.

However, even this doesn't give you the full picture. These estimates are of heat content in the upper 700 metres of the ocean. Of course, the ocean goes much deeper than that. A fuller picture of ocean warming analyzes ocean temperature measurements by the Argo network, constructing a map of ocean heat content down to 2000 metres (von Schuckmann 2009). This finds significant ocean warming over the top 2000 metres of the ocean from 2003 to 2008.


Figure 3: Global ocean heat storage (0–2000 metres), measured in 108 Joules per square metre (von Schuckmann 2009).
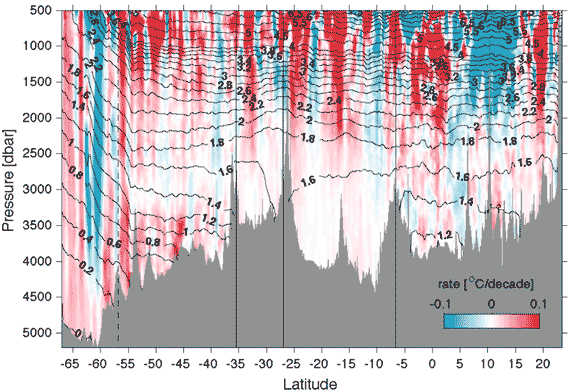
But wait, there's more! Even ocean heat down to 2000 metres doesn't extend all the way to the ocean depths. A recent paper (Purkey & Johnson 2010) reconstructed ocean heat warming down to abyssal depths, finding significant warming even at the bottom of the ocean (Doug Bostrom wrote a great blog post on this paper).

Figure 4: Rate of ocean warming. Areas of warming are shaded in red and regions of cooling are shaded in blue with intensity scaled by the magnitude of the warming. The basins from south to north are the Southeast Pacific Basin, Chile Basin, Peru Basin, and Pacific Basin (Purkey & Johnson 2010).

To properly understand what's happening with ocean warming, you need to take in the full picture. This means all the data and the whole ocean, not just the upper 700 metres. To claim the oceans are cooling is to ignore the full body of evidence.

0 0

Printable Version  |  Link to this page

Comments

Comments 1 to 41:

  1. Since La Nina cools global surface temperatures by cooler water upwelling from the depths to the surface and absorbing heat from the atmosphere, wouldn't La Nina accelerate the warming of the oceans by increasing the transfer of heat from the atmosphere into the oceans?
    0 0
  2. I'm not a scientist but that's the way I read it. La Nina is the absorbing phase, el Nino is the releasing phase for heat exchange between the atmosphere and the Pacific Ocean.
    0 0
  3. Wang and McPhaden (1998) discuss these effects in this paper, "The Surface-Layer Heat Balance in the Equatorial Pacific Ocean. Part I: Mean Seasonal Cycle" There is a complex interplay between vertical mixing, seasonal surface winds, and meridonal transport (N-S ocean currents). Overall, the ENSO cycle seems to be accelerating, which indicates more total energy in the system.
    0 0
  4. #3: "indicates more total energy in the system." More energy? Perhaps stated another way: the measure of the total energy of this type of system is ... temperature?
    0 0
  5. Karamanski: Here is Wang and McPhaden (2000) "The Surface-Layer Heat Balance in the Equatorial Pacific Ocean. Part II: Interannual Variability." This paper discusses the surface-layer heat balance on interannual timescales in the equatorial Pacific to determine the processes responsible for sea surface temperature (SST) variability. This seminal paper has been cited in 79 Articles published in peer-reviewed Scientific Journals, including 10 in the last year.
    0 0
  6. From Purkey & Johnson 2010, table 1, there is 0.1W/m2 of heat being stored in the deep ocean. The current TOA imbalance is 0.9W/m2 (Trenberth 2009). So only 11% of the extra heat is being stored in the deep oceans. The rest of the heat should already be noticed in the sea surface and atmosphere, but it's not (unless sensitivity is much lower than claimed). Related: my CAGW incoherence claim was never responded to (search for coherence, post 77).
    0 0
  7. @ Eric (skeptic): P & J 2010 do not rule out more of Trenberth's "missing heat" yet being found in the oceans deeps...or in the Argo/XBT errors. This is not yet a closed chapter.
    0 0
  8. Eric (skeptic) we al know the heat budget is not (yet) closed, but ... the current estimate of TOA imbalance is 0.85 +/- 0.15 W/m2. The upper 700 m of the oceans contributes 0.64 +/- 0.11 W/m2. The abyssal oceans adds some 0.1 W/m2, explicitly excluding Arctic Ocean and Nordic seas which we know are warming, so this is a lower bound. Add other smaller contributions, like land, ice and atmosphere. Do you really think we are that far away from closing the budget? Or, following Tremberth's call, we need a better measurements network?
    0 0
  9. muoncounter at 13:50 PM on 11 November, 2010 FWIW, Temperature is only one indicator of energy within a system. Given a set number of moles of water, there is a lot more energy in water at 0 degrees C than there is in ice at the same temperature, the same applies at the water-vapor boundary temperature. So, there is more energy in humid air at a given temperature than there is in drier air at the same, that is assuming other factors don't change. The heat content of a body of water depends not only on the temperature, but also on the composition of impurities within it. A moving mass has more energy, kinetic, than a still mass, or a mass moving at a lesser velocity; I'm thinking of winds and currents with this. There are other examples, but I hope you get the point. Kinetic energy tends to get distributed via friction to become thermal energy, which can be radiated, used to perform a phase state change, etc. Measuring temperature tends to put you in the right ballpark, but it would be a mistake to assume a direct correspondence.
    0 0
  10. Thank you for that info Riccardo. I now see some on the Trenberth's travesty page. My quick calculation for the .64 w/m2 is 10^22 Joules per year. If applied to 700m of ocean (approx 2.5 * 10^23 grams of water), that's 0.01 degrees of warming per year (although my estimate for the 700m ocean mass is probably high). So yes, we need a better measurements network, but perhaps impossible given the small change we will have to measure.
    0 0
  11. Eric (skeptic) I'm too lazy to check your numbers, but the data shows that it is indeed possible to measure the change in ocean heat content. Adding natural variability and it sure takes several years to confidently assess the trend.
    0 0
  12. #9: "Temperature is only one indicator of energy within a system. " Granted. But as AD points out, there is more interannual variability in the ocean system. We also saw this in a prior discussion on ENSO, particularly in the Timmerman paper I cited there. The tropical Pacific climate system is thus predicted to undergo strong changes if emissions of greenhouse gases continue to increase. The climatic effects will be threefold. First, the mean climate in the tropical Pacific region will change towards a state corresponding to present-day El Nino conditions. It is therefore likely that events typical of El Nino will also become more frequent. Second, a stronger interannual variability will be superimposed on the changes in the mean state, so year-to-year variations may become more extreme under enhanced greenhouse conditions. Third, the interannual variability will be more strongly skewed, with strong cold events (relative to the warmer mean state) becoming more frequent. And that was written in 1999.
    0 0
  13. 8.Riccardo I think it's more than just an issue of poor data set. The energy imbalance/ocean heat content was summed up by trenberth himself in the following image, the missing heat is the orange section of A. What Trenberth (and you) seem to be concerned with is only 5 years of data in a 15 year data set. If we follow your logic, that the data set is poor, we should possibly doubt all the data including the previous 10+ years when OHC and net radiation matched well. Few people seem to be concerned with doing that. That suggests to me that actually what is going on here is that Trenberth (and possibly you) are trying to fit the data to the theory, when that doesn't happen (after 2005) then you blame the data. What really backs this up for me is that the post 2005 data should actually be the more robust/accurate/believable data set given that it is based on a technology that was specifcally designed to answer this question. I just wonder whether you are willing to dismiss the pre-2005 data in the same way you dismiss the post-2005 data. I know this argument is going to breakdown into which data is better in an unresolved way, it would be nice if we could avoid that. What I'd really like to be convinced of is that the quality of the OHC data isn't questioned at this point because it no longer fits the greater theory. My guess is pre-2005 little time would be taken in wondering about the OHC data because it seemed to fit so well with net radiation.
    0 0
    Response: "what is going on here is that Trenberth (and possibly you) are trying to fit the data to the theory"

    What Trenberth is trying to do is fit data to data, not theory to data. Eg - he has two metrics of the same phenomenon - the planetary energy imbalance. One is measured by satellites which measures energy coming in and out, the other by the accumulation of ocean heat. Satellites find that the planet's energy imbalance has gradually been increasing. So had ocean heat until around 2005. Note that ocean heat measurements still find a positive energy imbalance - the planet is still accumulating heat - just not as much as the satellite data at the moment.

    Scientists are scrutinising both the satellite and ocean data even as more data comes in and I expect the discrepancy will be resolved over the next few years. Here on the blogosphere where we breathlessly monitor monthly updates to every climate metric imaginable (guilty as charged), the long wait for resolution is a little painful.
  14. HumanityRules it's not my habit to dismiss any data untill they're proved wrong, which is not the case here. Hence I don't dismiss neither pre- nor post- 2005 data. We are talking about a few years of disagreement between different different parts of the energy balance. As you may recognize in my comment #8, I did not split the time scale in two. I simply said that yes, the budget isn't closed yet but that it's not by that much; and I expressed hope that a better tracking of the energy flows will do the job. I'd like to point out that this issue is not about anthropogenic global warming, I can't see any reason why we should split in two sides, skeptics and supporters of AGW. We simply can't close the budget. There must be something missing or measured not accurately enough to track energy on short time scales to account for natural variability. This is the famous Trenberth's travesty.
    0 0
  15. Response to #13 I take your point, maybe I should have been a little more clear, Trenberth is interpreting the data as to best maintain strength in the overall theory of AGW. Everything you say is fine the problem is there are several conclusions that can be drawn from that predictament. My argument is that Trenberth, possibly Riccardo and possibly John Cook in this article all prefer to focus on the conclusion that maintains the theory, in this case by critising the data set. The fact that as you suggest things remain unresolved seem to necessitate the possibility that this issue may resolve in multiple ways. My suggestion is that criticism is specifically aimed only at the data that no longer fits with the overall theory (the resumption being the pre-2005 data is fine because it fits with preconceived notions). There's no real harm in either Riccardo or John holding this position on the blogosphere, there is great harm in Trenberth doing it is the scientific literature. I like the uncertainty expressed in the "long wait for resolution" it's just a pity it doesn't seem to be expressed well in the original article.
    0 0
  16. 14.Riccardo "I can't see any reason why we should split in two sides, skeptics and supporters of AGW. We simply can't close the budget" I agree with the second statement. And if this was purely a scienctific issue I'd agree with the first but unfortunately it isn't. There is uncertainty introduced by statements such as "We simply can't close the budget". The translation from science to comment and policy seeks to reduce that uncertainty. At times I think the scientists seek to reduce that uncertainty in a way that goes beyond the science. It's clear in the many recent articles and comments by Trenberth that he is only willing to publicly concede one way in which this problem is likely to be resolved (by improved ARGO data). That is I think where the two sides have to split. Not in the the scientific problem, we simply can't close the budget, but in the interpretation of what the problem means. (Maybe I've been reading too much about uncertainty at Judith Curry's)
    0 0
  17. Sorry for the interruption, but ... HumanityRules, two days ago you made some very critical remarks about GISS's report 2010 - How Warm Was This Summer?. You claimed that the report failed to include caveats about the role of El Nino in contributing to temperature records, and you suggested that this was a deliberate omission by GISS: Obviously they don't because any description of natural variability would confuse the message. You then observed that whether 2010 breaks a calendar-year record or not depends on how rapidly La Nina develops, and that if it does break a record that would be partially due to the effects of El Nino in the first half of the year. As I then replied in that thread, the GISS report you cite so dismissively actually discusses natural climate variability, the ENSO cycle, and its influence on annual temperature records in great detail. In what is only a 16-paragraph report, they refer to ENSO around a dozen times. And they clearly state that (a) whether 2010 breaks the record will depend on how rapidly La Nina develops, and (b) if 2010 does break the record it will be partially (but not entirely) due to the lingering effect of El Nino. In other words, GISS wrote exactly what you criticized them for not writing. Your comments seem so wildly off-base that I rather suspect that you didn't actually read the report before dismissing it. My guess is that you have a pre-existing assumption that GISS are a bunch of alarmists, and so obviously any report they write about a record-warm summer would be nothing but AGW hype. Or perhaps you were just echoing things you've read at "skeptical" sites elsewhere? In any case, it's off topic for this thread, and I'm sorry for the interruption, but I for one would appreciate some explanation from HumanityRules for her/his inexplicable remarks over on the original thread.
    0 0
  18. Humanity Rules #13, #16 Excellent comments HR. What the promoters of CO2GHG theory have to consider is that the total sum of the forcings is what counts. If S-B cooling and cloud albedo cooling are offsetting CO2GHG warming and WV feedbacks at such a scale that warming is flattening or being arrested - then the accumulation of energy in the biosphere must also be flattening. Dr Trenberth found a theoretical 'observed' 145E20 Joules/year energy imbalance (0.9 W/sq.m) with a 'residual' of 30-100E20 Joules/year unaccounted. ie Av 65E20 Joules/year out of 145E20 Joules/year is unaccounted. This is 80/145 or 0.5/0.4W/sq.m split. What must be explained is that better measurement by Argo since 2004 shows flattening increase (or no increase) in OHC at a period when CO2GHG warming and WV feedback are at their highest theoretical levels. If better measurement of OHC content converges on less OHC increase then other cooling factors must be at play - cloud albedo and S-B are prime candidates.
    0 0
  19. #18 Ken Lambert at 01:38 AM on 13 November, 2010 Dr Trenberth found a theoretical 'observed' 145E20 Joules/year energy imbalance (0.9 W/sq.m) For God's sake! There is no such a thing as "theoretical 'observed' energy imbalance". It is either theoretical or observed. Now, Trenberth 2009 is clear enough.
    1. The observed imbalance is 6.4 W/m2
    2. This observation is inconsistent width model calculations
    3. Therefore observed imbalance is crap, models must be correct
    "There is a TOA imbalance of 6.4 Wm-2 from CERES data and this is outside of the realm of current estimates of global imbalances (Willis et al. 2004; Hansen et al. 2005; Huang 2006) that are expected from observed increases in carbon dioxide and other greenhouse gases in the atmosphere. The TOA energy imbalance can probably be most accurately determined from climate models and is estimated to be 0.85 ±0.15 W m-2 by Hansen et al. (2005) and is supported by estimated recent changes in ocean heat content (Willis et al. 2004; Hansen et al. 2005)." It is non sequitur at its finest. A 6.4 Wm-2 is of course impossible (it happily belongs to the "Had I had three legs it would not have gone unnoticed" category). But from the fact a particular kind of measurement (satellite measured imbalance at TOA) is unreliable, there is no legitimate way to conclude another estimate (quasi-theoretical inference using computational climate models) is correct. The best we can say is it's either correct or not. As it is also inconsistent with ARGO OHC measurements, it suggests ARGO is either crap or not. Trenberth is only willing to consider the former possibility, but the latter one (implying computational climate models are seriously flawed) is a very real possibility at the moment.
    0 0
  20. Re: Berényi Péter (19) Nice comment. I must point out, however, that in the previous instances where a major disconnect was found between the models and measured data (such as with satellite data and Argo ocean data), there were found to be errors in the data collection. Once corrected, the data were then found to match the models. For serious flaws to exist in the models, which are based on the physics of our world, it is very likely that this would have been noted before now. Unless you have evidence to the contrary and a physics-based theory that explains why the models match reality the vast majority of the time for everything but OHC data? The jury is still out on how reflective of OHC the depth (sorry, no pun intended) and breadth of the Argo/XBT data is. While a great resource, it must be considered part of an incomplete picture of OHC and incapable of closing the global energy budget gap. The Yooper
    0 0
  21. HumanityRules there's one point i think is missing/misinterpreted about Trenberth's remarks. Trenberth is talking about variability and I assume we all agree that we do not yet have the capability to follow the enregy flow over the short time period. Don't forget that we're talking about a time span of a few years, which does not have any particular meaning as far as the big picture is concerned. This is why we should like to have a better measurement system, not because it could in any way change/confirm what we already know but because we may learn a lot about some details of our climate system.
    0 0
  22. "Note that ocean heat measurements still find a positive energy imbalance - the planet is still accumulating heat - just not as much as the satellite data at the moment." Dont lose sight of the fact that it could be the satellite data that is wrong. Satellite data due to its complexity is far from a slam dunk its entirely possible the corrections need to be made to it and not the OHC data (or even some combination of the two but how would we know?) Its easy to put a stake in the ground and declare the satellite data as the "truth" in this, but that in itself is a significant assumption considering satellite data itself goes through processes of correction.
    0 0
  23. Bah, I should have kept reading. Re: Berényi Péter's comments ...Yeah, what he said :-)
    0 0
  24. And one final comment re : Daniel Bailey's comment, Which model do you choose? The ensembles are very course in their predictions and dont appear to have any particular specific skill over relatively short timescales.
    0 0
  25. BP #19 Note that I have used THEORETICAL 'observed' in parenthesis BP. I am well aware of the fact that the REAL observed number from CERES is 6.4W/sq.m. You should read more of my pieces on this blog. I got pilloried here making your point on MODELS: http://www.skepticalscience.com/Real-experts-dont-know-everything.html#30319 on "Real experts don't know everything" I was taking the 145E20 Joule number from Trenberth's Aug09 paper Table 1: http://www.cgd.ucar.edu/cas/Trenberth/trenberth.papers/EnergyDiagnostics09final2.pdf Note that 'Observed' is used in Trenberth's Table 1 and the text pp23 notes that "The net imbalance is estimated to be 0.9W/sq.m" Trenberth reconciles the 0.9W/sq.m number in Figure 4 of the same paper which uses the IPCC AR4 Fig 2.4 Table of forcings PLUS climate responses - S-B radiative feedback of -2.8W/sq.m and WV + Ice Albedo feedbacks of +2.1W/sq.m He derives the S-B cooling from a 0.75degK increase in surface temperature since a AD1750. WV and Ice Albedo positive feedback +2.1W/sq.m is from Trenberth and Fasulo - an approximation. Perhaps you could turn your considerable (and oft referenced by me)talents to the history of this major climate response feedback (WV + Ice albedo) and whether it is real or theoretical too!!
    0 0
  26. #20 Daniel Bailey at 00:53 AM on 14 November, 2010 For serious flaws to exist in the models, which are based on the physics of our world, it is very likely that this would have been noted before now. Unless you have evidence to the contrary and a physics-based theory that explains why the models match reality the vast majority of the time for everything but OHC data? Computational climate models do not even match each other, much less reality. It is also a myth they are based on physics. They do incorporate some physics as their resolution permits, but on a sub-grid scale all the physics is gone, replaced by parametrization. Using these degrees of freedom it is easy to fit model output to a finite body of (past) data, in fact it can be done in a multitude of ways. But their predictive power is seriously compromised by this step. Also, it is not just OHC that models have problems with. Trend of water vapor in the upper troposphere (above the 700 mbar level) as measured by balloon radiosonde probes is also inconsistent with practically all computational model predictions. Therefore this (huge) body of evidence is simply dismissed by modelers as unreliable. BTW, this is general practice in mainstream climate science. Whenever measurements don't conform to theory, they are adjusted until a fair match is achieved. Just have a look at the adjustment statistics that was done to USHCN (United States Historic Climatology Network). One would expect some measurement error in a long timespan over a huge area like the US, but none that would require adjustments with such a clear trend. That's ridiculous. The difference between USHCN and GHCN (Global Historic Climatology Network) is that in the former case adjustments are at least made explicitly, while for the global network (outside the US) adjustments are made to the raw data before they'd have a chance to get into the database. It's not even adjustment, it is plain data torturing. As for OHC, Trenberth himself says before 2003 OHC was seriously undersampled. In fact it was only mid-2003 when ARGO coverage got sufficiently dense and uniform. Still, most of the supposed warming of oceans happened prior to that date and it is measured to be flat since then by ARGO. It is of course possible there is some as yet undiscovered imperfection in the ARGO fleet, but it is extremely unlikely ARGO data are more unreliable than the intermittent and undersampled XBT/MBT data before. Satellite ASR (Absorbed Shortwave Radiation) and OLR (Outgoing Longwave Radiation) measurements go back in time well before the introduction of the ARGO system. They are evidently not good enough to give a useful value for the energy budget, as the long term difference between the two values is about 6.4 W/m2, which is impossible. If Earth would gain thermal energy on such a huge rate, everything would be different. There is simply no chance it would have gone unnoticed. However, even if accuracy of satellite measured energy budget is poor, its precision is much better. It means if there were a change in the rate the climate system gains (or loses) energy, it would show up in the satellite data. Difference of ASR and OLR is supposed to be roughly proportional to the temporal derivative of OHC (Ocean Heat Content works as an integrator). If the NOAA NODC OCL reconstruction were correct, there would be a step-like drop in the derivative of OHC around mid-2003. In fact nothing like that is seen in satellite measured difference of ASR and OLR. If we accept satellite measurements are precise enough and ARGO is better than XBT/MBT, then OHC reconstruction before 2003 is crap. That is, if offset of satellite measurements is calibrated against ARGO data, then the huge increase of OHC between 1990 and 2003 is an artifact. It means Trenberth's missing heat should be looked for in the past (like 20 years ago). I am surprised greatly this possibility is not explored in the literature. This alone shows how biased the so called mainstream has become.
    0 0
  27. BP wrote:
    Computational climate models do not even match each other, much less reality. It is also a myth they are based on physics. They do incorporate some physics as their resolution permits, but on a sub-grid scale all the physics is gone, replaced by parametrization. Using these degrees of freedom it is easy to fit model output to a finite body of (past) data, in fact it can be done in a multitude of ways.
    You are incorrect in assuming that parameterization gives climatologists free reign. See my comments 267 and 269 on the "Models are Unreliable" thread. On that same thread, see also the comments 263 by e and 268 by muoncounter.
    0 0
    Moderator Response: If anybody wants to further discuss parameterization, please do so on the thread Models are unreliable.
  28. The extremely slow rise in sea level indicates that there is not wide spread warming occuring. http://tidesandcurrents.noaa.gov/sltrends/sltrends_station.shtml?stnid=1619910
    0 0
    Response: "extremely slow rise in sea level indicates that there is not wide spread warming occuring"

    The key here is that you've used sea level at a single location to infer there's no "wide spread warming". A single location is not a good indicator of global sea level as individual locations can be influenced by local subsiding rates, tectonic uplift, varying rates of thermal expansion due to regional ocean warming, etc. A better metric for "wide spread warming" is global sea level:


    For more info, see our page on sea level rise.
  29. Re: Camburn (28) Why do you select a chart showing sea level rise at one tide station (which shows the sea level rising at that station) and then point to it as an example that:
    "there is not wide spread warming occuring."
    What does sea level rise at Midway Atoll have to do with warming? How about re-phrasing the point you wanted to make so that my partially non-functional brain can understand it. Thanks! The Yooper
    0 0
  30. Daniel: I could show a chart showing negative sea level rise. I question the metrics of Jason/Topex. If they are as accurate as Grace was with the mass of ice loss, then they are inacurate. I picked on station in the middle of the Pacific. I was surprised at what NOAA had as I thought it would be more of a rise in the middle of the Pacific Ocean. The tidal effects etc would be minimal in that area. In response to the moderator: I am sure that NOAA uses the latest tech when reporting sea levels by guage.
    0 0
  31. Re: Camburn (30) You might be better served with investigating yourself the intricacies of both satellite altimetry and microwave sounding unit platforms: Here's an Open Mind piece Tamino did on the overall history and data corrections performed on orbital MSU platforms (rescued from Internet cache files), as well as a Skeptical Science piece on MSU satellite platforms. As far as Jason/Topex/Poseidon, a Skeptical Science piece on that can be found here, as well as one on sea level rise. Documentation on Jason/Topex/Poseidon corrections can be found here. Global altimetry data can be found here, if you're inclined to poke under the hood yourself. Geoid differences can play havoc with expectations surrounding sea levels. Hope that helps, The Yooper
    0 0
  32. Thank you Yooper.
    0 0
  33. Re: Camburn (30, 32) One more thing: Robert Way takes a very insightful look into the GRACE issue here. Topical, timely, worth the read. The Yooper
    0 0
  34. BP #26 Some knockout points BP. I am indebted to you for opening my eyes to the OHC story and the impossible jumps and bumps in the von Schukmann graph and the critical point that OHC increase must be the integral of the TOA forcing imbalance wrt time to be consistent with the first law. The impossible jumps OHC in the 2003-04 period can only be explained by dud Argo measurements OR as an offset - an artifact of the transition. My contention is that Argo is also not perfect and the 'gold standard' is a tethered buoy system measuring the same tile of ocean at the same referenced time T1 and again at T2 all over the planet as the only accurate way of measuring OHC differences over the T2 - T1 period. How close Argo comes to that 'gold standard' no-one seems to know. The SLR graphs showing TOPEX spliced to Jason also are candidates for offsets at the transition where the SLR slope has reduced with Jason compared with TOPEX. Strenuous effort has been made by AGW protagonists to claim that these transitions are calibrated to be seamless, however the point is made that the latest satellite instruments must be more accurate and repeatable than earlier instruments with diferent gains and inferior technology. Also no-one is seeming to splice TSI measuring satellites together into a continuous record probably due to a -4.5W/sq.m unresolved difference in the latest SORCE TIMS satellites and prior measurements by earlier satellites. That is one helluva offset.
    0 0
  35. Ken Lambert - Actually, there is considerable and ongoing effort in merging together and cross-calibrating TSI series, as I have referred you to previously. See here and here. Those are the top two results from googling "satellite TSI", hardly difficult to find. Your statement (that TSI measurements aren't being merged) is simply not correct. On your other argument, regarding time integrated TOA imbalances - I consider the closed loop integration you have been pushing to be overvaluing the accuracy of the various measurements over the last 150 years. You don't seem (IMO) to be treating the TSI, TOA infrared, and various forcings with the caution needed given the accuracy of our knowledge, and interpolate from 1750 on assuming perfect accuracy. That's simply not supportable. What we do know, and have measured, are not absolute TSI's and forcings, but rather time-resolved points of deltas in forcings; when they have changed to some extent. And we can correlate those with multiply-supported temperature changes to determine the dominant forcings and responses over time. Your black-box integration from 1750 on (assuming perfect knowledge) leads to contradictions with deltas, orders of magnitude, and observed responses. You are simply too focused on what you see as absolute values.
    0 0
  36. KL #34 You can't have your cake and eat it you know. Making (correct) claims that particular measurements are too imprecise to be terribly useful is one thing. Following on from that your argument then assumes that these measurements have a very high degree of precision (or at least we can ignore the uncertainty). This by itself invalidates your argument. There may be a useful contribution you can make here, but at present it appears to be through (like BP) being a useful case study of the faulty reasoning of so-called climate sceptics.
    0 0
  37. KR #35 & kdkd #36 Had a look at the ACRIM and PMOD satellite TSI series. It is a somewhat confused picture with ACRIM Composite being written up as the best of the ACRIM 1,2,3 satellite reconstructions compared with PMOD which is somehow model based. Even then ACRIM produced a positive trend over the last 30 years equal to about +0.1W/sq.m (0.04%)solar radiation at the surface, whereas PMOD seems a negative or no trend. My main point was that none of these reconstruction uses SORCE TIMS or can explain the -4.5W/sq.m absolute difference in TSI. In fact the SORCE people produced their own Earth's energy flux balance chart (a la Dr Trenberth's famous chart) based on a TSI of 1361.5 W/sq.m rather than 1366 W/sq.m. Apparently it was crap according to a leading climate scientist. Your point about differences and deltas being the important determinant of trends is correct, provided we know what is happening at start time T1 with the particular forcing we are examining. Overriding this is BP's point that when you look at the satellite TOA imbalance data for the 2002-04 period there is no significant delta at all, see here: http://www.skepticalscience.com/news.php?p=2&t=107&&n=178#12580 when OHC content charts quoted above show a big leap. That is why high precision (month-month or year-year with same instrument) but low accuracy satellite data must be looked on as much more reliable than transitional XBT-Argo data measuring OHC. kdkd makes an interesting point. Clearly we have to try and pick winners here. Sort which data is crap and which might be close to correct. When there is conflicting data - the method is to look at its nature and try to find logical reasons why one might be good enough to be useful and the other not so. Satellite deltas verses XBT to Argo transition is a no brainer I would have thought.
    0 0
  38. "What we do know, and have measured, are not absolute TSI's and forcings, but rather time-resolved points of deltas in forcings; when they have changed to some extent." Even our knowledge of TSI has been based on significant and invalid assumption. Haigh et al. using the new SIM data show that where we thought a decrease in "TSI" should mean decreased radiation reaching the surface, the makeup of the TSI matters and is non-intuitive and not previously measured. This new knowledge could have significant ramifications to climate science.
    0 0
  39. KL #37 "kdkd makes an interesting point. Clearly we have to try and pick winners here. Sort which data is crap and which might be close to correct. When there is conflicting data - the method is to look at its nature and try to find logical reasons why one might be good enough to be useful and the other not so." Indeed I do. Concentrating on the lame horses (with good genes) at the back of the field instead of the front-runners seems to be a strange way to pick winners. Or in other words, the lack of precision of the OHC and TSI measures do not falsify the other strong coherent evidence for anthropogenic global warming.
    0 0
  40. kdkd Well it was a good 'orse - took all 13 of the others to beat it...
    0 0
  41. TimTTM #38 I saw this paper somewhere before. Certainly is counter-intuitive, but if it is confirmed then it will certainly have significant effect on the incoming solar radiation budget. Can't say anymore than that.
    0 0

You need to be logged in to post a comment. Login via the left margin or if you're new, register here.


The Consensus Project Website

THE ESCALATOR

(free to republish)


© Copyright 2024 John Cook
Home | Translations | About Us | Privacy | Contact Us