Satellite measurements of warming in the troposphere
The skeptic argument...
Satellites show no warming in the troposphere
"Satellite measurements indicate an absence of significant global warming since 1979, the very period that human carbon dioxide emissions have been increasing rapidly. The satellite data signal not only the absence of substantial human-induced warming but also provide an empirical test of the greenhouse hypothesis - a test that the hypothesis fails." (Bob Carter)
What the science says...
| Select a level... |
Basic
|
Intermediate
|
Advanced
| ||||
| Satellite measurements match model results apart from in the tropics. There is uncertainty with the tropical data due to how various teams correct for satellite drift. The U.S. Climate Change Science Program concludes the discrepancy is most likely due to data errors. | |||||||
From 1978, a series of satellites have measured atmospheric temperature in the troposphere and stratosphere. The data is spliced together and adjusted for time-dependent biases by the University of Alabama in Huntsville (UAH), headed by John Christy and Roy Spencer. The initial results showed a warming trend of only 0.09°C per decade, well below the surface temperature trend of 0.17°C per decade. Climate models predict the troposphere should show greater warming than the surface.
UAH versus RSS
In November 2005, Carl Mears and Frank Wentz at Remote Sensing Systems (RSS) performed an independent analysis of the satellite data. In the process, they found an algebraic error in the UAH analysis. With the correction made, the UAH trend was now 0.12°C per decade - larger but still less than the surface trend. However, RSS released their own results based on their data analysis - a trend of 0.19°C per decade.
Figure 1: UAH satellite data (red) compared to RSS satellite data (green) and surface measurements (blue). Image courtesy of Global Warming Art.
Correcting for diurnal drift
Part of the discrepancy between UAH and RSS was the methods used to splice the data from different satellites together. However, the major source of discrepancy was the way they corrected for diurnal drift (Mears et al 2005). The satellites orbit the earth from pole to pole. The satellites possess no propulsion so slowly over time, the local equator crossing time (LECT) changes. This is exacerbated by decay of the satellites orbital height, dragged down by the thin atmosphere. As a satellite's LECT changes, it takes readings at changing local times, allowing local diurnal cycle variations to appear as spurious trends (Christy et al 2000).
UAH and RSS employed different methods to adjust for diurnal drift and the results are radically different.

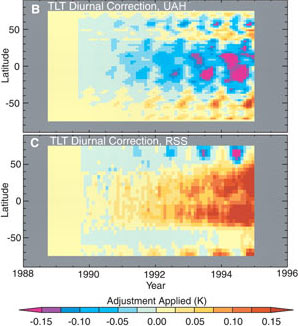
Figure 2: Diurnal drift corrections by UAH and RSS. UAH corrections add an overall cooling effect. RSS corrections added an overall warming effect. Both teams show strongest corrections in the tropics but in opposite directions.
So where does that leave us? An "Executive Summary" by the U.S. Climate Change Science Program, co-authored by John Christy of UAH concludes:
"Previously reported discrepancies between the amount of warming near the surface and higher in the atmosphere have been used to challenge the reliability of climate models and the reality of human induced global warming. This significant discrepancy no longer exists because errors in the satellite and radiosonde data have been identified and corrected. While these data are consistent with the results from climate models at the global scale, discrepancies in the tropics remain to be resolved.
This difference between models and observations may arise from errors that are common to all models, from errors in the observational data sets, or from a combination of these factors. The second explanation is favored, but the issue is still open."
In other words, according to UAH, satellite measurements match the models apart from in the tropics. This error is most likely due to data errors. According to RSS, satellites are in good agreement with models.
Last updated on 26 June 2010 by John Cook.

Arguments


Basic
Intermediate
Advanced


According to this data, the AVERAGE GLOBAL TEMPERATURE for the first 8 months of 2008 is LOWER than the average from 2000 thru 2007 by an amount equal to 46.7% of the total linearized increase (NOAA data) during the 20th century. Since 2000, the CARBON DIOXIDE LEVEL HAS INCREASED by 13.6% of the total increase since the start of the Industrial Revolution.
From then on there is a further large rise peaking in 2005 at +0.3C and then falling back to +0.1C
From 1998 on the graph seems to include two events which have pushed the GMT well above mean.
The CO2 record shows a ggod correlation to GMT fluctuations AND a spike in 1998 and subsequent spikes at the 'right' places...but the scale effect is wrong.
1998 shows +0.5C when the CO2 rise was 1.0ppm (97-98)
Later CO2 increases of the same magnitude are not matched by similar Temp rises.
It seems some other factors are at work..??
By using the year on year change in CO2 plotted against GMT yearly change you get a remarkable match...
I then factored the CO2 to get the 1998 peaks to align and then ALMOST ALL the peaks/troughs from 1978 onwards line up.
Unfortunately can't find a way to put the graph on here!
But you can always do it yourself ( unless someone tells me how to post it)
http://wattsupwiththat.com/2009/01/18/giss-divergence-with-satellite-temperatures-since-the-start-of-2003/
Doesn't it bother you, that every bit of new evidence that comes along that goes against the 'global human warming trend', is routinely dismissed with further 'data corrections'. Doesn't human bias mean anything to you?
As soon as anyone starts making corrections, you can pretty much guarantee that such data becomes contaminated by human bias. Historians know this. Medical researchers know this. No mention of such here. Unbelievably naive.
Karl Marx in the 19th century scoffed at the idea that factory managers running the economy would be even tempted to corrupt data, or distort process, or exploit the system or the workers. He also said the 'state' would wither away under such a system (note: it got bigger). Christians think everything in the New Testament, after hundreds of years of 'corrections' to the concoted manuscripts, accurately reflects what occurred in the 1st century.
What a load of mumbo jumbo. I wouldn't trust these 'corrections' with a ten foot pole, and I don't know how someone could be so naive as to think that academic/ bureaucrats can be trusted with such numerous 'corrections'.
'What the science says'. Communists would have said 'what the Party/Stalin/Our dear Leader says', christians would say 'what the bible says' (even when it doesn't), and this website claims corrections that support global warming by humans is 'what the "science" says'. Or is it what a few academic /bureaucrats want it to say?
According to the discussion above, corrections by RSS had to be done twice (once by people 'within' RSS, once by RSS-what is the difference??), to get the desired result. This is known as a) cooking and b) re-cooking the cooking. Isn't one cooking enough? What a joke. I'm sure Stalin would have only needed one cooking, or the cookers above would have all been Gulaged.
If there really was issues with splicing and diurnal drifts etc, then discrepancies should go both ways. They don't-they nearly always get cooked upwards. If you cook the data long enough, you get chocolate coated global warming.
A telling statement concludes at the end "this error is most likely due to data errors", referring to discrepancies between satellite measurements and model predictions in the tropics. There are at least 3 errors and/or bias evident in this statement.
1) it is not an 'error', it is a difference between a model and a prediction, to say it is an error is to assume the data is wrong, not the model. The statements preceeding it say no such thing, they say the issue is still open, NOT that there is an error.You have pre-assumed a conclusion, and it is therefore a distorted statement.
2)The statements previous to this do not say 'it is most likely due to data errors', you yourself have concluded and enhanced this, from the previous paragraphs, and you are also asserting it is what John Christy etc says-he simply says 'the issue is still open', and doesnt mention anything about 'likelihood'-you have added this yourself. This is what is known as cooking and re-cooking, to get a desired result. If the same was done to the data, it would be invalid.
3) And also, you have repeated the word 'error' twice in this sentence, just to re-cook it, again. You have preassumed a conclusion, and cooked the statement twice. Stalin would not have been impressed, and would have advised that one cooking would have sufficed, or the GULAG.
Then again, with this naivety, I could always send this website details of how they have access to millions of dollars in Nigerian oil money...
Real science has *never* been based on consensus -- it has been driven by those that are usually well outside the consensus. Otherwise, we'd all believe that the earth was the center of our universe.
The lack of real, public debate on what may be the most important issue of our time does not exist. That is frightening.
http://sciencespeak.com/MissingSignature.pdf
This is a discussion by David Evans of the radiosonde data 1879-1999 which appears to show that there is no tropical hotspot. Since a tropical hotspot is a feature of the positive feedback due to water vapour, assumed by IPCC models, is this not a clear disproof of predictions of significant AGW?
http://spacescience.spaceref.com/newhome/headlines/essd06oct97_1.htm
The page begins:
Accurate "Thermometers" in Space
The State of Climate Measurement Science
October 2, 1997
Just how accurate are space-based measurements of the temperature of the Earth's atmosphere? In a recent edition of Nature, scientists Dr. John Christy of the University of Alabama in Huntsville, and Dr. Roy Spencer of NASA/Marshall describe in detail just how reliable these measurements are....
point those guy to this post. It stars exactly with the issue of flawed UAH data analisys; the webpage they link is old, well before the flaw was corrected.
Suppose that the tropospheric warming relative to the surface warming were less than the models predict.
Won't that end up making the climate sensitivity bigger, not smaller?
The troposphere is where heat is radiated back into space, so if it's responding less than expected to a forcing, then the result is less heat radiated from the earth = more heat retained = more temperature increase?
How was the expectation derived?
Did it include, for example, heat transfer to oceans?
Did it include increased rates of evaporation (due to surface warmth) and consequently of condensation/precipitation ("Water cycle"). Water molecules absorb sensible energy at the surface when they evaporate, and re-release that energy at whatever tropospheric height when they re-condense. That is, intensification of the water cycle results in energy "bypassing" tropospheric greenhouse gases as it departs earth.
(Also, surface layers of ocean are now rather less opaque than previously thought (lower densities of phytoplankton), then insolation is penetrating to greater depths. This would tend to decrease surface temperatures because energy is not being absorbed at surface.)
I just had a "skeptic" tell me that the satellite data is biased because they were launched in 1978 which was "one of the coldest periods on record". This was his "proof", a post from Steven Goddard:
http://www.real-science.com/dessler-partially-correct
The temperature data comes from a *single* location in Greenland (Nuuk)!
Lack of consistency between modeled and observed temperature trends
It attacks CCSP's modeling as being "an artifact."
[DB] Please, no All-Caps.
[JH]CCSP = US Climate Change Science Program.1) It is an opinion piece, an article, not a peer-reviewed scientific paper;
2) Note the provenance: it was published in ENERGY & ENVIRONMENT VOLUME 22 No. 4 2011, which is an organ of the fossil fuel industry, not a scientific journal.
So, the article fails the test of credibility right at the outset. Prudence dictates it should be regarded as a suspect source unless and until it is published in the formal scientific manner.
I note that Singer has authored work which has been debunked here and elsewhere, but I am not dismissing this article on that ground.
Fred Singer Denies Global Warming
Singer makes a number of claims about the Santer study, but the primary one is that the modeled results do not match UAH satellite observations. This is essentially the same song and dance we've been hearing from Spencer & Christy (the developers of the UAH record) and debunked here.
Finally, his history should be considered. This is Fred Singer. Name a major instance of 'scientific' denial in the past 40 years and he has been part of it. Tobacco doesn't cause cancer, asbestos is safe, acid rain doesn't exist, there is no danger from ozone depletion, et cetera... he was involved in all of them. No, his track record does not prove that he is wrong about AGW too... but it certainly shouldn't inspire confidence.
Roy Spencer's latest claim that the tropospheric temperature proves the models wrong, has been aptly shot full of holes by Glenn Tamblyn and others. For example, Spencer compared temperature observations from only the tropics, to model results between 20 and 20 latitudes. Spencer compared model results for the surface, to observations of the "middle troposphere." Spencer's observations of the "middle troposphere" actually are 1/4 from the stratosphere, which of course cools as a consequence of increased greenhouse gases.