


 Arguments


Various estimates of Greenland ice loss
Posted on 28 February 2011 by John Cook
Over the last few weeks, three different papers have been published that all examine ice loss from the Greenland ice sheet. What's interesting is all three papers use entirely different methods to measure the rate of ice loss. Even more interesting is that these three different methods paint a consistent picture of what's happening to Greenland.
Schrama et al 2011 uses gravity measurements from the GRACE satellites to determine any change in mass of the Greenland ice sheet (there's a great article The Riddle of the ice about Ernst Schrama's work). They find from March 2003 to February 2010, Greenland lost ice mass at a rate of 252 gigatonnes per year. A key result from their paper was to confirm that ice loss had spread to the north west of Greenland.

Figure 1: Ice mass anomaly of the Greenland ice sheet as measured by GRACE gravity satellites (Schrama et al 2011).
Another paper Zwally et al 2011 uses satellite altimetry to determine the thickness of the Greenland ice sheet. They calculate that over 2003 to 2007, the ice sheet was losing ice at a rate of 171 gigatonnes per year. They then compare this to radar and airborne altimetry data from the 1990s. From 1992 to 2002, Greenland was only losing 7 gigatonnes per year.
Lastly, Rignot 2011 uses the Mass Balance Method to construct a 19 year record of ice loss from Greenland. This involves calculating the amount of snowfall on the surface, the amount of ice mass lost to wind and melt and the amount of ice lost calculated from glacier velocity and ice thickness. Putting all these pieces together gives the total amount of ice lost or gained over the ice sheet.
Over this nearly two decade period, Rignot finds a clear signal of accelerating ice loss. He then compares his results from the Mass Balance Method to results from GRACE data. Both show consistent rates of mass loss. Just as significantly, both are accelerating at similar rates.
Figure 2: Total ice sheet mass balance in Greenland from the Mass Balance Method (black) and GRACE gravity measurements (red). The acceleration is given in gigatonnes per year squared (Rignot 2011).
Out of curiosity, I thought I'd plot the results from all three papers on a single graph to see how the results compared. Each paper covers different time periods so I've indicated the time period (horizontal uncertainty bars) as well as the ice loss uncertainty (when provided). I also included a number of other estimates from recent papers (many thanks to Ernst Schrama for providing a handy summary - saved me some legwork) and Robert Way who pointed me to the IPCC estimates. It was especially interesting to see how the recent Wu et al 2010 estimate compares to the other estimates (it's the blue GRACE data point sitting like an outlier above all the other estimates). Thanks also to Bert Wouters and Ernst Schrama for their advice and feedback.
Figure 3: Various estimates of Greenland ice loss.
While there are a range of estimates on Greenland ice loss, independent lines of evidence all paint a similar picture - Greenland is losing hundreds of billions of tonnes of ice per year and the rate is increasing.


 0
0  0
0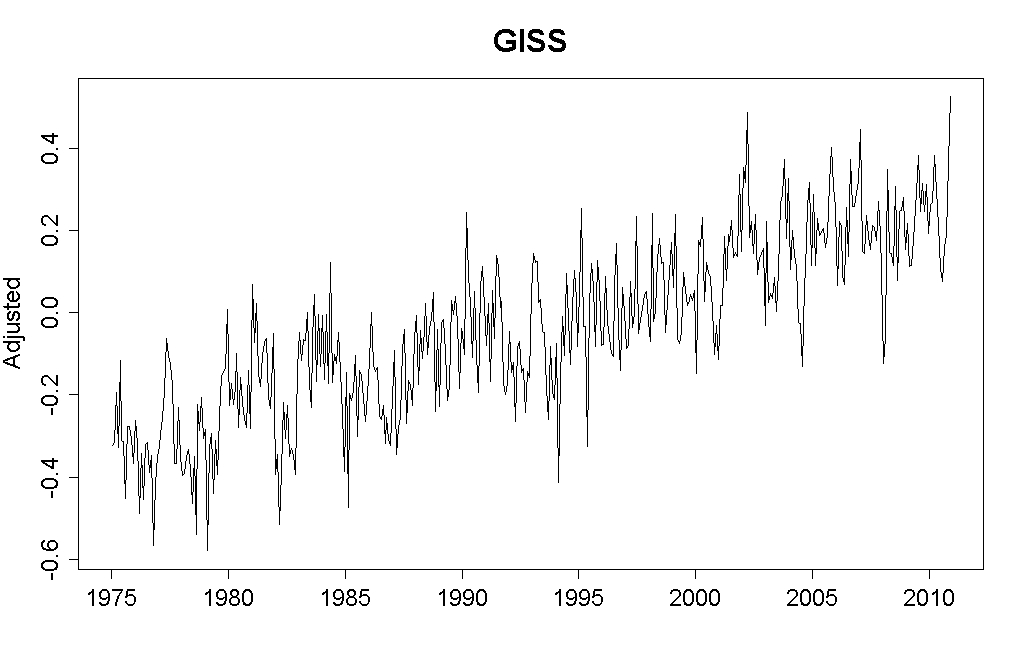
 The figure above shows the standardized melting index anomaly for the period 1979 – 2010. In simple words, each bar tells us by how many standard deviations melting in a particular year was above the average. ... Previous record was set in 2007 and a new one was set in 2010. Negative values mean that melting was below the average. Note that highest anomaly values (high melting) occurred over the last 12 years, with the 8 highest values within the period 1998 – 2010. -- emphasis added
 JOURNAL OF GEOPHYSICAL RESEARCH, VOL. 111, D11105, 2006
doi:10.1029/2005JD006810
Extending Greenland temperature records into the late eighteenth century
B. M. Vinther, K. K. Andersen, P. D. Jones, K. R. Briffa & J. Cappelen
Years 2006-2009 are added to their supplementary data.
JOURNAL OF GEOPHYSICAL RESEARCH, VOL. 111, D11105, 2006
doi:10.1029/2005JD006810
Extending Greenland temperature records into the late eighteenth century
B. M. Vinther, K. K. Andersen, P. D. Jones, K. R. Briffa & J. Cappelen
Years 2006-2009 are added to their supplementary data.
 Both summer and autumn have mild long term warming trends; both seem to turn up in the early '80s. Those seasons seem to be key to understanding Arctic melt: Per Serreze 2009 et al, "it makes sense that the surface warming signal has emerged first in autumn. Less sea ice at summer’s end (September), as observed, has enhanced upward heat fluxes to the atmosphere."
Here's a more regional study, Box 2002:
Based on temporal and spatial statistics, distinct and meaningful patterns of temperature are evident in Greenland instrumental temperature records spanning 1873–2001. These include a steady decay of spatial correlation, a lack of correlation between west and east coasts, and the presence of opposite temperature trends between west and east coasts that are themselves not statistically linked.
So it would seem that no broad conclusions can be drawn from Vinther, which is just the southwest Greenland coast.
Box (who analyzed 27 stations throughout Greenland) goes a step further:
The 1873–2001 western Greenland warming trends observed in this study are meaningful in the context of observed Greenland ice sheet melt rates. The mass balance of the ice sheet sector south of 73°N latitude and west of Kap Farvel was negative for the second half of the last century. This appears not to be affected by changes in precipitation, implicating the observed warming and potential ice dynamical changes.
Yeah, that negative ice mass balance just keeps on rearing its ugly head.
Both summer and autumn have mild long term warming trends; both seem to turn up in the early '80s. Those seasons seem to be key to understanding Arctic melt: Per Serreze 2009 et al, "it makes sense that the surface warming signal has emerged first in autumn. Less sea ice at summer’s end (September), as observed, has enhanced upward heat fluxes to the atmosphere."
Here's a more regional study, Box 2002:
Based on temporal and spatial statistics, distinct and meaningful patterns of temperature are evident in Greenland instrumental temperature records spanning 1873–2001. These include a steady decay of spatial correlation, a lack of correlation between west and east coasts, and the presence of opposite temperature trends between west and east coasts that are themselves not statistically linked.
So it would seem that no broad conclusions can be drawn from Vinther, which is just the southwest Greenland coast.
Box (who analyzed 27 stations throughout Greenland) goes a step further:
The 1873–2001 western Greenland warming trends observed in this study are meaningful in the context of observed Greenland ice sheet melt rates. The mass balance of the ice sheet sector south of 73°N latitude and west of Kap Farvel was negative for the second half of the last century. This appears not to be affected by changes in precipitation, implicating the observed warming and potential ice dynamical changes.
Yeah, that negative ice mass balance just keeps on rearing its ugly head.
 "Departure of sea surface temperature from average for 2010 from the NOAA Daily Optimum Interpolation SST Anomaly data set for October 2010. Areas colored red are warmer than the 1971-2000 average, areas colored blue are cooler than that average. A large region of record warm water temperatures extended along the west coast of Greenland, leading to record warm air temperatures and record melting along the western portion of Greenland in 2010. Ocean temperatures along the southwest coast of Greenland (60N to 70N, 60W to 50W) computed from the UK Hadley Center data set during 2010 were 2.9°C (5.2°F) above average--a truly remarkable anomaly, surpassing the previous record of 1.5°C set in 2003. Sea surface temperature records for Greenland began in the 1920s."
The Yooper
"Departure of sea surface temperature from average for 2010 from the NOAA Daily Optimum Interpolation SST Anomaly data set for October 2010. Areas colored red are warmer than the 1971-2000 average, areas colored blue are cooler than that average. A large region of record warm water temperatures extended along the west coast of Greenland, leading to record warm air temperatures and record melting along the western portion of Greenland in 2010. Ocean temperatures along the southwest coast of Greenland (60N to 70N, 60W to 50W) computed from the UK Hadley Center data set during 2010 were 2.9°C (5.2°F) above average--a truly remarkable anomaly, surpassing the previous record of 1.5°C set in 2003. Sea surface temperature records for Greenland began in the 1920s."
The Yooper


Comments