Arctic Ice March 2011
Posted on 30 March 2011 by logicman
This is a repost of my Science 2.0 article Arctic_Ice_March_2011_Update_#2, with an introduction, updates and minor edits.
Introduction
The main mass of Arctic sea ice has previously consisted mostly of thick multi-year ice. In the winter of 2006 - 2007 there was a crossover: first year ice became the majority component.
The Arctic sea ice cap is getting younger. A population of older ice is being replaced as the older ice is lost and new ice does not linger long enough to get old. The former dominance of thick multi-year ice together with a gyratory motion caused new ice to enter the main pack and be trapped there for many years. The Transpolar Drift and Beaufort Gyre formerly brought new ice into the main pack and exported old ice - mainly on the Atlantic side through Fram Strait. The export and import were formerly in broad balance. They are not balanced now.
Younger and thinner ice now allows a more rapid transit of floes through the pack. The age of the oldest ice is the length of time during which it was prevented from advecting south by being trapped in the main pack.
It appears that as the ice gets thinner and more mobile, that very mobility is a positive feedback to ice loss.
Arctic Ice March 2011
The melt season of 2010 ended with a low extent and with little ice older than two years. There are strong indications that the winter of 2010 - 2011 did not compact and thicken the sea ice as much as would normally be expected.
Arctic sea ice extent averaged over December 2010 was 12.00 million square kilometers (4.63 million square miles). This is the lowest December ice extent recorded in satellite observations from 1979 to 2010, 270,000 square kilometers (104,000 square miles) below the previous record low of 12.27 million square kilometers (4.74 million square miles) set in 2006 and 1.35 million square kilometers (521,000 square miles) below the 1979 to 2000 average.
... unfrozen areas of the ocean continued to release heat to the atmosphere, and an unusual circulation pattern brought warm air into the Arctic from the south. Although the air temperatures were still below freezing on average, the additional ocean and atmospheric heat slowed ice growth.
http://nsidc.org/arcticseaicenews/2011/010511.html
It appears to me that the 2011 melt season began with weaker, thinner, less consolidated ice than at any time in recorded history. Where the slabbing and compaction has been least, the newest ice between the older floes is likely to melt soon.
I suggest that by mid-April the sea ice will be in a similar condition to that of late August 2010. In plain terms, the 2011 melt season will soon continue more or less where the 2010 melt season left off.
To illustrate that last point, this animation compares 25 March 2011 ice extent on Greenland's northeast coast with 25 March, 10 April, and 01 June 2010.
Ice extent comparisons - from MODIS Arctic mosaic images.
Melting and re-freezing
Many areas of the Arctic are melting, advecting and re-freezing. This superimposes local variation noise on signals of ice extent. I call this 'the Arctic ice jitters'.
Sea ice extent in February and March tends to be quite variable, because ice near the edge is thin and often quite dispersed. The thin ice is highly sensitive to weather, moving or melting quickly in response to changing winds and temperatures, and it often oscillates near the maximum extent for several days or weeks, as it has done this year.
Source: NSIDC report March 23, 2011
The following images show the ice jitter effect in an Arctic mosaic segment which includes Kara Strait.
Kara Strait - ice extent jitters
Note that this sea ice will appear in extent numbers but will have no impact whatsoever on the mass of ice in the main polar sea-ice cap.
The tale of the tape
The unusual behaviour of Arctic ice this year is shown at a glance by the Cryosphere Today's 'tale of the tape': the 2011 portion of the graph could not have been predicted from previous data. The 2011 plot of anomalies is itself anomalous.
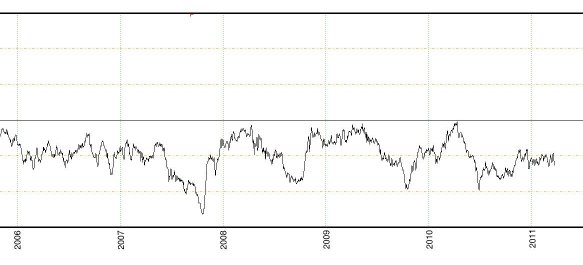
The graph as a whole shows a clear negative anomaly trend since 1979.![]()
The latest update of the full sized 'tale of the tape' can be seen at http://arctic.atmos.uiuc.edu/cryosphere/
The animation below of the sea ice concentration chart from Cryosphere Today shows changes in ice distribution from 31 December 2010 to 22 March 2011 in 5 day steps.
Sea ice concentration Dec 31 2010 to Mar 22 2011
The chart of sea ice concentration should be read in conjunction with the PIPS ice displacement chart animation and the current ice thickness chart below.
Ice displacement charts from March 01 to March 25 2011
PIPS ice thickness forecast.
The red, yellow and green areas in the ice thickness chart are the last vestiges of sea ice thicker than 2.75 meters in the entire Arctic. They consist of heavily fragmented ice much of which is being advected through the Fram Strait. When the Nares Strait and NWP ice breaks up, that thick ice will be highly susceptible to advection through those passages.
The 3 to 5 thousand years old ice shelves which once extended north of Ellesmere island are now down to the last fragments. If we discount those fragments there is little ice in the entire Arctic older than 5 years. It bears constant repeating that the bulk of Arctic ice 2011 is 2 years old or less.
Nares Strait
Recent ice advection patterns; warm water advances into the Arctic from the Atlantic; ice distribution patterns: all of these things show that conditions continue to be advantageous for export of ice through Fram Strait. Nares Strait is currently blocked by relatively weak ice. As soon as the ice in Nares Strait breaks up, a continuation of current trends will be advantageous for the export of substantial volumes of the remaining older ice through that channel, supplementing the export through Fram Strait.
We are now (27 March 2011) within the time frame of my March 02, 2011 predition for the breakup of the Nares Strait ice bridge. Radar images show a melange of last year's floes and young ice. This melange is so weak that a few cloudless days and / or a strong wind towards Baffin Bay will cause a rapid breakup of the ice bridge. I expect to see ice being advected through Nares Strait about the 14th of April.
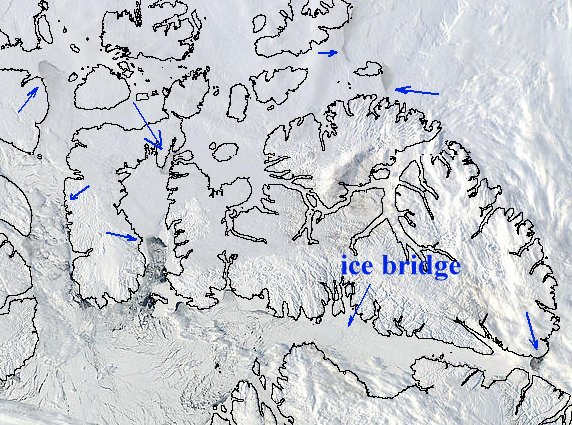
NWP and Nares Strait
The arrows show 'places of interest' where ice is breaking up and being replaced by open water. The ice bridge is still intact, but its breakup is imminent.
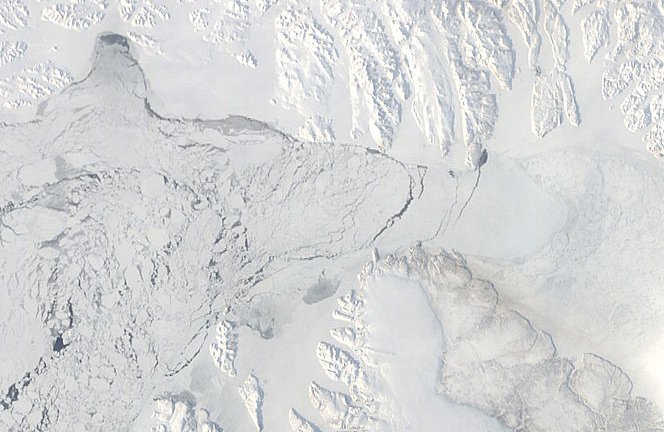
Ice bridge at Kane Basin, Nares Strait March 26 2011
Ice volume
The decline in ice volume since 1979 is dramatically illustrated by this PIOMAS graph.
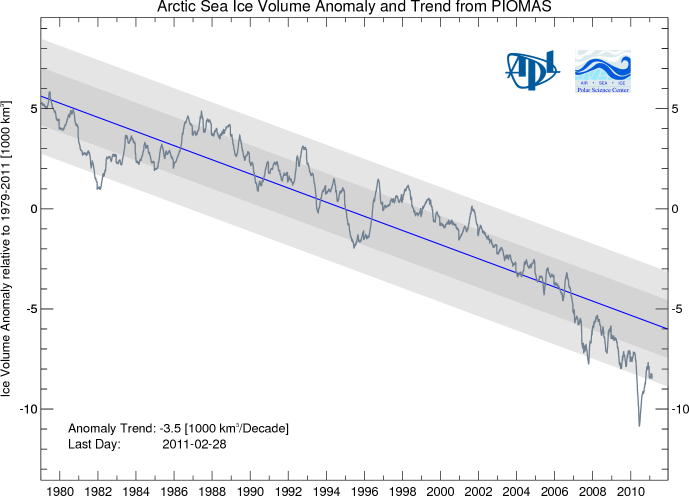
The importance of ice volume is that it reflects the ability of the Arctic sea ice cap to absorb heat without melting away entirely. Thicker ice can survive summer melting longer than thinner ice. Thicker ice has greater momentum by which massive floes slide over and under each other, slide over ice rubble, create massive compression ridges and generally make the ice more robust. Thinner ice can melt away entirely, can fragment instead of slabbing.
An ice cap which is rejecting heat all winter can absorb the same amount of heat during summer without raising its temperature to the melting point. Ice lost by ablation is readily replaced by the freezing of rain, snow and meltwater. A robust ice cap, due to its thermal capacity, cannot melt away in summer.
The ice cap we see today is not robust.
Ice displacement patterns such as the one below will drive a great volume of ice out of the Arctic Ocean and into warmer waters.

Summary
The melt season of 2011 is under way with less volume than former melt seasons.
Of that lesser volume, about 90% appears to be under 2.75 meters thick.
Much of the ice is less than 1 year old.
The Arctic's dynamic system seems primed to advect large quantities of ice out of the main ice cap area.
The Beaufort Gyre and Transpolar Drift have not yet appeared as stable patterns. The instabilities in the ice drift patterns broadly favor ice export via Fram Strait.
Collapse of the Nares ice bridge is imminent.
Forecast
These forecasts represent what I expect to see based on a continuation of general trends.
Dates given should be taken as plus or minus 3 days.
The Nares ice bridge will be fragmented, and the ice in Kane Basin will be melting out by April 7th.
Ice from Lincoln Sea will be advecting through Nares Strait by April 14th.
The main North West Passage ice will show strong evidence of breakup and melt by April 30th.
By April 30th, ice extent graphs will show a strong downward trend similar to that of May - June 2010.
-------------------------------------------------
Sources:
http://nsidc.org/arcticseaicenews/2011/010511.html
Polar Science Center
http://arctic.atmos.uiuc.edu/cryosphere/
http://rapidfire.sci.gsfc.nasa.gov
http://www7320.nrlssc.navy.mil/pips2/
Further resources:
Arctic Sea Ice Blog
arctic sea ice graphs
Related articles:
Arctic Ice 2011 - Sail, Steam And Satellites
Arctic Ice March 2011
Arctic Ice March 2011 - Update #1
ice-in-baffin-bay
The ChatterBox Arctic Index

Arguments


No good perspective for the arctic sea ice in September 2011. Unfortunatly it has little or nothing to do with the greenhouse effect, and thus we cannot do anything against it. It's nature, and we can only observe and explain. By the way: the arctic ice extent in February 2011 was not a record low: in February 2005 the frozen surface was the same as in February 2011 (14.36 square km).
[dana1981] Please see "Arctic icemelt is a natural cycle"
Thanks for the summary.
Little or nothing to do with the GHE? Really? And how do you come to that conclusion? Isn't Arctic amplification a predicted result of an enhanced greenhouse effect?
Feb 2011 vs. Feb 2005? Really? Are you going to ignore the 350 some odd other data points in the data and focus on just two? That doesn't seem very skeptical to me.
Granted, given that the prior two months (December 2010 and January 2011) were new record lows you might draw a distinction of February having 'merely' tied the record, but it seems a bit desperate.
Isn't Arctic amplification a predicted result of an enhanced greenhouse effect?
Perhaps, but advection is not.
Clearly this:
has everything to do with advection.
There is a tendency to blame Arctic Sea ice change on temperature.
There is much less tendency to blame temperature on Arctic Sea ice change.
But there are a couple of reasons to do so.
Sea ice insulates the air from the warmer water below, allowing temperatures to decrease further and thinner ice insulates less well.
Also, sea ice is much more emissive than sea water in the infrared.
Surely it takes heat to melt ice. But cause and effect are intertwined and dynamics are at work as well as thermodynamics.
That's part of the problem. Decreasing summer ice extent means increasing areas of open water. This was addressed in detail on the Flanner threads.
1: Warming melts ice (as you have conceded)
2: Melting ice increases the likelihood that ice bridges/jams break up... allowing advection through more channels.
3: Melting ice means less ice for currents to propel... resulting in less energy being used to move the ice and thus faster currents / advection.
Basically, you are arguing that the Arctic sea ice loss is caused by advection rather than global warming... as if global warming weren't directly responsible for the increased advection.
What is your point? Or, what are you talking about?
"There is much less tendency to blame temperature on Arctic Sea ice change."
Circulation patterns are driven by patterns of energy imbalances. Without a change in the thermodynamics of the system, there would be no cause for the circulation patterns to change.
"Also, sea ice is much more emissive than sea water in the infrared."
Emission spectra of black bodies is given by Planck's Law. Granted, neither is a perfect black body, but this is the first I have heard that they are categorically different in that respect. Are you confusing emission with reflectance?
ChrisG @6 is right, the Arctic is the canary in the coal mine and we ignore its warnings at the peril of future generations.
Why? Arctic amplification of global warming. A cap that in winter was essentially a monolithic bloc 8-10 meters thick is down to about 2 meters thick. What was once 40% or more multiyear (MY) ice is down to perhaps 5% MY ice. The cap of yore was very resistant to advection during winter. Not that of today.
Winter was once the time the cap recharged its volume to endure and withstand the summer onslaught of sun/insolation.
As evidenced by the lack of winter recovery of the cap in the OP graph above, this summer melt season will be...interesting.
In the Chinese curse sense of interesting.
The Yooper
I don't know if this has been said but the bottom of the graph taken from PIOMAS means a situation of no-ice in September. I'm saying this because many people posting comments -some of them in this website- had claimed about the Y-axis scale in that graph distorted in order to "dramatize" the situation.
On the other hand and abusing of the profusion of data, I'd like to ask the author and the participants about data involving CO2 transportation to deep ocean waters as an important byproduct of sea ice. I mean, by new year ice formation in the Arctic amounts to some 2,000,000 m3 per second -that is about the double of all the rivers in the planet together-; that means at least 1GTon/sec of brine rich in CO2 going down and sweeping more sea water to finally reach the bottom of the ocean (that's why we have some 70% of sea water below 4°C in spite the temperature of the atmosphere and the Earth's crust is higher).
I'm asking this because we have seen and see here a persistent reduction in the Arctic's ice pack, but the mass of ice formed and melted every year has remained almost unchanged -I think-. I'm interested in what is going to happen when we see a week ice-free Arctic, then a month, then a season, because the provision of chill waters will slow down and that is going to have vast consequences in the long run.
Thank you in advance for any information on this subject.
Circulation patterns are driven by patterns of energy imbalances. Without a change in the thermodynamics of the system, there would be no cause for the circulation patterns to change.
There are to major circulations that govern Arctic sea ice - the Beaufort Gyre and the Transpolar Drift:
Clearly when the Transpolar Drift dominates the gyre, sea ice is lost to lower latitudes and the multi-year ice declines, which makes the ice more prone to melt in summer.
When the gyre dominates, ice is not lost, but rather spins and accumulates in place, leading to the build up of multi-year ice.
It is certainly true that thermodynamics drive circulation, but there is no plausible prediction or causal link to identify why for any particular regime, the gyre would dominate, the drift would dominate, or the two would be in relative balance.
Different wave patterns arise in the atmosphere from one year to the next, even though the energy imbalances are quite similar. There are multiple wave states for the same initial condition.
"Also, sea ice is much more emissive than sea water in the infrared."
Emission spectra of black bodies is given by Planck's Law. Granted, neither is a perfect black body, but this is the first I have heard that they are categorically different in that respect. Are you confusing emission with reflectance?
You are correct.
That statement is in error.
Ice and water are both efficient emitters:
http://www.infrared-thermography.com/material-1.htm
I have no question that the thickness of the ice has dropped a lot in the past decade, but it isn't clear to me that 2010 was terribly exceptional in that respect, and I don't see how the extent can be expected to go from where it is now to August 2010 levels within a few weeks.
I have been under the impression that Greenland's NE coast is an outflow region; so, I expect ice there to be highly variable. I don't know that it makes the best case for representing the ice pack as a whole.
Or, is the point that the region shown is already showing signs of break-up where in years past this has come much later in the season?
CW,
Thanks for the reasoned response. I think we are mainly in disagreement about cause versus effect, and with feedbacks in play, it can be difficult to distinguish the one from the other.
While it is not clear to me that it is possible to predict gyre or drift domination, it should be clear that things are changing. There exist broad patterns of circulation, like Hadley Cells, that can be predicted to change. That wasn't always the case. Just because we may not now fully understand how or why thermodynamic changes that result from an increase in GHGs should result in arctic circulation pattern changes should not be taken to mean that there is no relationship.
On the other hand, I don't know that the wind patterns are changing. It could be merely that the thinner ice is more susceptible to wind movement and that the wind itself hasn't changed. That would be an interesting research article: Have the arctic weather patterns changed with respect to their propensity to export ice, over say, the last 50 years?
But none of that mattered when the ice was relatively solid and well packed throughout the Arctic, which had been the case for the past several thousand years.
It's only been in the past decade that the sea ice concentrations have diminished to the point where circulation patterns can have an effect, and exacerbate the warming by shifting ice fragments towards warmer latitudes.
It's not that the patterns have shifted. It's that the patterns never even mattered before.
No need to shift to a warmer latitude if that warmer water has already come to you.
See the press release and the journal article in Science magazine.
Reading the article, I was rather surprised to see a prediction that August 2010 extents may be reached by the end of April. If that happens, then it'll be hard to ignore by the 'skeptic' blogs.
It reminds me of the Larsen B ice shelf break-up a few years ago. Scientists knew it was weakening, but were astounded when the entire 200m-thick ice shelf broke up in little more than a month. Could we be seeing the beginnings of a rapid collapse of the Arctic ice pack? Might the Arctic be largely ice-free in summer in only a few years?
Interesting times indeed!
I don't think he means by "I suggest that by mid-April the sea ice will be in a similar condition to that of late August 2010." that the extent will be about the same by mid April as it was in late August 2010. It reads to me as though he was thinking in more qualitative terms when he wrote that. After all, a drop in extent by that much would make the part of his forecast saying "By April 30th, ice extent graphs will show a strong downward trend similar to that of May - June 2010." an incredible understatement.
Logicman means the melt season of 2011 will have a month's head-start on that of 2010 due to the much poorer state of the ice currently.
Which is why veteran ice watchers such as Logicman feel Maslowski's predictions may now be dated and conservative as the ice conditions seen are much inferior to those present when those predictions were made. And I find myself in agreement with him (L-man).
The Yooper
Such poor ice condition would tend to lead to rapid break-up of the ice pack, you would think. Will be interesting to see how the extent tracks this year.
Only about 7% of the earth's surface is above 60 degrees North.
Of the purported Earth's warming imbalance of 145E20 Joules/year, only 1E20 Joules/year is accounted for by the reduction in Arctic sea ice. That is only 1/145 of the claimed heat being gained by the Earth due to global warming.
The problem is trying to find where is the other 144/145ths.
[DB] Actually, when the heat energy is considered, during the Arctic melt season more energy is delivered to the Arctic than the tropics (due to the much longer periods of daylight available):
For a few decades it's been more or less invisible because the ice has been soaking it up from underneath. But all good things must come to an end. So much warmth has gone into thinning the ice that it is finally giving up. It's breaking up into slush in many places, it's not forming the former massive slabs it used to. And those smaller, thinner pieces of ice are more vulnerable to winds, tides and currents that formerly used to circulate around, over and beneath the ice shifting and compressing most of it and moving just the edges away.
Now those "edges" are all through the no-longer-packed ice and the winds and currents have free rein to move damaged ice further and faster out of the Arctic area.
Citation, please.
Arctic temperatures higher between 1935-1945 than today?
NOAA seems to disagree:
Re the unsupported claim made by Cadbury @30 that:
"Note that from 1935-1945, arctic temperatures were much higher than today"
The data plotted below also agree with the NOAA figure that you posted.
Source here.
Do you think NOAA did a very good job updating the public about the BP oil spill?[muoncounter] Above is off topic.
http://www.agu.org/journals/ABS/2009/2009GL038777.shtml
Sorry, this links only to the abstract, I think this is a pay journal but it says in the abstract the arctic warmed faster 1910-1940.
That is not saying that the Arctic was warmer in 1940. You said, "Note that from 1935-1945, arctic temperatures were much higher than today" which would be inaccurate.
My additional answer: yes, the warming at high latitudes has been predicted as a result of the greenhouse effect. But that's the only point where the sea ice melting has something to do with the greenhouse effect. ( - Off-topic Gish Gallop snipped - )
You may know, that arctic sea ice has a high recovery capacity: some colder years are enough to restore it, because thin ice grows faster than old ice.
Actually, CW did not address Arctic amplification in his/her posts. They simply stated what is already known about winds and currents in the region. And if the strength of the polar vortex is affected by polar amplification, and the recent wild swings in the AO index suggest it is, that will translate into changes in the winds and ocean circulation. So advection of sea ice is/will be affected by polar amplification-- as I said up thread, "The climate system is a continuum and a myriad of intertwined factors/processes modulate its behaviour.".
There is also evidence that warmer ocean water from lower latitudes is now entering the Arctic (Spielhagen et al. 2011), water that is the warmest in the past 2000 years.
"Here, we present a multidecadal-scale record of ocean temperature variations during the past 2000 years, derived from marine sediments off Western Svalbard (79°N). We find that early–21st-century temperatures of Atlantic Water entering the Arctic Ocean are unprecedented over the past 2000 years and are presumably linked to the Arctic amplification of global warming."
Perhaps the present situation can be best be placed in context by the findings made by Polyak et al. (2010):
"The current reduction in Arctic ice cover started in the late 19th century, consistent with the rapidly warming climate, and became very pronounced over the last three decades. This ice loss appears to be unmatched over at least the last few thousand years and unexplainable by any of the known natural variabilities."
And yet "skeptics"/contrarians in their delusion are still trying to tell us everything is just fine. The 2011 Arctic melt season is going to be yet another interesting one...and not necessarily "interesting" in a good way.
You do need to read a paper more carefully before you cite it, to be sure that it says what you claim it says... this one doesn't.
But, that aside, I'm not sure that I agree with their methodology. They limited their analysis to 8 stations with complete temperature records back to 1880, but in so doing... the only stations which fit that criteria were one in Iceland, 4 in Scandinavia, one around Archangel, 2 in Siberia, and one in southern Greenland (that's nine, and a discrepancy in their paper).
First, this distribution clearly (and they say so) is the "lower arctic".
Second, there is a preponderance of stations in the same area -- many in Scandinavia within a very small region, then others in nearby Russia/Siberia. They completely missed North America, most of Greenland, anything near the Pacific, and anything further north than 70˚ and so missing the "true" Arctic... where the ice is melting.
Third, the primary area they used happens to show a local, regional cooling trend, so it is hardly a good sample on which to base any such study (approximate station locations are black circles):
Another nice topic about AGW and observed changes is available here:
http://tamino.wordpress.com/2010/11/03/how-likely/
This demonstrates a total and complete lack of understanding of the problem. No one really cares if ice "recovers" or even quintuple recovers during the winter. Big deal. The sun goes down, it's dark for months on end, the temperature plummets and ice forms.
Yay.
What we do care about is what happens in the summer months, when the ice melts. When this happens, instead of nice, shiny, reflective ice redirecting the summer sun back into space, open, transparent, high specific-heat water absorbs that radiation and warms, above and beyond the warming which triggered the too-great summer melt and was in turn caused by the greenhouse effect and CO2.
Thirty years ago, the ice melted back to here:
Twenty years ago, the ice melted back to here:
Last year, it melted all the way back to here, exposing that much more lower latitude open water for that much longer time to absorb heat:
Even after the year comes when it melts back to nothing, things will still get worse, because the game then will be predicting how much sooner in the spring/summer the ice melts completely away. And every day sooner is that much more heat absorbed by the planet.
By the way, you made this up. Specifically:
"You may know..." -- No, we don't know, because it's not true.
"High recovery capacity" -- a citation please? You base this on what?
"some colder years are enough to restore it." -- Really? Can you provide a single example when this has actually happened? Not just surface area... that's easy, and will happen even in a warm winter, because the sun goes away for months on end. But has it actually recovered thickness as well as area? Is the ice robust, or just a flaky crust that will vanish with the first kiss of the sun?
"...because thin ice grows faster than old ice" -- So what? Thin ice also melts faster than old ice. That's the whole problem. You'd need decades of much colder weather to rebuild the Arctic back to a state which is harder to melt in the summer.
1. By trend in winter sea ice thickness:
2. By trends in ice extent and area by month:
3. Or by looking at trends in ice edge by month by latitude:
(Edit) To sum:
1. Arctic sea ice thickness is in a multiyear decline, led primarily by the loss of multiyear (old & thick) ice
2. Arctic sea ice extent and area have declined in every month of the year
3. The southernmost ice edge has retreated northward in every month of the year.
The trend (the dwindling of the Arctic sea ice is like an ice cube melting away in your favorite drink) should be clear by now to all with eyes that see (and ears that hear)... (end edit)
The Yooper
Ok, so NOAA is not reliable and reputable enough to provide this kind of data (please tell me if I unvoluntarily misrepresent you). I do not agree, but that's rather personal.
NCAR seems to endorse the same data (Albatross' ref).
From which much more reliable source than these did you get the information that that period was warmer?
When was the last time there was a ice-free summer at the pole (and I dont mean polynas)?
Melting in Greenland is actually more important but arctic ice gets a lot of attention because of what the models predict (they underestimate loss) and the view that it is the "canary in the coal mine".
Here's a basic: the arctic plays a large role in the weather of the NH. Just look at last winter ...
"Almost always, just those few words brings greater illumination than days of numerous minds shining light on things irrelevant."
I might regret asking this, what do you believe to be "irrelevant", and why? Please provide some science and citations to back-up your assertions/belief, otherwise you are just pontificating.
Well, they actually started off claiming that the loss was not evening happening and that is was "recovering". But as for the rest of your post....right you are.
Does this mean that the in April 2011 the volume of sea ice will be the same as in late Aug. 2010?
Because I can't see how it means that the arctic melt is a month ahead as suggested by D. Bailey, however for "By April 30th, ice extent graphs will show a strong downward trend similar to that of May - June 2010." that seems to be the case.
Lawrence, D.M., A.G. Slater, R.A. Tomas, M.M. Holland, and C. Deser, 2008: Accelerated Arctic land warming and permafrost degradation during rapid sea ice loss. Geophys. Res. Lett., 35, L11506, doi:10.1029/2008GL033985.
This article is suggestive that losing the summer sea ice will accelerate arctic region, extending 1000 mile south, by 3.5X, and that model didn't include the more recent data on the increased stength of the albedo effect reported by Flanner et al, Nat. Geo, vol 4, 151-155, 16 Jan 2011,
"we conclude that the albedo feedback from the northern Hemisphere cryosphere falls between 0.3-1.1 w.m2.k, substantially larger than comparible estimates obtained from 18 climate models."
Also considering the already changing weather patterns (Arctic Dipole) that effect the whole NH, what is next is going to be interesting.
This rate of arctic sea ice loss, is well ahead of any computer predictions, what is the next 0.7C of global temperature rise going to bring?
Oil speculation in the arcitc?
A massive arctic wind farm to cool the arcitc?
Potential climatic impacts and reliability of very large-scale wind farms
C. Wang and R. G. Prinn
Atmos. Chem. Phys., 10, 2053–2061, 2010
www.atmos-chem-phys.net/10/2053/2010/