


 Arguments


Patrick Michaels: Serial Deleter of Inconvenient Data
Posted on 17 January 2012 by dana1981
Patrick Michaels is a research fellow at the Cato Institute think tank, the chief editor of the website World Climate Report, has been given a climate blog at the business magazine Forbes, and his articles are frequently re-posted at climate "skeptic" blogs like Watts Up With That (WUWT). Despite his clear conflict of interest (Michaels has estimated that 40% of his work is funded by the petroleum industry), many people continue to rely on him as a reliable source of climate information. This is an unwise choice, because Michaels also has a long history of badly distorting climate scientists' work. In fact, not only does Michaels misrepresent climate research on a regular basis, but on several occasions he has gone as far as to manipulate other scientists' figures by deleting parts he doesn't like.
Patrick Michaels is a serial deleter of inconvenient data.
Hansen 1988
Skeptical Science has previously documented the most high-profile example of Michaels' serial data deletions, which involved James Hansen's 1988 study projecting future global warming. James Hansen is a scientist at the NASA Goddard Institute for Space Studies (GISS), and one of the world's foremost climate scientists.
Climate scientists aren't in the business of predicting how human greenhouse gas emissions will change in the future - that is a policy question. Instead, climate scientists predict how the climate will change in response to a series of possible emissions scenarios (for example, continuing with business-as-usual emissions, dramatically cutting our emissions starting in the year 2020, etc.). In 1988, Hansen used the NASA GISS climate model to predict how the planet would respond to three possible scenarios. Scenario A assumed continued exponential (accelerating) greenhouse gas growth. Scenario B assumed a reduced linear rate of growth, and Scenario C assumed a rapid decline in greenhouse gas emissions around the year 2000. Hansen believed Scenario B was the most likely to come to fruition, and indeed it has been the closest to reality thus far. In the summer of 1988, Hansen presented his results in testimony before U.S. Congress.
Ten years later, with the Kyoto Protocol international agreement to reduce greenhouse gas emissions in the works, Patrick Michaels was invited to testify before Congress about the state of climate science. He spoke of Hansen's 1988 study, and in the process, grossly misrepresented its projections and accuracy by deleting Scenarios B and C, wrongly asserting that the planet had warmed "more than four times less than Hansen predicted."
Original Version
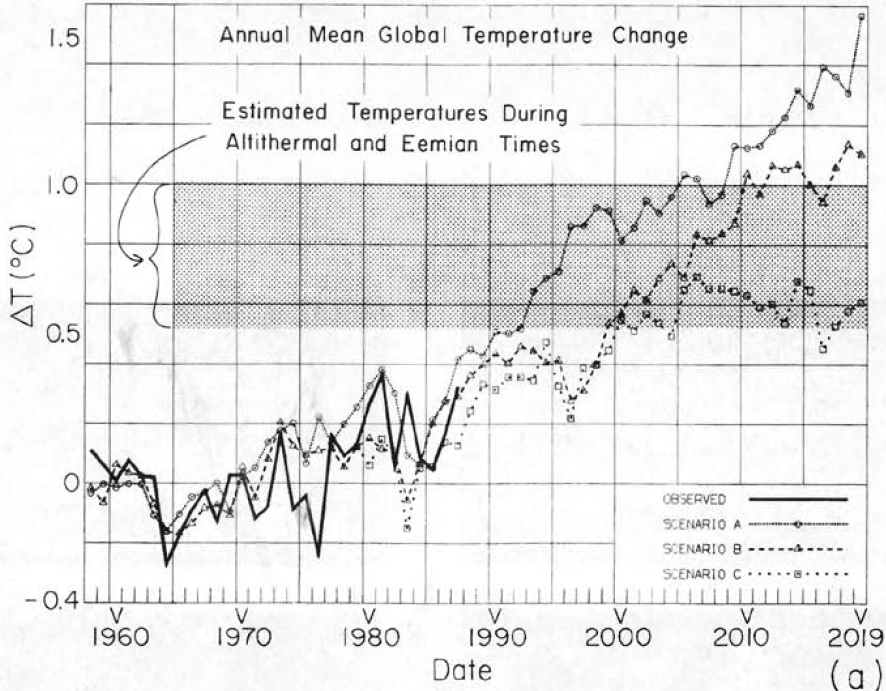
Michaels Version
James Hansen had this to say about Patrick Michaels' distortion of his work:
"Pat Michaels, has taken the graph from our 1988 paper with simulated global temperatures for scenarios A, B and C, erased the results for scenarios B and C, and shown only the curve for scenario A in public presentations, pretending that it was my prediction for climate change. Is this treading close to scientific fraud?"
Michaels certainly didn't mess around with his first known case of data deletion, using it to mislead our policymakers as they decided whether or not to commit to reducing American greenhouse gas emissions (they ultimately refused to ratify the Kyoto Protocol). Michaels' other data deletions, while being almost as misleading, were not made on nearly as grand of a stage.
Schmittner 2011
Another example of Michaels' serial data deletion involved a paper by Schmittner et al. last year which attempted to estimate the climate sensitivity - how much the planet will warm in response to a continued rise of greenhouse gases. Schmittner et al. used geologic data to calculate the climate sensitivity based on the transition between the Last Glacial Maximum (LGM) and the current relatively warm interglacial period (approximately 20,000 years ago), and came up with an estimate towards the lower end, but within the likely range listed by the Intergovernmental Panel on Climate Change (IPCC).
However, there are two strong caveats associated with their results. First, based on their interpretation of the geologic data, they estimated a smaller temperature change from the LGM transition than most previous studies, which was the main reason that their climate sensitivity estimate was relatively low. Had they used a more widely-accepted global temperature change for the period in question, their climate sensitivity estimate would likely have been very close to the most likely estimate from the IPCC.
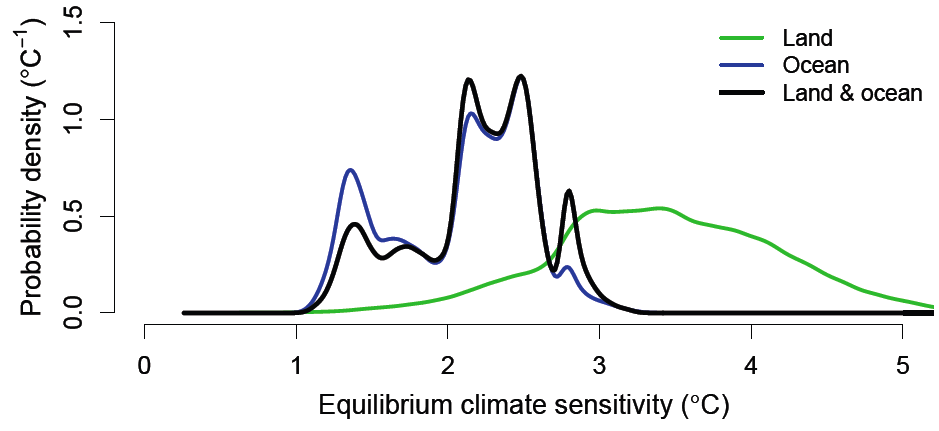
Second, and more relevant here, Schmittner et al. arrived at two fairly different results when they used ocean temperature data as opposed to land temperature data. Their climate sensitivity estimate based on land-only data was significantly higher than with ocean-only data. When they combined the two, the result was close to the ocean-only estimate, because the majority of their data came from ocean measurements.
This is an important caveat because climate sensitivity applies to the planet as a whole. If different results are obtained from ocean and land data, then we can't be sure which is correct, and in fact many climate scientists are skeptical of the small LGM temperature change estimate, which is based heavily on the ocean temperature data. Thus Schmittner et al. felt it important to include both estimates in the figures in their study.
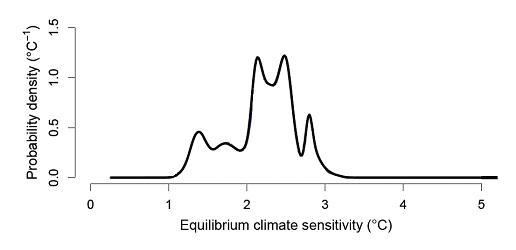
However, it is very important for climate "skeptics" like Patrick Michaels that climate sensitivity be low. This would mean that the planet will not warm as much in response to rising greenhouse gases, and we don't have to worry about reducing our emissions as quickly. Thus as he did with Hansen's figure, Michaels deleted the inconvenient data from the figure in Schmittner et al., leaving only the combined estimate, which as noted above, is heavily weighted by the lower, ocean-based climate sensitivity estimate.
Original Version
Michaels Version
On Planet 3.0, thingsbreak had an excellent interview with Nathan Urban, co-author of Schmittner et al., in which Michaels' distortion of his results was discussed:
"World Climate Report doctored our paper’s main figure when reporting on our study. This manipulated version of our figure was copied widely on other blogs....I find this data manipulation problematic. When I created the real version of that figure, it occurred to me that it would be reproduced in articles, presentations, or blog posts. Because I find the difference between our land and ocean estimates to be such an important caveat to our work, I made sure to include all three curves in the figure, so that anyone reproducing it would have to acknowledge these caveats....I find the result of their figure manipulation to be very misleading...They intentionally took our figure out of the context in which it was originally presented, a form of “selective quotation” which hides data that does not support their interpretation...I find World Climate Report’s behavior very disappointing and hardly compatible with true skeptical inquiry"
Gillett 2012
The latest example of Michaels' serial data deletion involves a recent paper by Gillett et al. which like Hansen (1988), projects future global warming in several different emissions scenarios. However, Gillett et al. made three different projections for each scenario. For the first projection, they simply ran their climate model to see how much global warming it would predict in each scenario. For the other two projections, they scaled their climate model run based on observational temperature changes that they estimated from greenhouse gases and other influences over two timeframes, 1851-2010, and 1901-2000.
In their figure showing the results of these projections, they illustrated the results using the two different timeframes, because the results in each were markedly different. When Gillett et al. constrained their model using the timeframe from 1851 to 2010, the model projected less warming than when they used the timeframe from 1901 to 2000.
This is a very similar situation to Schmittner et al., in that using two different sets of data produced two fairly different sets of results. Thus like Schmittner et al., Gillett et al. made a point to note the fact that their results were very sensitive to the timeframe they used, and included both results in their figures
But once again, the data projecting larger future global warming was inconvenient for Patrick Michaels' narrative, so he simply deleted it.
Original Version
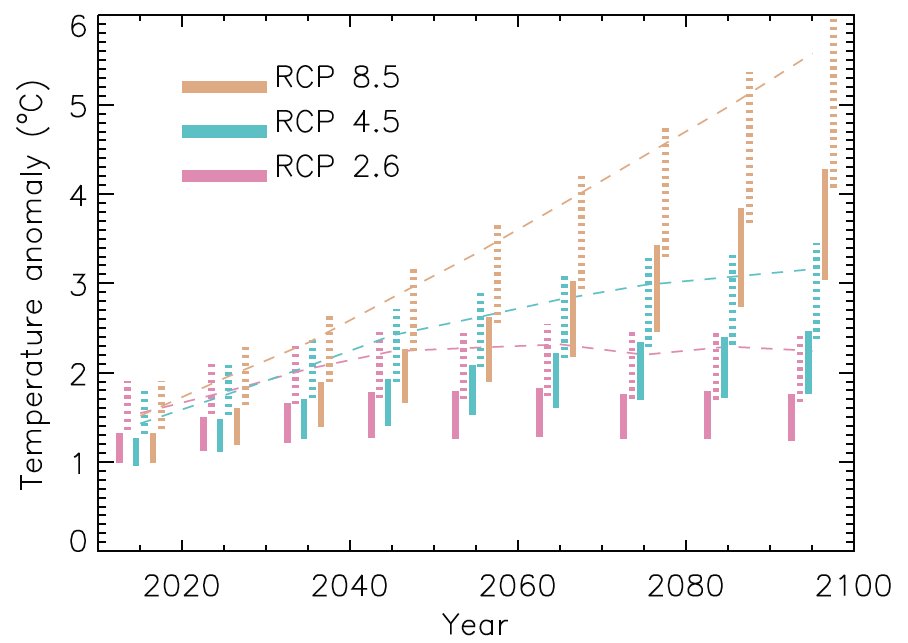
Michaels Version
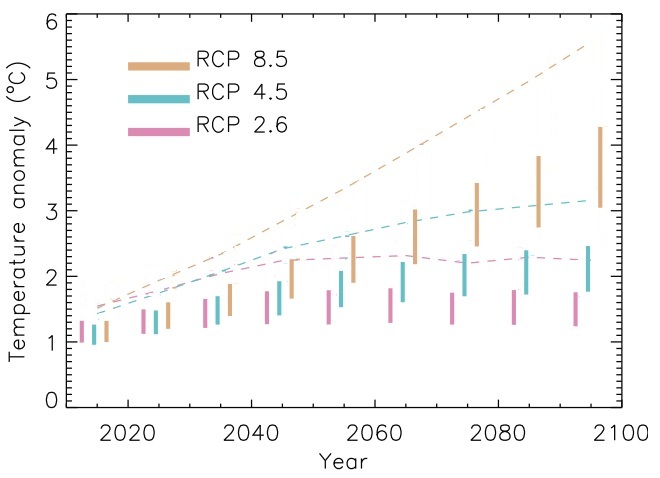
In these figures, the dashed lines in the horizontal direction are the projections from the unconstrained climate model for the three emissions scenarios (the RCPs). The solid vertical lines are the model projections using the 1851-2010 data, and the dotted vertical lines (deleted by Michaels) are the model projections using the 1901-2000 data.
Deleters and Enablers
In every case discussed above, Michaels has deleted the data which contradict his constant arguments that the planet will warm less than most climate scientists expect, and thus that global warming is nothing to worry about. Given his history as a serial data deleter, rather than being given so many platforms from which to spread his misinformation, Patrick Michaels (and certainly the World Climate Report website) should be considered an unreliable source of information.
This is a problematic situation. There are a large number of people who simply don't want to accept the scientific reality that humans are causing rapid global warming. However, this reality is accepted by the vast majority of scientific experts, because it is supported by the preponderance of scientific data. Denial enablers like Anthony Watts, Forbes, and other media outlets have found a way around the first problem by giving fake skeptics like Patrick Michaels a platform to speak to those who are in denial about the science. Patrick Michaels has found a way around the second problem by simply deleting the data which is inconvenient for his narrative, only presenting his audience with the bits of evidence which seem to support their denial, as long as the inconvenient data are ignored.


Here's my list of uses of 3a: wide version:
/climate-sensitivity-advanced.htm
/lindzen-illusion-4-climate-sensitivity.html
/ppm451.html
/Schmittner-climate-sensitivity-goood-bad-ugly.html
/christy-crock-6-climate-sensitivity.html
/Monckton-Myth-4-Climate-Sensitivity.html
/spencer_ocean.html
/climate-sensitivity-skeptic-end-game.html
upright version:
/climate-change-little-ice-age-medieval-warm-period-intermediate.htm
/detailed-look-at-climate-sensitivity.html
/co2-warming-35-percent.htm
/working-out-climate-sensitivity.html
some offsite uses (incomplete search):
http://www.carbonbrief.org/blog/2011/11/a-new-estimate-of-climate-sensitivity
http://thinkprogress.org/romm/2010/09/19/206503/climate-sensitivity-lukewarmers
I'll comment on one of those threads as you suggested.
And earlier you took offense/exception when I suggested that people were now going to "scour" SkS looking for examples of alleged figure doctoring, claiming that you had not done that (and that was true at the time). However, you have gone on to do just that at 158 above-- a fine example of duplicity on your part.Now can we please take this KN08 "discussion" to the appropriate thread, future comments about KN08 here will be summarily deleted.