Climate Science Glossary

Term Lookup

Enter a term in the search box to find its definition.

Settings

Use the controls in the far right panel to increase or decrease the number of terms automatically displayed (or to completely turn that feature off).

Term Lookup

Settings


All IPCC definitions taken from Climate Change 2007: The Physical Science Basis. Working Group I Contribution to the Fourth Assessment Report of the Intergovernmental Panel on Climate Change, Annex I, Glossary, pp. 941-954. Cambridge University Press.

Home Arguments Software Resources Comments The Consensus Project Translations About Support

Twitter Facebook YouTube Mastodon MeWe

RSS Posts RSS Comments Email Subscribe


Climate's changed before
It's the sun
It's not bad
There is no consensus
It's cooling
Models are unreliable
Temp record is unreliable
Animals and plants can adapt
It hasn't warmed since 1998
Antarctica is gaining ice
View All Arguments...


Username
Password
New? Register here
Forgot your password?

Latest Posts

Archives

Pielke Sr. and SkS Dialogue Final Summary

Posted on 29 October 2011 by dana1981

The dialogue between Dr. Pielke Sr. and SkS has run its course, for reasons we will discuss below.  The blog posts associated with this dialogue can be viewed here:

Dr. Pielke's final summary of the dialogue can be viewed here; however, it misrepresents the SkS arguments and the discourse in general several times, as we will show.

Anthropogenic Warming

In attempting to re-calculate the CO2 contribution to the net positive radiative forcing, we showed that Dr. Pielke had made a number of errors, and the correct value was close to 50%, consistent with the findings of the IPCC.  Dr. Pielke agreed with some of our corrections, but came up with new, equally incorrect reasons why the CO2 contribution must somehow be significantly less than 50%.  However, although Dr. Pielke seems to still believe the value is lower, he has provided no references which would significantly alter the SkS calculations.  Dr. Pielke claims:

"SkS accepts a lower value of the positive radiative forcing from soot (black carbon), dismisses two other aerosol effects from NRC 2005 and ignores that some of the radiative effect from the added CO2 would have been adjusted for by a warmer climate system since its introduction."

This is simply a mischaracterization of our position.  SkS used the most up-to-date radiative forcing estimate for black carbon, which is larger than the IPCC estimate (and also noted that one previous study estimates the value is higher), did not "dismiss" aerosol effects, and did not "ignore" Dr. Pielke's so-called "adjustment" from a warming climate.  In fact, we noted that Dr. Pielke's "adjustment" (which he did not account for in his own calculations, or justify other than referencing a personal communication) does not apply to our discussion of the radiative forcing and temperature changes over the past century.

Dr. Pielke argued that the current radiative forcing is more important than the change in forcing (though he did not provide an estimate of the current forcing), but we disagree.  A long-term climate change is caused by a change in radiative forcing.  That is why we were interested in calculating the contribution of CO2 and the net anthropogenic forcing to the global warming over the past century.  Dr. Pielke refused to estimate these values, and did not provide any reason to doubt the SkS best estimates of 0.79°C average global surface warming from CO2, and 0.65°C from the net anthropogenic forcing (the discrepancy in the figures being due to cooling from aerosol emissions).

Ocean Warming

About ocean heat content, in his latest blog post, Dr. Pielke claims (emphasis added):

"warming on the upper ocean has been reduced in recent years. SkS spent a lot of time trying to argue that this is not significant and that one needs to perform statistical tests to show it is...I agree we can not say anything about the long-term trends, but to ignore that heating of the upper ocean has mostly stopped ignores the obvious."

Dr. Pielke's recollection here is simply wrong.  We originally raised this issue because Dr. Pielke had claimed on his blog that OHC has not increased whatsoever ("~0 Joules", as he put it) since 2003.  We demonstrated that this claim was false, and Dr. Pielke admitted his error (although he has not revised the erroneous blog post).  However, contrary to Dr. Pielke's account, we specifically noted

"We agree that increase in OHC for the upper 700 meters has slowed in recent years."

Note that while the heating of the upper 700 meters has slowed, the heating of the upper 1500 meters has not, nor has the heating of the upper ocean "mostly stopped," as Dr. Pielke incorrectly claims.  We did not delve into the statistical significance of the reduced upper 700 meter OHC trend, but rather noted that the warming in the deeper oceans has compensated for the slowed upper ocean warming:

"as we discussed in the post above, and Rob P's recent post, and John's post today, heat is also accumulating in the oceans at depths below 700 meters."

warming

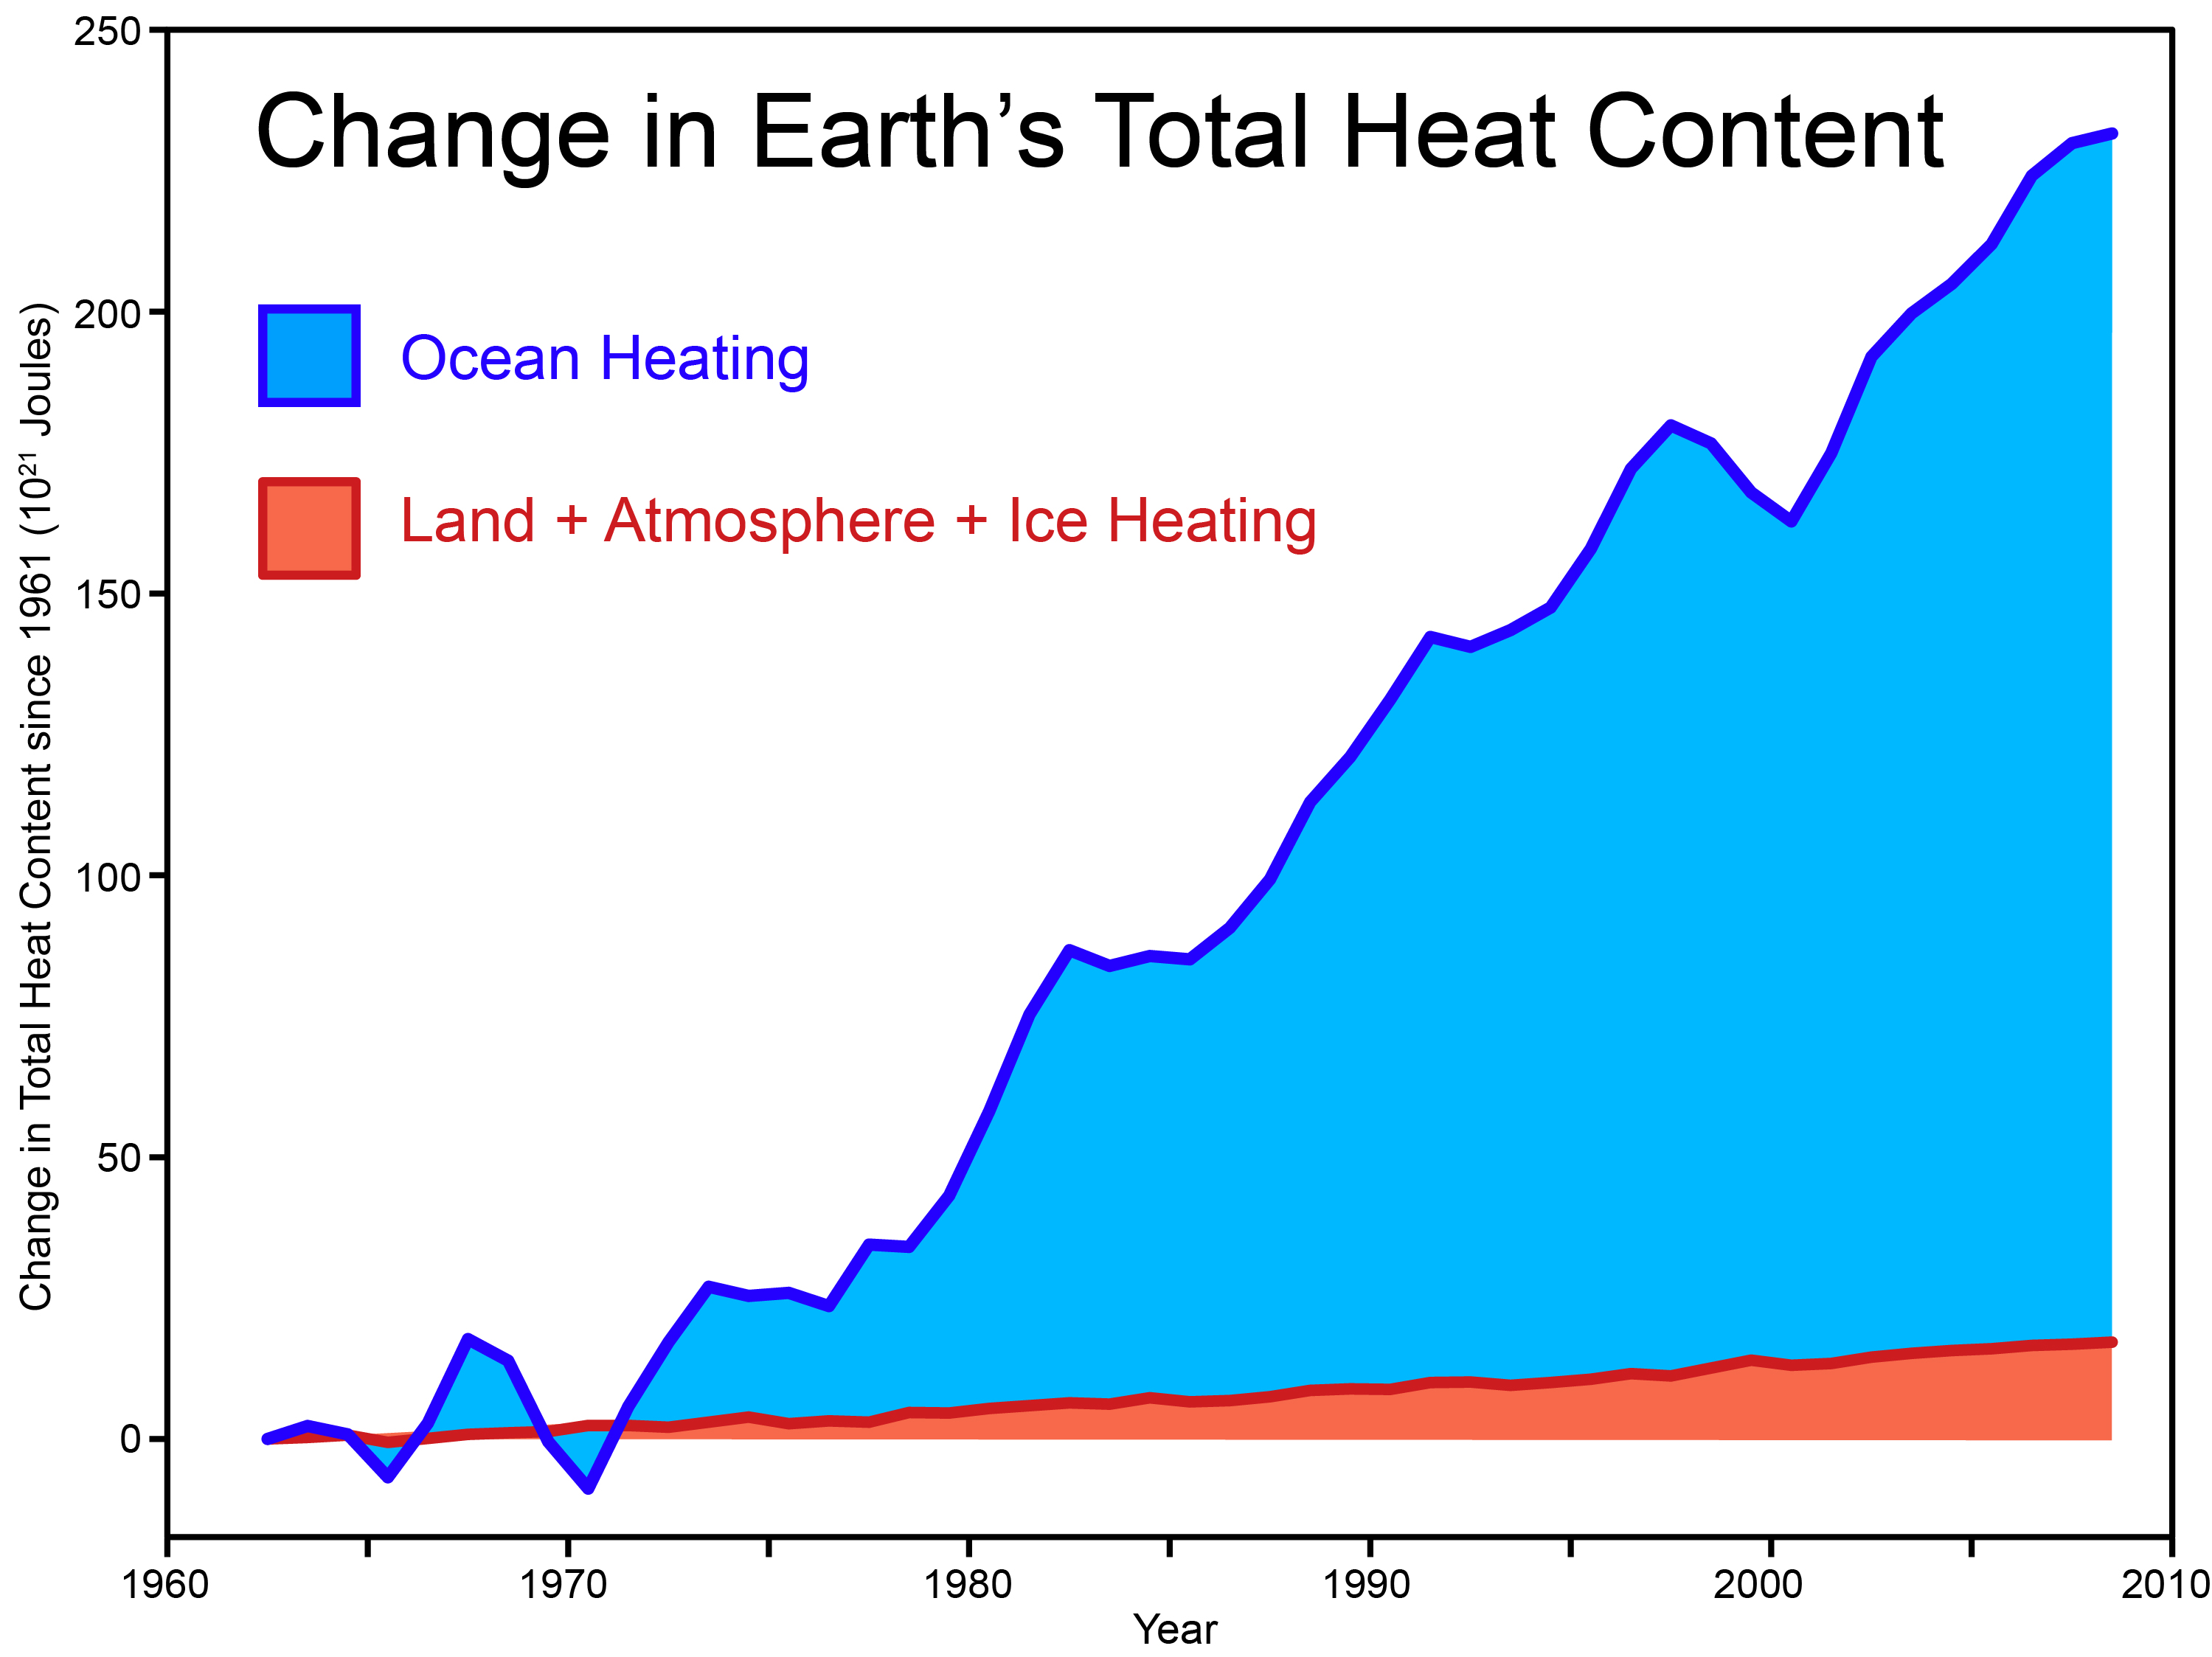
Figure 1: Total Global Heat Content from Church et al 2011

Dr. Pielke seemed reluctant to admit that the deeper oceans have warmed, making several statements along the lines of "If there is heat accumulating at depth...if the heat is actually there," and on his blog he continues to focus exclusively on the upper 700 meters of the oceans.  However, as we have noted several times, there is nothing magical about the 700 meter depth.  The ARGO data extends down to 1500 meters, and other studies have measured the yet deeper ocean layers.  The data show that they have warmed, as illustrated in Figure 1.  We are somewhat puzzled as to why Dr. Pielke has such a difficult time accepting these data.

Continued Atmospheric Warming

With regards to the lower tropospheric temperature (TLT) data, Pielke similarly misrepresents the statements made by SkS on the subject.

"with respect to lower tropospheric temperature trends, they similarly conclude that any short-term excursion from a long-term linear warming is “noise” due to natural climate variations.  Maybe they are right. However, to ignore the obvious that the warming of the lower troposphere has halted, when averaged over the time period 1998 (or 2002) to the present, ignores the obvious signal in the data."

Dr. Pielke seems rather confused in this statement, first correctly acknowledging that short-term variations are noise, and then claiming that they are "obvious signal in the data" in the very next sentence!

It's also only possible to say that the TLT warming trend has "halted" if we cherrypick the perfect start date and data set, as Dr. Pielke did.  And once again, contrary to Dr. Pielke's account, we specifically and repeatedly acknowledged that the TLT trend has slowed in recent years (i.e. here and here and here).  We also noted several times that the reduced trend over a short timeframe is not unexpected (see Santer et al. 2011), and in fact when we examine the various short-term temperature influences (i.e. ENSO, solar irradiance, aerosols), the slowed warming is even an expected result.  Rather than examining the causes of the short-term slowing of the TLT warming trend, Dr. Pielke criticized SkS for doing this analysis, saying

"the failure to accept a slowing down of the tropospheric warming, which seems so obvious to me, actually prevents a more constructive discussion with the so-called "skeptics"."

In short, Dr. Pielke seems to believe we should cherrypick data, refuse to examine the causes of short-term temperature changes, and generally lower the quality of our scientific and statistical analysis in order to pander to the so-called "skeptics."  We could not disagree more, and believe Dr. Pielke's is an unscientific approach.

Stratospheric Cooling

Dr. Pielke claims

"Now, what SkS ignored in my questions to them was the lack of cooling in the lower stratosphere since about 1995"

We did not ignore this question - there were many questions going back and forth during our discourse, and if Dr. Pielke asked one about stratospheric cooling, we simply missed it.  In searching back through the dialogue, we were only able to find one brief mention of the stratospheric temperature trend, which we did indeed respond to.

Regardless, this is not a difficult question to address, as many different factors influence stratospheric temperatures, including water vapor, aerosols, incoming solar radiation, ozone etc.  For example, we recommend that Dr. Pielke read Seidel et al. (2011), emphasis added:

"The temporal and vertical structure of these [stratospheric temperature] variations are reasonably well explained by models that include changes in greenhouse gases, ozone, volcanic aerosols, and solar output, although there are significant uncertainties in the temperature observations and regarding the nature and influence of past changes in stratospheric water vapor."

A Word on Attitudes

Throughout the dialogue, Dr. Pielke accused SkS and our commenters of being "snarky."  To this point we have ignored these accusations, because we are interested in discussing science, and accusations about the tone of the dialogue simply serve as a distraction  However, it's worth noting that Dr. Pielke made quite a few "snarky" comments of his own.  Dr. Pielke concludes his latest blog post saying

"I suspect many readers turn off SkS because of the tone they use in the comments."

Frankly, this is an absurd statement.  The tone of comments on SkS in general is among the most civil in the climate blogosphere.  We invite Dr. Pielke to compare the tone in the SkS comments to the tone in the comments of the blog of the man he defends so vigorously, Anthony Watts (whose tone is orders of magnitude more caustic than at SkS), and then to compare the scientific content of the posts. We consider the scientific content to be the most important part of the debate.

Dr. Pielke also accused SkS of reluctance to discuss science.

"Despite a rocky start (e.g. see) they finally engaged in constructive interactions"

We would like to reiterate that this dialogue began with Dr. Pielke falsely accusing SkS of ad hominem attacks on Spencer and Christy.  When we pointed out that the series in question examine the scientific claims of those individuals, and thus by definition are not ad hominem attacks, it was Dr. Pielke who refused to discuss the science contained therein, instead changing the subject and trying to make us chase his Goodyear blimp, which we eventually did.  Our reluctance to do so was obviously not because we are hesitant to discuss climate science, but rather because we expected Dr. Pielke to examine the scientific series which he wrongly attacked (which unfortunately, he never did, as he continued to wrongfully accuse SkS of failing to examine Spencer's scientific research).

We should also note that Dr. Pielke's repeated evasion and unwillingness to answer direct questions was substantially responsible for the argumentative tone of the discussion.  For example, had he simply accepted our corrections to his radiative forcing calculations, rather than coming up with new incorrect reasons why the human contribution must be much lower than 50%, we would have been able to proceed to discuss other issues rather than continuing to argue this point.

Finally, Dr. Pielke claims about one of our weekly cartoons,

"the disclaimer to the contrary in one of the comments, clearly is intended to relate to me "

Several SkS contributors explained to Dr. Pielke that the cartoon was clearly not intended to depict him.  It was merely a strange coincidence that one of the characters in the cartoon (which SkS did not create) was named "Roger" (hardly an uncommon  name).  Unlike Anthony Watts, SkS does not create or publish cartoons which mock specific individuals.

Pielke vs. Pielke

It is well worth reiterating that Dr. Pielke and SkS agree on the importance of reducing CO2 emissions.  As Dr. Pielke put it (emphasis added):

"The emission of CO2 into the atmosphere, and its continued accumulation in the atmosphere is changing the climate. We do not need to agree on the magnitude of its global average radiative forcing to see a need to limit this accumulation. The biogeochemical effect of added CO2 by itself is a concern as we do not know its consequences. At the very least, ecosystem function will change resulting in biodiversity changes as different species react differently to higher CO2. The prudent path, therefore, is to limit how much we change our atmosphere."

Unfortunately, Dr. Pielke and SkS disagree on the approach we should take to reach that goal of emissions reductions.  The climate "skeptic" community has the exact opposite goal - to prevent significant action to reduce CO2 emissions.  In order to achieve that goal, climate "skeptics" spread misinformation and attempt to sow doubt in the minds of the public and policymakers (this includes some of the colleagues Dr. Pielke has so vigorously defended).

SkS believes that the most effective way to achieve the emissions reductions goal is to counteract this misinformation by examining what the body of peer-reviewed scientific literature has to say about it.  Dr. Pielke, on the other hand, seems to constantly try to feed these "skeptics" ammunition for their arguments.  For example, as we have discussed here, Dr. Pielke cherrypicked data in an attempt to argue that TLT and OHC have not increased since 1998/2002/2003/etc. in an attempt to argue that the warming has stopped.  The "skeptic" interpretation of these comments could not be easier to predict - "Dr. Pielke says that global warming stopped a decade ago."  We fail to see how this behavior will help us further the goal of reducing greenhouse gas emissions.

Dr. Pielke also frequently focuses on what we don't know about the climate, for example, quote mining recent statements by various climate scientists and emphasizing uncertainty, concluding (emphasis his):

"These extracts from the Greenwire article illustrate why the climate system is not yet well understood. The science is NOT solved."

Of course the science is "not solved."  Science is never solved.  And there are certainly aspects of the climate system which we do not yet understand well.  But there are also aspects of the climate system which we do understand well, to the point that we BOTH agree regarding the need to reduce greenhouse gas emissions.  As Dr. Pielke admits, we know that CO2 and other greenhouse gases are first order forcings which, if we continue to dump more and more of them into the atmosphere, will continue to cause more and more global warming and climate change.  So what do we gain by inflating the uncertainties, especially when we know uncertainties cut both ways?

We know what the result will be - the "skeptics" will gleefully (and predictably) exploit these uncertainties as an excuse to oppose taking action to address climate change.  In short, Dr. Pielke's behavior undermines his stated goal of reducing greenhouse gas emissions and addressing climate change.  We recommend that Dr. Pielke stop sabotaging his own goal and instead implement a new policy: DNFTD (Do Not Feed The Delayers).

0 0

Printable Version  |  Link to this page

Comments

1  2  Next

Comments 1 to 50 out of 64:

  1. I wish Dr. Pielke Snr. allowed comments on his post so that I could ask him exactly what is his point in trying to claim that lower troposphere warming "stopped" an insignificantly short period of time ago.
    0 0
  2. Why is someone like Pielke of any interest at all? How many "fudges" is someone allowed before they're hooted off the stage?
    0 0
  3. Dr Pielke many times asserted that OHC should be the metric whereby AGW was measured. On the other hand, he claims that the deep ocean has not been accurately measured. How can these two statements be reconciled? If we do not know how much heat is going into the deep ocean, OHC cannot be used as the primary guage of AGW. I was deeply dissapointed by Dr. Pielke's refusal to respond to direct questions. His recent post at WUWT also contradicts points he made here.
    0 0
  4. Dr Pielke clearly concentrates (read cherry-picks) much on the details forgetting how his big picture looks like. I guess most of leading 'skeptics' are like that: analyse miniscule data (sometimes making errors in the process) and even if not ignorants themselves, they do not seem to realise their methods and statements feed the ignorance of the mob: "it's not that bad, science is not settled, look what Pielke is saying: 'global warming stopped!', blah, blah blah" So, the best way to counteract Pielke's bad influence is to constantly remind the large audience about the big picture that he is missing/ignoring: - warming may have slowed but it's inapropriate to claim it 'stopped' when you don't have statistical test to prove it; look at large timescale, as reasonable people do in case of such noisy data. - it's pointless to argue what the exact percentage of anthropogenic forcing is, when we proved multiple times latest CO2 increase is due to humans and it's the main driver. Also the increase of next GHG: CH4 is due to humans. And the next one: CFC is all human poison, it never existed in the entire 4by geo-history, until last century! - it's pointless to 'discover' that ocean warming has 'stopped', when the result of warming oceans, especially arctic ocean, is dangerus ice shelf melt. - it's pointless to argue the miniscule details of climate science when what we know is more than enough to understand the main drivers and predict climate future. By analogy, we don't need to understand the teory or relativity to predict the astronomical events within the context of say, solar system: old Newtonian law of gravity is enough and beautifully simple.
    0 0
  5. Chriskoz @4 Re your closing comment - Note that one solar system orbit was one of the pointers to the existance of relativity. Mercury's orbit misbehaves in a neutonian universe.
    0 0
  6. One of the most powerfull and frustrating sceptical arguments is global warming stopped or slowed after 1998 or whatever. For example it appears that the oceans also stopped heating from about 1997-2002. Any glance at a long term trend shows it hasnt stopped as a long term process, but naive members of the public dont get it. Until their is a compelling reason for slow or cooling periods, sceptical but naieve members of the general public will interpret "stopped" as in global warming is finished, or the theory is flawed. Thats the impression I get listening to people. The climate science community needs much better explanations of flat or cooling periods if it wants to convince people. Obviously there are reasons that have not yet been adequately adressed or discovered. Vague waffle about sun spot cycles wont work. There must be precise reasons.
    0 0
  7. @nigelj writes: "Any glance at a long term trend shows it hasn't stopped as a long term process, but naive members of the public don't get it." The explanation I always use when I hear the uninformed saying such things is to ask them if they've ever stood on a beach and watched the tide coming in. The long-term trend (the water level steadily rising) is hidden behind short-term variability (the size of waves washing up the beach). They cannot argue against this analogy and it usually makes them think.
    0 0
  8. 7, John, That's awesome. It is a perfect analogy, which fits superbly with virtually everyone's personal experience. I'll have to remember it.
    0 0
  9. I also like the analogy of stairs. Anyone can walk straight up the steps without hesitation. But plenty of people will hesitate or pause for no particular reason. Tourists might spend considerable time getting the best possible photo angle of a building or a fountain in the area on their relaxed walk up to another attrction. Children will fool about or fuss or choose to take a few steps back every now and again for no reason any observer can discern. And then there's Fred Astaire.
    0 0
  10. @Sphaerica,8 Thanks. It's also an effective explanation for why it's no good looking at just a few years of temperature records to claim warming has stopped. You need to record at least 30 years -- or in the case of the analogy, 30 waves -- to show a meaningful trend. If you want to take the analogy even further: by cherry-picking a series of waves between a high one and a subsequent lower one, you could even deny that the tide is coming in. And even, if you're so minded, maybe start a website to undermine the efforts of the 'tide-ists'?
    0 0
  11. michael sweet: "Dr Pielke many times asserted that OHC should be the metric whereby AGW was measured. On the other hand, he claims that the deep ocean has not been accurately measured. How can these two statements be reconciled? If we do not know how much heat is going into the deep ocean, OHC cannot be used as the primary guage of AGW." The two statements can be easily reconciled if one's goal is to use one's influence to argue that uncertainty means we should delay action. Once scientists get a good handle on OHC trends he'll think of something else, I'm sure.
    0 0
  12. If snarky comments turned readers of climate blogs away, WUWT would be a 10-person (-snip-), instead of being one of the most-viewed. I'm continually impressed with the civility I find here after reading through some of Watt's threads. At least half the headlines in any given week should flunk Pielke's snarkiness test. If anything, upping the snark would only increase the readership, though it might be very, very stressful for the mods.
    0 0
    Response:

    [DB] Inflammatory descriptive term snipped.  This is not one of those blogs where such is allowed or even encouraged.

  13. On ocean heat content of upper 700m - following the ups and downs (with it's partial correlation to ENSO) it looks to me more like it hit a new high in 2003 that it failed to come back down from - which, in the absence of global warming would be anomalous. Interpreting that as levelling off or cooling doesn't strike me as warranted - now, had that steep rise been followed by a steep fall that took it to 2001-2 levels it might be properly interpreted as a levelling off. By the time the next el Nino assisted 'up' has come and gone any interpretion of levelling off or cooling over the few years from 2003 to 2011 will be shown to be natural variations on top of a clear warming trend.
    0 0
  14. Ken in Oz: There is an acknowledged spliceing problem when ARGO data was incorporated with the XBT data in the 2000-2003 time period. OHC has leveled off since 2003, temps have dropped as confirmed by BEST. A period of cooling overall is very evident.
    0 0
    Response:

    [DB] "OHC has leveled off since 2003, temps have dropped as confirmed by BEST.  A period of cooling overall is very evident."

    Umm, no.  Incorrect, nonfactual and unsupported (take your pick).

  15. Ken in Oz - The upper ocean (down to 500 metres) is very strongly associated with ENSO due to the tilting of the thermocline. So the fact the 700 metre layer heat content has stagnated in the last 5 years, when La Nina has dominated, is hardly surprising. This is something Dr Pielke should be aware of, but apparently isn't. Regardless, as seen in figure 1, the oceans below 700 metres are readily warming up. More on this in an upcoming post. But note the interesting trend between the various ocean layers: SkS commenter jsquared broke down the NODC data into Northern & Southern Hemisphere components too: So just looking at the 700 metre layer really tells us little about the ocean warming as a whole. And that is the whole point of the SkS article Ocean heat content and the importance of the deep ocean.
    0 0
  16. Camburn at 14 - radical claims need to be supported. What is your source for stating: "temps have dropped as confirmed by BEST. A period of cooling overall is very evident."?
    0 0
  17. BEST is actually dead flat since 2003, though as we all know, 8 years is too short of a timeframe to make any meaningful statements.
    0 0
  18. Dana, Camburn's bowl of cherries also included a leveling of OHC since 2003; a claim clearly refuted by Rob's graphics. Regardless, the "skeptics" (of whom Camburn is but one) love to focus on the noise in hopes of taking the focus off of the larger trend (which is significantly up). It would seem that the only thing significant about Camburn's 8-year trend is that "skeptics" simply choose not to understand what significance really means in science.
    0 0
  19. Camburn, your comments merely show that you have not been accused of insanity or associated with the KKK at WUWT. I have (for both), the former by A Watts himself. When the latter was pointed out, A Watts first deleted the post, and the offending post, but then falsely accused me of being the only person to mention the KKK on the thread.
    0 0
  20. It would absolutely weird if the global surface temperature trend wasn't following the trend of the surface ocean given that the oceans cover around 70% of the Earth's surface. But as the observations show, most of global warming is going into the oceans, and a large chunk of that is going into layers below 700 mtrs. This is why I tend to agree on Dr Pielke on this one issue, OHC is a great metric of global warming, but only if we can measure right down to the bottom. The 700 metre layer just doesn't cut it, even though it is largely responsible for surface temperature trends.
    0 0
  21. actually thoughtful, in one BEST paper they show a temperature reconstruction from a random selection of 2000 sites, excluding all sites used by either the NCDC, GISS, or Had/CRU. That represents just 6.5% of all available stations. Because those agencies use the best available sites, and because there are few available sites not used by those agencies in many parts of the world, the reconstruction based on a limited selection of BEST only sites is very noisy (conspicuously so), and shows a decline in temperature over since 2002. Camburn is apparently quoting that reconstruction as being the full BEST reconstruction, which is of course incorrect. From his example, we can expect this to be a new denier meme in the near future.
    0 0
  22. Dana1981: Best has a cooling bias since 2003. Daniel: The quality of the deeper ocean readings is such that one can not make a case that they have warmed, nor cooled. The error bars are just to big as of yet. The 0-700 meter readings are basically flat, with a cooling bias since 2003. I agree, the time period since 2003 is to short to conclude that the trend of warming has stopped. One thing for sure tho is it has not accelerated.
    0 0
    Response:

    [dana1981] First of all, the word you're looking for is "trend," not "bias."  Secondly, when somebody shows you the data that proves you're wrong, and you still maintain that you're right, I think that's the very definition of denial.

  23. Dear "skeptics" and those in denial about "AGW", Please, instead of trotting out long debunked myths and cherry picking, could you focus instead on the scientific discourse between SkS and Dr. Pielke, and Dr. Pielke's misrepresentations and disregard for professional statistical practices. If you wish to try and defend those by using accepted statistical methods and the peer-reviewed scientific literature, then by all means go ahead. Thank you. Interestingly, the posts thus far by Pielke apologists and "skeptics" are only reinforcing the truth behind Dana's statement: "Dr. Pielke, on the other hand, seems to constantly try to feed these "skeptics" ammunition for their arguments. For example, as we have discussed here, Dr. Pielke cherrypicked data in an attempt to argue that TLT and OHC have not increased since 1998/2002/2003/etc. in an attempt to argue that the warming has stopped. The "skeptic" interpretation of these comments could not be easier to predict - "Dr. Pielke says that global warming stopped a decade ago." So a heartfelt thanks for so nicely proving our point.
    0 0
  24. Tom: GISSTEMP tells us that the number of sites used is not important. The BEST data in the reconstruction that you are talking about should match fairly closely the other sites used. From what I have been able to read so far, BEST shows that CONUS has not warmed in the past 100 years. I can agree wholeheartedly with that as that is what all of the temp data from the NOAA site indicates, and it is born out by old folks living here. Yes, antidotal, but true.
    0 0
    Response:

    [DB] "From what I have been able to read so far, BEST shows that CONUS has not warmed in the past 100 years."

    Perhaps you will need to re-read that passage.  Of course, the experts at NASA/GISS would take issue with the veracity of your statement:

    CONUS

    [Source]

  25. Albatross: Long before Dr. Pielke Sr. stated that, I stated that. I look at the error bars of the metrics in question. Dr. Pielke Sr. saying the OHC has been flat since 2003 is totally correct with the information and length of credible measurements that we have today.
    0 0
    Response:

    [DB] "Dr. Pielke Sr. saying the OHC has been flat since 2003 is totally correct with the information and length of credible measurements that we have today."

    Actually, the only way your statement would be correct would be to word it as follows:

    "Dr. Pielke Sr. saying the OHC of the 0-700m has been flat since 2003 is consistent with the information and length of measurements (which are admittedly incomplete as they do not monitor the full depths of the oceans) that we have today. 

    But of course, any time series of that short of length has no meaning anyway; therefore, Dr. Pielke's statement itself only serves to confuse those with a passing understanding of the science."

  26. Tom@19: No, I have not been accused of anything at WUWT. I seldom post there as I am not an ardent follower of that site. As far as the KKK, if someone made that accusation, that is intolerable. As far as you being insane?....mmmmm.....(Ok. I am laughing, that is a reallllly good one.)......I hope?...:)
    0 0
  27. Camburn, "Dr. Pielke Sr. saying the OHC has been flat since 2003 is totally correct with the information and length of credible measurements that we have today. " That is simply not true. Please, these antics are getting offensive, they really are. The oceans are not 700 m deep. And, regardless, the 0-700 m OHC has most definitely not "been flat" since 2003 as we have shown here at SkS: "However, we examined the data from several studies on the subject (provided by NOAA), and found that between 2003 and 2009, the upper 700 meters accumulated between 1.1 x 10²¹ Joules (Levitus - though this reference may be slightly out of date), and 5.6 x 10²² Joules (Palmer), with Willis et al. falling in between at 5.1 x 10²¹ Joules. " You can verify that yourself by downloading the data and analyzing them. You are making demonstrably false and unsubstantiated claims, and defending Pielke's cherry picking with you very own cherry picking. Beautiful. In doing so, all that you have demonstrated is 1) your complete disregard for proper statistical analysis, 2) that you are ignoring internal variability in the climate system, and 3) that you are ignoring the fact that the Argo floats measure data down to 2000 m, and 4) that you believe the warming should be monotonic (which is has not been and will not be).
    0 0
  28. Camburn#24: "BEST shows that CONUS has not warmed in the past 100 years." So that must mean you have not looked at anything related to the BEST data?
    0 0
  29. Rob @20: This is why I tend to agree on Dr Pielke on this one issue, OHC is a great metric of global warming, but only if we can measure right down to the bottom. Um, my recollection is that Dr. Pielke has a much stronger position on this one: he keeps arguing for using OHC as the primary metric. I would agree that it is a good one, but his attempt to discount everything else seems unwise. Camburn @25: Dr. Pielke Sr. saying the OHC has been flat since 2003 is totally correct Only if you ignore the error bars (and stick to the 0-700m layer), which you claim to look at. Slopes of regressions have error bars, too.
    0 0
  30. Camburn#22: "Best has a cooling bias since 2003." Already addressed here. Statistically insignificant.
    0 0
  31. muoncounter: No, I have not had enough time yet to fully digest BEST results. Their press release indicated that CONUS had not warmed, which is correct. With that statement, I think the rest of the results will be accurate. Bob: Yes, slopes of regressions have error bars. Albatross: I have not read anything that can establish with certainty a warming of the OHC to 2000M. The quality of the data with XBT was not good. ARGO is much much better, but the length of time is not sufficient to state that a genuine warming has occured. I will agree with many things concerning AGW. I will not agree with statements made with a certainty that is not there.
    0 0
  32. Camburn : "OHC has leveled off since 2003, temps have dropped as confirmed by BEST." Oh, but I thought BEST confirmed that the globe was warming ? Better check what they actually stated :

    In so doing, we find that the global land mean temperature has increased by 0.911 ± 0.042 C since the 1950s (95% confidence for statistical and spatial uncertainties). This change is consistent with global land-surface warming results previously reported, but with reduced uncertainty. Berkeley Earth Temperature Averaging Process

    That's strange : BEST actually reckon the globe is significantly warming and Camburn reckons that BEST 'confirm' that temperatures have dropped. Now, who to believe and rely on...
    0 0
  33. Everyone, Camburn is clearly trying to derail the thread in an attempt to shift the attention away from Pielke, there is a name for doing that. Discussing (and misrepresenting) the BEST data is off-topic, and can be done on that thread. Can we please try and keep our eye on the ball? Thanks.
    0 0
    Response:

    [DB] "Camburn is clearly trying to derail the thread in an attempt to shift the attention away from Pielke, there is a name for doing that.  Discussing (and misrepresenting) the BEST data is off-topic, and can be done on that thread."

    Agreed.  Take the details to the pertinent threads.  This thread is about Pielke Sr. and SkS Dialogue Final Summary.  And the word you referred to is "trolling".

  34. SkS readers, Here is what the oceanic heat content (OHC) data look like, with error bars. [Source] Regarding uncertainty of the full depth Argo data, this is what von Shuckmann and Le Traon (2010), found [my bolding]: "Annual mean GOIs from the today’s Argo sam[p]ling can be derived with an accuracy of ±0.10 cm for GSSL, ±0.21×10^8 Jm-2 for global OHC, and ±700 km^3 for global OFC. Long-term trends (15 yr) of GOIs based on the complete Argo sampling (10–1500m depth) can be performed with an accuracy of about ±0.03mmyr-1 for steric rise, ±0.02Wm-2 for ocean warming and ±20 km^3 yr-1 for global OFC trends." Those readers, are the facts, the statistics.
    0 0
  35. Thank you Albatross: when you enlarge the photo, you will see that a flat reading is very possible within the error bars of the 0-2000M readings. The same can be said of the 0-700M readings.
    0 0
    Response:

    [DB]  This is off-topic on this thread.  Take it to one of the OHC threads.

  36. Although I've been reading SkS for a while, I've only recently begun posting here, and the discussions with Dr. Pielke have been interesting. (I've also been involved with discussions with him at RealClimate, which followed similar patterns, but we'll stick to the discussion at SkS here.) As a general comment on the exchanges with Dr. Pielke, I find it particularly illuminating that he so frequently avoided direct questions, and so frequently dealt with repeated questioning by saying things like "let's agree to disagree" or "let's move on". I once went through a mediation session with someone who would make unsupported (and in my mind, incorrect) claims about stuff (the stuff that we were in mediation about). I would of course challenge these claims, which would lead to a period of discussion about why we each held the views that we held, and nearly every time it looked like I was correct, he would stop this discussion before it could be finalized. He would say things like "let's agree to disagree", or "well, it looks like we won't be able to resolve that now" - basically anything to prevent ending up at a point where he would be clearly shown to be wrong. The key elements of this behaviour were two-fold: 1) his method of ending discussion made it very difficult to actually resolve anything, because he was a) usually wrong, and b) unwilling to let the discussion go to places that would show he was wrong. 2) he had a habit of going back to the same point later, treating it as if he was correct, and pretending there had never been any discussion that questioned his correctness. He would hold that view because I had not proven to his satisfaction that he was wrong. This, of course, led to us having the same debate again... I have no idea whether he thought this pattern was a clever debating strategy, a reasonable way to discuss things, or a sub-conscious psychological method of avoiding admitting he was wrong, but it surely was not a constructive process. At times, he would actually lose his temper, and I suspect that the "agree to disagree" type statements were a way of ending the discussion before he lost his temper. As for Dr. Pielke, he exhibits some of the same traits. Clearly, he seems more comfortable in an environment where his statements are not examined critically. His tendency to leave the discussion to return to his own blog where he can say what he pleases without opposition is quite telling. He is, or course, free to do so - his blog, his rules - but it makes him look (to me) as someone that wants a soapbox, not a scientific discussion. The fact that he thinks that SkS has "an argumentative manner of debate" and snarky comments, but sees nothing particularly wrong with WUWT, says to me that he only looks at tone when the comments disagree with him. It's just a way of avoiding substantive discussion that isn't leading where he wants it to lead. Overall, his participation here has not left me with a favorable impression of him, science-wise.
    0 0
  37. Re: Camburn @ 35 when you enlarge the photo, you will see that a flat reading is very possible within the error bars of the 0-2000M readings. ...and it is also possible to place a very steep line within the same short period of data (with error bars) - much steeper than the long-term statistically-significant trend. But that would be cherry-picking, not science. At the very least, it's good to know that you know about errors bars on regression slopes. Please stop abusing them.
    0 0
  38. Camburn: The Skeptical Science team has carefully laid out the remaining points of disagreement between themselves and Dr Pielke. If you have anything to add to this post pertaining to those points of disagreement which you feel bolsters Pielke's position, please share it. Assuming, of course, that you have the goods (empirical evidence or solid statistical reasoning). There are, if memory serves, three other threads on BEST. Please take any quibbles regarding the BEST results to them.
    0 0
  39. Even Dr. Pielke has admitted that the upper 700 meters of OHC warmed since 2003, and of course when we include the deeper layers, the warming is even larger. All of this is discussed in the post above. Camburn seems determined to deny this, but the thing about denial is that it doesn't change reality.
    0 0
  40. Camburn @24, I have responded to your points elsewhere, where the comments are on topic. In brief, I show a graph of the BEST temperature results for CONUS showing a positive linear trend over the last 100 years. The graph matches the pattern shown inline by DB @24. I also point out the need for spatially homogeneous sub-samples to avoid distortions, a requirement not met by the BEST sub-sample on which you relied. Please respond on the other thread.
    0 0
  41. Camburn @35, Dana noted above Dr Pielke's abuse of imprecision about statistical significance. You show the same pattern. In particular, while it is possible to draw a line from a point inside the 2004 1 sigma error bars and a point inside the 2011 1 sigma error bars which is flat, trend lines are not determined by drawing a line from peak to peak, still less from peak to trough as is so often done by so-called "AGW skeptics". Because of the relatively low 2006 values on that graph, a trend line from 2004 to 2011 would rise.
    0 0
  42. Well, my reaction to all this is a sense of deja vu. As a student of communication strategies, the discussions have followed a path very similar to that employed by Pielke in response to my basic rebuttal on this site of his claim that 'global warming has stopped' based on a single metric - that of upper OHC. The constant shifting of goalposts, the obfuscation, the claim to be offended by 'allegedly' personal remarks while also making them (e.g. 'snarky'), all conform to the pattern of rhetorical sleight of hand on display in my previous discussion with the man. I have written about my encounter, and the patterns employed by people who I find disingenuous, here: http://wp.me/pv7Zf-9J That said, I think the manner in which the discussion has been held, moderated and maintained by SkS is a credit, both to the site and to the discussion of science. You have exposed the weakness in Pielke's science, and allowed him sufficient rope, as it were. Those who can be bothered to check the facts, the arguments and the rhetoric can, as ever, decide for themselves who is properly sceptical, and who is not.
    0 0
  43. gpwayne @42, an incitefull essay, which deserves an easier link. One part I particularly enjoyed was the comment on the similarity in argument style between creationists, 9/11 tuthers, and AGW deniers, a commonality I have noticed myself:
    "In his 2005 book The Wisdom Paradox, clinical professor of neurology at New York University School of Medicine Elkhonon Goldberg wrote that pattern recognition was an aspect of perception that does not deteriorate as we age, and may in fact improve throughout our lives. What we describe as ‘wisdom’ is often an ability to deduce hidden or opaque information, sometimes with (apparently) very little to go on, because we recognise the patterns. When Pielke turned up at the SkepticalScience site to defend his position, the patterns emerged thick and fast. My familiarity with his methods owes much to the time I have spent in CiF arguing with AGW sceptics. Not just them, but creationists, 9/11 troofers, Millennium bug deniers, even – to my surprise, since I thought we’d really nailed down the lid of this particular coffin – a few ozone hole sceptics, emerging from their foxholes to discover the war was over, and they lost. Methods employed by these disparate groups are remarkably similar, and consistently inconsistent. In particular, if you have a really good argument, they will relentlessly avoid it."
    0 0
  44. I've found these "discussions" with Dr. Pielke very iluminating. I had assumed that Dr. Pielke, while occupying the "contrary" position on climate science, was essentially presenting his position in good faith, with an assumed set of scientific justifications. He's demonstrated very clearly that that simply isn't the case. Does he realise the impression of bad faith his discourse reveals? Perhaps he doesn't care. In any case and in line with the general philosophy of SkepticalScience this has been very educational and revealing.
    0 0
  45. Whatever their fan-clubs might imagine now, I strongly suspect that in the fullness of time history will look back very unfavourably on the 'scientific' pronouncements of the likes of Pielke and Curry. On the matter of the zombie meme about recent plateauing of global temperature, I would invite both Pielke and Camburn above to engage in this little exercise... 1) consider the scenario where global temperatures increase following the median trajectory described by the IPCC 2) consider too that this scenario unfolds with future annual temperature variability of the same magnitude as has been observed to date 3) on average how many years prior to 'present' would, at any random point on the future time-line, always be statistically non-warming, even when there is an underlying consistent global warming occurring, and even when there is absolute recent warming occurring? Once that has been properly dealt with, they could try this alternative: 1) consider the scenario where global temperatures increase following a severe-case trajectory described by the IPCC 2) consider too that this scenario unfolds with future annual temperature variability of the same magnitude as has been observed to date 3) on average how many years prior to 'present' would, at any random point on the future time-line, always be statistically non-warming, even when there is an underlying consistent global warming occurring, and even when there is absolute recent warming occurring? What do these answers say about folk who trumpet non-warming in short time periods immediately prior to present?
    0 0
  46. chris @44 I think it is more complex than 'Does he notice? Does he care?" After reading through a couple of the SkS 'Pielke Sr Dialogues' I saw symptoms which you would find in many old professors right across academia. All professors have their pet theories and will do their best to further them. Some push too far with what everybody considers cranky theiries and colleagues distance themselves. This can result in a 'bloody-minded' attitude from the theorist. And very occasionally they can be proved right so 'bloody-mindedness' does have a place in academia. Add to that the effect of being a lecturer/teacher where you soon find listening to what inquiring students are actually saying is a major effort and counter to the main job which is lecturing. So responding to questions can be often 'over-managed' to the point of not listening. All this is fine. It is the stuff of academia where pushing a cranky pet theory is hard lonely work. The problem in climatology today is the new non-academic audience who love cranky pet theories and who, like the cranky professors, don't listen to all of what climatology has to say. They are acting as a cranky professor re-invigoration system. Given the importance of climatology at this time, the last thing we need is loud cranky professors with their bad science.
    0 0
  47. Bob Loblaw @ 36 I have read some of your posts at Realclimate and you have made a succinct appraisal of Dr Pielke's modus operandi. He really does avoid the tough questions. I have the impression that when he talks about 'Joules of heat' that he really does not fully understand the principle of conservation of energy. Maybe this is just his poor expression, however he does make a valid point that ocean heat content should be the prime measure of warming. If 90% plus of the heat energy gained by the Earth is stored in the oceans then it must show up somewhere in the system. Temperature change and ice melt is a consequence of this heat gain. I do have a question for dana1981 though. From Figure 1 (Church et al) in your post - does the graph of ocean heat content take account of the instrumentation changeover from XBT to Argo measurement in the 2000-2003 period? The sharp spike in Rob Painting's graph @15 illustrates this better.
    0 0
  48. re: victull @ 47 I can't remember how much of the RealClimate discussions on ocean heat content paralleled the ones at SkS, but at RealClimate Dr. Pielke kept coming back with discussions of heat content whenever the questions dealt with heat flux. He threw out the occasional "flux divergence", but still would not deal with the questions related to absolute flux. Mathematically (and conceptually) they are very different entities (although highly related). I cannot tell from what Dr. Pielke posted (here or there) whether he doesn't understand the details, can't express himself clearly, or is intentionally trying to obfuscate, but it all leads to a lack of confidence (or, perhaps even a lack of trust) in his statements. As I read his discussions here and at RC, I kept thinking back to the movie The Princess Bride, when Inigo Montoya said "You keep using that word. I do not think it means what you think it means." ...but to get back to the ocean heat content question - I still disagree that it should be the prime measure of warming. Yes, that is where most of the heat goes, but that is not sufficient to make it a prime indicator. When looking for an indicator, we need to consider several aspects of experimental design: 1) how easily can we measure something? 2) how accurately can we measure something? (somewhat related to 1, but not quite the same) 3) how sensitive is that variable to the process we want to study (i.e., the item we want to use it to indicate)? 4) how insensitive is that variable to other things besides our target process? Clearly, to look at the earth-atmosphere response to an energy imbalance (TOA radiation), heat content is an obvious choice (item 3) because there is a direct link. For this reason, an accurate measurement of OHC is valuable. It is, however, difficult, and with current technology certainly not cheap. Fortunately, scientists have convinced funding agencies that the expense is worth it, so we have systems like Argo. Evaluating OHC is not error-free, though, so good science includes the error bars on estimations of ocean heat content. The network to measure OHC is also relatively recent, so there are very severe limitations on what we can do with it now, due to the short record. Keep it going, for sure. As the record grows in length, it will become more and more valuable. A few other implications of my list: - the combination of 2 and 3 deals with the question of how accurately we need to measure something for it to be useful. Uesfulness is always defined in terms of the current question. - the combination of 3 and 4 relates to signal-to-noise ratio. It is better to use an indicator that has a high signal-to-noise ratio because changes are more easily detected, even if this indicator is is not the primary consequence of the process in question. Have you ever wondered why lighthouses blink on and off? When approaching a coast on a dark and stormy night, it is extremely difficult to pick up a steady light that very gradually gets brighter. A blinking light, on the other had, becomes obvious quite quickly, even if that light (when on) is much dimmer than a steady light. (Changing the on-off pattern also allows unique identification of a particular lighthouse, but detection is a key reason.) The World Meteorological Organization has a set of principles for its Global Climate Observing System that relate to monitoring of this sort: GCOS Climate Monitoring Principles. I think that Dr. Pielke's apparent desire to downplay all other indicators of global warming violates several of these principles (2, 6, and 9 in particular). One aspect that I think Dr. Pielke was in agreement on was that the only way for heat to get into the ocean was through its surface (i.e, geothermal heat from the ocean floor can be ignored on a global scale). One of the implications from this is that you have to see a change in sea surface temperature (SST) before you are going to see a change in OHC. Yes, SST can go back down as heat goes deeper, so OHC is better, but SST can tell us a lot. And we have much longer records of SST than OHC. As OHC records get longer, we'll know more about how SST and OHC can be used together, and perhaps some day OHC is all we'll need, but for now SST is more useful, largely because of its longer and more spatially-distributed record. When it comes to establishing the uncertainty of a particular measurement, a good place to start is the ISO guide, commonly just called GUM. Unfortunately, it isn't free. This is getting long. As the whole OHC as primary measurement is part of Dr. Pielke's position, I think I'm still on topic, but if someone wants to suggest moving the discussion elsewhere, I'll follow.
    0 0
    Response:

    [DB] Hot-linked quote.  Bob, you touch on some very interesting points all worthy of further exploration.  Would you be interested in writing this up as a guest post?

  49. gpwayne, I just read your post and had to double-check to make sure you weren't talking about this latest exchange between Dr. Pielke and SkS! Deja Vu is spot on, the exact same behaviors were showing up in spades this time around. I've also seen him go around in circles when trying to discuss things in the comments at RealClimate. It's a shame that the subject he seems to muck-around so much just happens to be the one in which he's a credible expert. I don't know that he's intentionally doing it to ingratiate himself with the outright deniers, but as you (and others) have pointed out they're more than willing to use his misleading statements as ammo, and he seems totally unwilling to disabuse them of that tactic.
    0 0
  50. Rob@15 It seems clear that the upper ocean heat content is strongly influenced by ENSO and it's also clear that there is good reason to believe the steep rise such as that preceding the post-2003 high plateau Camburn and others interpret as levelling off or cooling is a true representation of data. Nothing seems to be pointing to a genuine end of the underlying warming trend or give reason to believe further steep rises won't occur. That steep rise plus high plateau look likely to average out to a strong warming trend, as steep the preceding 8 years but I'm not equipped to do such a calculation.
    0 0

1  2  Next

You need to be logged in to post a comment. Login via the left margin or if you're new, register here.


The Consensus Project Website

THE ESCALATOR

(free to republish)


© Copyright 2024 John Cook
Home | Translations | About Us | Privacy | Contact Us