


 Arguments


New study by Skeptical Science author finds 100% of atmospheric CO2 rise is man-made
Posted on 6 June 2013 by MarkR
I have a new paper (Richardson, 2013) in the journal Global and Planetary Change that calculates the man-made and natural contributions to changing atmospheric carbon dioxide (CO2) since 1980. It comments on a study by Humlum and others (2013) and uses the same data and part of the same approach as them, but gets a completely different answer. I do this because I follow the maths to calculate the size of each effect and I find that the entire rise in atmospheric CO2 is man-made.
Humlum et al’s paper caught my attention when it said that “CO2 release from use of fossil fuels have little influence on the observed changes in the amount of atmospheric CO2”. ‘Skeptics’ called it a ‘blockbuster’ paper and that’s a good description: if true, Humlum et al had just disproven the conservation of mass. This should put them top of the list for a Nobel prize and it was such a big deal that I read the paper twice, ran the numbers myself and then emailed Ole Humlum to check I was doing it correctly. But using maths, I couldn't come up with the same conclusion as they did, I got completely the opposite answer!
After providing enough information to check I was following his method, he then seemed to be too busy to respond to my other questions and calculations. This left me with the usual scientific way to check my work: to write a paper and submit it to a journal where it will be anonymously reviewed by experts. After these hurdles, the article is now in press.
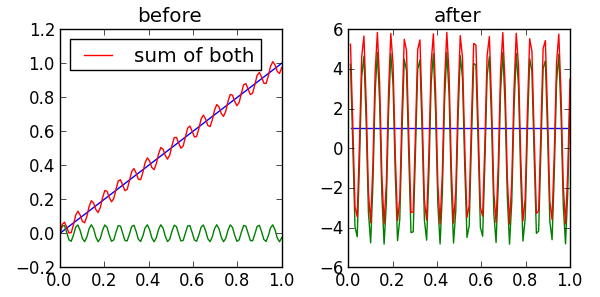
Figure 1 This shows part of the mathematical approach of Humlum et al that I had a problem with. On the left is a real signal (red), which is made up from 2 signals 'blue' and 'green' added together. The red line has wobbles from the green line, but its constant increase over the graph is entirely because of the blue line. One part of the mathematical approach used by Humlum et al is called differentiation, which turns the left-hand graph into the right-hand one. Now it looks like the red line is related to the green one but not at all to the blue one. The blue contribution has been 'hidden', but with the right maths you can find it again.
Problem one
My first problem was that the amount of CO2 in the atmosphere is going up by 15 billion tons a year, and humans are emitting 30 billion tons a year. So nature's net balance must be an absorption of 15 billion tons a year from the air. If it is a net absorber, then it is not a net emitter and any opposite claim has to show how 30 billion tons of man-made CO2 is disappearing. Nature still emits some CO2 but the net effect is absorption. Just like how your bank account might sometimes have money coming in and sometimes money going out, but the overall flow might be in (lucky you!) or out.
Problem two
But what about Humlum et al’s calculations showing that there is a correlation between natural CO2 and atmospheric CO2? I find that as well, but while Humlum et al only report the ‘correlation coefficient’, I go a bit further. ‘Correlation’ just means that two things change in the same direction as each other – when one goes up, the other goes up and vice versa. It doesn’t say whether it's a big change or a tiny one.
I calculate the strength of the relationship between the two and find that for every degree Celsius that temperatures go up, the CO2 in the air later goes up by 1.9 parts per million (ppm). Humlum et al didn’t report this number, but the 50 ppm rise in atmospheric CO2 since 1980 would need a 30 C (over 50 F) rise in average temperatures rather than the half a degree C we've seen. That's like warming from Greenland to Miami rather than the 0.5 C warming we've measured since 1980.
And that’s not all; not only do their results break conservation of mass, and not only do the numbers that fall out of their calculations show that the natural effect is too weak to cause the rise, but there is another mathematical misstep mixed into the method.
Problem three
Humlum et al's procedure involves detrending, which measures the change in a value. If something is increasing at a constant rate, then differentiating it will turn that constant up slope on a graph into a flat one. It 'hides' any constant long term changes and emphasises any short term 'wobbles'. The graphs at the top of this post, labelled Figure 1, shows this effect.
In these graphs, the cause of the long-term increase has been hidden away by flattening the blue line. But because the red and green lines change in-sync with each other the correlation coefficient reported by Humlum et al is 1.0 (perfect correlation) between the red and the green line, and 0.0 (no correlation) between the red and the blue. Even though the entire long-term increase is caused by the blue line, there is now no correlation, and this seems to the basis for Humlum et al's conclusion about the cause of long term changes in atmospheric CO2.
Problem four
What about the conclusion that human emissions of CO2 don't correlate with atmospheric CO2 change? I find that there is another step in their approach which hides this correlation.
For most of the data used, Humlum et al consider the balance of the carbon flows in terms of how much carbon changes per year, i.e. the 'speed' of carbon change. Like the speedometer on your car which might give a speed of miles per hour (or km per hour), the speed of carbon change is given as ppm per year.
That is, until it comes to human emissions of CO2. Humlum et al take public data and then perform their procedure to each of them in turn. But it appears that Humlum et al didn't realise that the human emissions data are already reported as a speed of carbon change. When they perform their detrending operation they convert this speed into an acceleration, and then they compare this acceleration with the speed of carbon change in the atmosphere. I follow the maths and suggest that we should compare like-with-like, i.e. speed-with-speed, and if you do this then the correlation between human carbon emissions and atmospheric CO2 reappears.
My results
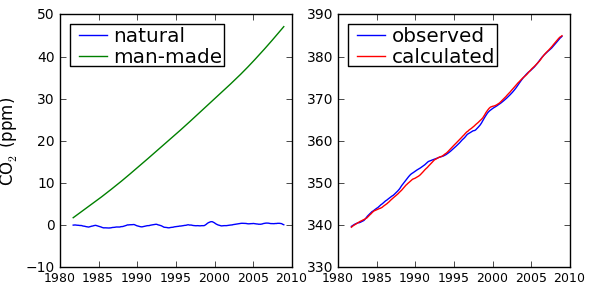
I find that the entire atmospheric increase in CO2 can be explained by human emissions, and that the natural contribution can't be distinguished from zero. If you look at the graph below, it shows my calculated contributions to the change in atmospheric CO2 individually (on the left), and on the right their sum versus the actual change. Using my approach, the calculated CO2 change is always within 0.5% of the actual value, and the entire rise in atmospheric CO2 is man-made.
I reckon this shows that when a study comes out that claims to overturn centuries of scientific studies, it's worth being skeptical until others check the results. Thanks to the universities and research groups which make their data publicly available online, I found it easy to run these checks. As more and more data goes online, this is an exciting opportunity for non-specialists (like me!) to have a go in their spare time, if they're geeky enough to be interested. But these new developments don't mean we no longer need anything from old-fashioned science. Anonymous peer review in scientific journals isn't a guarantee of perfection, but it's still a vital way of filtering out ideas which aren't properly supported by evidence, or plain old junk.
Testing old ideas is an important part of scienceand Humlum et al seemed to have found something amazing, with correlation results that certainly sounded good. But it seems that their big picture approach missed some details. In this case, the details they missed were so important that their conclusions are completely the opposite to reality.


Excellent!
Over here in Denialostan (Norway), Humlum is heralded as somewhat of a hero and is the man journalists rather often go to when they need an opinion on climate issues. Ridiculous but true.
The anti-science movement has huge momentum up here these days. Almost no attention is paid to the disapearrance of the nearby Arctic sea ice and the huge increase in serious flooding seen over the past few years, the latest deluge still ongoing. Latest poll shows that the majority of the population is not the slightest worried about the rapidly changing climate. Oh well.
Well done Mark, writing comments papers is normally a bit of a thankless task, but I think it is important nevertheless.
It is well worth remembering that getting a paper published is the first step in its acceptance, not the last. Before getting too excited about a paper it is well worth waiting to see if it either results in a comment paper, or if it recieves very few citations. Both of these things are indicators that a paper is flawed or of little value to the scientific community. It is a shame the press releases for "gamechanging" papers happen when the paper is published, later on when it is found to be dull/flawed/wrong and not "gamechanging" afterall, it is no longer newsworthy.
First, congrats.
I do have a question, though. As per your Problem 4, the original paper did not treat human emmissions as a "speed", but looking at the quote below from another thread here (how do natural and human CO2 emmissions compare)
(Moderator - couldn't get the graph to display - a little help?)
My question is this, both the FF emmissions and the natural emmisssions appear to be the same type - both are fluxes.
Why did you find the need to treat the human emmissions differently?
[Dikran Marsupial] Figure added, hopefuly this is the one you wanted.
@HJones, FIgure 1 in AR4 only shows representative volumes of the annual fluxes, it doesn't tell you anything about their variability, which is what Humlums' argument is based on. Sadly Humlum is making pretty much the same mistake as Salby correlations tell you about the similarity of the "wiggliness" of two datasets, but it tells you nothing about their average values. It is the average values of the fluxes that governs the increase in atmospheric CO2, not the "wiggliness", which is why Humlum's conclusions are incorrect.
Hi HJones @ #3
I didn't treat them differently. I converted both of them into fluxes and then compared them like-with-like.
Humlum et al's method took all the data they could find and then did something that would turn a lump sum into a flux. But they didn't realise that the human emissions data they took were already a flux. They converted the flux into the rate-of-change-of-flux.
In my comparison I determine an estimated natural flux in ppm yr-1, the human emissions in ppm yr-1 and total atmospheric change in ppm yr-1. Humlum et al instead turned the human part into ppm yr-2, so it is them who treated the human emissions differently from the others.
Dikran Marsupial,
Thanks for the help with the figure. I had a simpler one in mind, but essentially the same data. I realize that it is the variability that Mark is discussing.
MarkR,
They already are both fluxes. Looking at your figure1,the green line- human emmissions - it appears to be continually increasing. Since it is a flux, the flux must be increasing. Human emmissions have not increased by a steady rate. The increase would be best described as exponential, up until the recent world wide recession. There has been decreases in emmissions, and most definately decreases in the rate of the increases (I know poorly worded - the exponential characteristic of the increase in emmissions has flatlined) -
Since your graphs don't encompass this recent "slowdown", I don't know if you studied anything more recent. Looking elsewhere, the CO2 seems to climb fairly steadily (~ 2ppm/yr) - wouldn't there be a corresponding slowdown in the increase in ppm? If it is 100% human - a slow down in emmissions should have a slowdown in resultant ppm, correct?
HJones@6 Please provide a reference that doccuments the "slowdown" that you expect to see.
This source shows a drop in CO2 emmissions in 2009. They also show that for the past decade, the avg ppm increase in CO2 was 2.1 ppm/yr, and for the prior decade, the avg was 1.7 ppm/yr.
Looking at their graph, there was NO drop of CO2 concentration in 2009.
http://co2now.org/
HJones, at the bottom of the page you mention, it says:
"CO2 emissions grew 5.9% in 2010 to reach 9.1 GtC (33.5Gt CO2), overcoming a 1.4% decrease in CO2 emissions in 2009"
I wouldn't expect a very noticable "drop-off" firstly because a 1.4% isn't very much, and secondly because the natural net flux has a fairly high annual variability that is likely to mask changes as small as 1.4%. I rather doubt the 5.9% increase in 2010 (assuming that figure is correct) will be very visible either, as it would represent a 5% change in the slope of the plot over the span of a year, which would be a change of the order of a single pixel.
That is my point. The natural net flux cannot mask it as the increase is 100% human caused. Not 98%, 100%.
Not to mention the natural fluxes are a whole order of magnitude greater,and yes, the variations in the natural flux is not only bigger than human emmission variations, they are likely bigger than the actual human emmissions period.
HJones, I think you need to go and read some of the previous SkS articles on the nature of the carbon cycle. The annual rise in CO2 is about half of anthropogenic emissions, the rest is taken up by the environment (the natural net flux is negative). However that is only what happens on average, sometime the natural environment takes up more than half of anthropogenic emissions, sometimes less. The magnitude of this flux is much bigger than 1.5% of the anthropogenic flux.
Your second paragraph misses the key point, which is that it is the difference between natural emissions and natural uptake that determines the environments effect on atmospheric CO2 levels, not the magnitudes of the fluxes themselves. This difference is (a) negative and (b) on average about half the magnitude of anthropogenic emissions.
HJones @6/8/10.
Anthropogenic CO2 emissions 1960-2010 aren't what you'd call "exponential".
The annual rise in atmospheric CO2 did dip in 2011 but this is more attributable to the La Nina event of that peaked in 2008 and far less attributable to the small reduction in CO2 emissions that year.
Some time back I created a graph using actual numbers (GISS temperature & MLO CO2) to rebut one of these Humlum type papers (it may have been the Murry Salby lecture) but the equasion being bandied about has been used with real data 1959-2012 and supports the veracity of Figure 1a in the post above, the green and blue of figure 1 being coloured pinkand red.
Hjones@8: Yes, there was a small drop in the yearly carbon emissions in 2009. But the cumulative carbon emissions increased in 2009 almost as much as before. It is therefore as expected that the atmospheric CO2, which is a cumulative value, also increased in 2009.
MA Rodger - Actually, as Tamino has pointed out, CO2 growth is faster than exponential, meaning forcings are increasing faster than linearly. Faster than exponential growth with a small exponent, mind you, but still faster than exponentially.
Quick test - take annual CO2 values, import to Excel, take the Ln( ) and graph. If growth was linear this would be a straight line, but it has an upward curve, hence faster than linear growth.
MarkR, Don't forget to add Humlum et al to the reference list in your comment when you get the proofs to review!
Thanks for the post, excellent work!
Humlum's paper is full of extreme statements, one example: "Empirical observations indicate that changes in temperature generally are driving changes in atmospheric CO2, and not the other way around.". Humlum 'forgot' the existence of ENSO and other factors that have a large influence on the annual growth rate of CO2. Scientific omissions, a professor unworthy.
For Dutch readers, we covered the online release of Humlum's paper in September 2012 on Klimaatverandering - Humlum: over emissies en omissies.
It's sad that we still have to combat such inane nonsense as this Humlum paper. Surely there are better things for intelligent climate scientists to be doing?
Differentiating a linear function yields zero. Differentiating a cyclic function (sine/cosine) yields a shifted cyclic function: removing a linear that way trend proves only one thing: the disinterest in the linear trend.
I wonder how this passed through "peer review". It would be interesting to have a correlation of "journal name" with "disproven paper" (as opposed to refined/enhanced paper) ...
On the other hand, we can interpret that thing in a different(iated?) way: temperature change (even the small detrended/differentiated change) correlates with CO2: QED! Thanks Humulum, you just "proved" the CO2 effect, and when switching back to the real world (non detrended), the result is: lineraly increasing human CO2 emissions cause climate change ...
KR @14.
And indeed Tamino was correct in his 'pointing' although the rate of increase in CO2 forcing has been looking somewhat borderline linear in recent years. This is perhaps surprising given the strong rises in CO2 emissions over the last decade. Certainly the slow rise in emissions during the 70s & 90s are now replaced by far faster rates, in ppm the fastest on record by far. Yet that is the thing with exponential growth - it is very difficult to maintain.
And it is mainly because of those 70s & 90s slowdowns that CO2 emissions are not exponential. Indeed the period 1960-2010 (or to date even) can be seen as less-than-exponential since 1969.
#15 chris : thanks for the mention, it appears to have dropped out due to a minor technical problem, I have contacted the publisher about returning the reference to the bibliography.
#6 HJones : Figure 1 is only an example of what happens with a linear trend and cycles. Two more points are 1) The green line is cycles, which would be the 'natural' case. The blue line is what would happen with a constant flux from humans. 2) the real human emissions (and contribution to atmospheric CO2) have accelerated, which was why a correlation was easier to pick out.
#18 Jonas : differentiating a linear function returns the gradient, e.g. dy/dx when y=5x returns 5. That's why my first graph has the blue line as a constant value of 1.
What you object to in Humlum's graphs seems to be that the constant nature of the increase in CO2---same gradient---when differentiated produces a flat line, showing that there is no acceleration in the rate of change of CO2.
If the CO2 in the atmosphere was caused by human emissions, with little or no natural contribution, surely the curve would have a changing gradient [no longer linear and constant] depicting the increases in emissions eg with China's huge growth in coal-fired power stations and cars etc in recent years.
@21
"What you object to in ..."
Please read the article again. You have just created a strawman.
"If the CO2 in the atmosphere ..."
You are beating the strawman, 1. by ignoring the discussion and information given by others before your entry, 2. by ignoring the overwhelming evidence. Pretty much what Humlum et al. did ...
Esop...
What no attention is paid to by many warmist scientists, is the role of black carbon in the melting of the Arctic sea ice.
Scientists, including Drew Shindell of NASA, Jacobson and Ramanthan amongst many others [ non-sceptics], met with Congress to tell them the results of research that showed that ~50% of the Arctic melt---and that of glaciers and the permafrost is caused not by CO2, but by black carbon[ soot] from the burning of forests and other biomass in China, India, Indonesia, other Asian countries and Brazil---and a smaller amount from the burning of diesel fuel.
Warmist scientists cite the Arctic melt as the trump card that 'proves' the earth is warming alarmingly, but they almost never mention the black carbon problem at all.
Yet Drew shindell said that there's no point in only going after CO2 mitigation, since black carbon can be relatively easily mitigated with almost immediate effect.
It would seem that scientists who don't mention BC, and pretend that the only impact on the melting in the Arctic is rising CO2 emissions ,are deceiving the world---not helping at all, when some clamor from them would help politicians to do what's necessary--especially as the Arctic melt has a catastrophic feedback in the lowering of albedo, by the formation of dark water where once there was ice.
[Dikran Marsupial] Discussion of black carbon is off-topic, this article is concerned with the cause of the increase in atmospheric CO2. If you want to discuss black carbon, please find a more appropriate thread.
reality@21 Humlums argument is based on a (already well known) correlation between the rate of increase in atmospheric CO2 and temperature. The rise in atmospheric CO2 is cause by the average rate of increase being positive. Correllations however are insensitive to the average value of the signals, so the correllation between the rate of increase in atmospheric CO2 and temperature can not explain the increase itself.
We know that the rise is caused by human emissions. Atmospheric concentrations are rising more slowly than cumulative human emissions, so consevation of mass means that the natural environment must be a net carbon sink, taking more CO2 out of the atmosphere each year than it puts in. There is a natural contribution, but it is strongly negative.
The reason that there is little rate of increase while anthropogenic emissions have been rising approximately exponentially, is that rising atmospheric CO2 concentrations mean that the natural net carbon sink has been strengtheneing as well. This gives rise to the constant so called "airborne fraction". If you are happy with differential equations, there is a worked example in the paper I wrote which is referenced in my SkS article here.
#21 reality
The top graph is just some functions I made up to demonstrate what one part of their approach does. I found the visual impact helpful.
The bottom one shows the components of CO2 rise and you can see that both human emissions and atmospheric CO2 accelerate. Over this time period the rates are extremely similar and if you directly compare atmospheric CO2 with human emissions then the correlation coefficient is about 0.99.
By differentiating it you cut the cooefficient drastically, to around 0.4. This is because the short term variability masks much of it on short timescales, which was the point I tried to make with the top graphs!
reality @21.
I would reinforce the message @24 by saying that you must be very careful with your language. You say " ...there is no acceleration in the rate of change of CO2." I don't know if the meaning is what you intended but it is not true. The rate of change of CO2 is not accelerating. Nor is it flat as you assert it is. It is increasing but roughly linearly, ie CO2 levels are accelerating at roughly a constant rate.
A further argument for 100% of the increase being human in origin is the constant ratio between rises in atmospheric CO2 and emitted CO2 . Over the last 50 years that ratio has remained wobbling between 40% & 50% . And this ratio remains totally unaffected by the addition of the emissions from "China's huge growth in coal-fired power stations and cars etc in recent years" which may feature large in press reports but whose impacts are best analysed numerically.
And long may that ratio stay 40-50%. If it starts dropping it will likely be due to feedback CO2 emissions from the melting cryosphere or warming oceans.
Mark, while the publication of your analysis is a wonderful response, I have to look at this Humlum paper and others like it with a growing sense of dread. It seems to me as if 'alternative realities' are creeping into science just as they have into politics, journalism, law, economics, and other formerly respectable fields.
How could this Humlum paper have gotten through peer review? Why would Global and Planetary Change publish it? How can the universities that employee the authors not be embarrassed to be associated with this?
I always thought that science was largely resistant to falsification because bad results would inevitably be uncovered and damage the credibility of all involved. Yet we seem to be seeing a lot of clearly wrong analysis getting published and no particular fallout when it is uncovered. Indeed, I doubt the denialsphere will stop praising Humlum in light of your findings... rather they will continue to accept his as valid and reject yours... creating two different views of reality. A situation I view with horror.
Obviously, there has always been fringe 'science' and from time to time it has gotten published... but am I wrong in believing that things have changed in that we are now seeing it actively celebrated and promoted even in the face of proof to the contrary? I fear a future in which publishing bad science can be a path to greater carreer success. Rupert Murdoch's News Corporation routinely puts out false propaganda in the guise of journalims... and is beloved for it. Radical ideologues routinely get appointed to the highest courts despite rulings bearing no resemblance to legal precedent or justice. Raving lunatics frequently get elected to high political office. The whole world is suffering from the guidance of economists who promoted austerity during a massive global recession.
If this kind of madness takes hold in the sciences we are truly doomed.
@1 Esop
Some positive: There was a good article/interview in Bergens Tidene last Wednesday (in Norwegian) with Bruno Latour, this year's Holbergsprisen vinner. He also made some excellent points about denying climate change in the print version, which I could not find online.
CBDunkerson wrote "How could this Humlum paper have gotten through peer review?"
Peer review can only be expected to be a basic sanity check, and sometimes the reviewers selected may not be sufficiently expert to spot the flaws. The more times a paper is submitted to a journal, the more likely it is that some journal will accept it eventually. Peer review has always been susceptible to the occasional failure, but science has adopted a good way of dealing with bad papers, which is to simply ignore them. The problem comes when papers are written that have impact on the general public that don't have the background to see the errors.
In many fields bad papers draw little attention from anyone, it is the public focus on climatology that means that the bad papers get exposed. If "skeptics" didn't draw so much attention to them in the blogsphere/press, the bad climate papers would be simply ignored as well.
reality, I'll be happy to discuss "climategate" with you on the appropriate thread. I'm professionally interested in what you learned from "climategate."
I thought the BEST group of physicists had proved once and for all that all global warming in last 250 years can be accounted for by volcanism and the log of CO2 concentration.
Rohde, R., Muller, R. A., Jacobsen, R., Muller, E., Perlmutter, S., Rosenfeld, A., Wurtele, J., Groom, D. and Wickham, C.: A new estimate of the average earth surface land temperature spanning 1753 to 2011, Geoinfor Geostat: An Overview, 1, 1, 7pp, doi: 10.4172/gigs.1000101, 2012.
This is consistent with the physics. The greenhouse gas is active in the upper stratosphere/troposphere boundary. To solar radiation Earth looks like a bubble. This bubble traps the heat. It is dependent on CO2 rather than water vapour that does not reach so high. Rohde et al., (2012) is consistent with this and explains all the temperature changes observed. What goes on inside the bubble affects that surface. Most of the surface is saltwater.
There is s similar boundary layer in the upper ocean that traps heat. According to Levitus et al., (2012) ocean heat accounts for 93% of anthropogenic global warming.
Levitus, S., Antonov, J. I., Boyer, T. P., Baranova, O. K., Garcia, H. E., Locarnini, R. A., Mishonov, A. V., Reagan, J. R., Seidov, D., Yarosh, E. S. and Zweng, M. M.: World ocean heat content and thermostatic sea level change (0–2000 m), 1955–2010, Geophys. Res. Lett, 39, L10603, 5pp, doi: 10.1029/2012GL051106, 2012.
Data from oceans is sparse at best with 1 degree lat and long coverage averaged over upper 100m only available since 1990s. What is needed is far better data on the 93% heat and rather less statistics on the 7%.
Unfortunately this requires going to sea and making actual measurements. It is timeseries of near-surface temperature and salinity data that holds the key. These are not available from satellites. Computer models are only as good as the field verification data. There are huge tracts of ocean for which data is lacking including the Pacific and the Arctic.
In my opinion it is time for a concerted effort to go to sea and get the data. It can only confirm what Rohde et al., (2012) showed - CO2 concentration is the principal driver of global warming; and confirm Levitus et al., that 93% of that is in the oceans.
With all this discussion of the problems caused by Humlum et al's analysis that differentiates the data first, I am reminded of a math joke told to me years ago by a mathematician friend. (Yes, I know. "math joke" is an oxymoron. Don't ask me to tell you the one about Noah and the snakes.)
Two mathematicians are in a bar, arguing about the general math knowledge of the masses. They end up deciding to settle the issue by seeing if the waitress can answer a math question. While mathematician A is in the bathroom, mathematician B corners the waitress and tells her that when his friend asks her a question, she should answer "one half X squared". A little later, when the waitress returns to the table, A asks her "what is the integral of X?". She answers as instructed, and mathematician A sheepishly pays off the bet and admits that B was right. As the waitress walks away, she is heard to mutter "pair of idiots. It's one-half X squared, plus a constant".
[I'm not sure how much of the joke is a dig at mathematicians who forget some of the basics (the constant), or a dig that mathematicians can only find jobs working as a waitress in a bar.]
But, back to the issue at hand - differentiation will take any constant term and turn it into zero. But to take the flux data and turn in back into a change in storage you have to integrate. And when you integrate, you are in deep, deep trouble if you forget the constant, which is what Humlum et al appear to have done. If you can't figure out what the constant is, then you can't figure out the numerical value of the integration.
Details. Details.
Bob Loblaw - very apposite, unlike my favourite maths joke:
Q. Why did the mathematician call his dog Cauchy?
A. Because he left a residue at every pole!
"Humlum had just disproved the conservation of mass" Who says scientists don't have a sense of humor. Priceless.
Real Climate - On Humlum et al.
Humlum find a connection between ENSO and CO2 But don't understand his findings. C. D. Keeling and R. Revelle find and understand this connection at 1985.
El Nino’s effect on CO2 causes confusion about CO2′s role for climate change
Rasmus E. Benestad - Real Climate 11 September 2012
Anyway the same level of logic can find that temp don't connect to CO2 since every year from October to January the CO2 is rising while temp is falling. Just ignore the 1st & 2nd order of CO2 and temp rising.
This paper from Humlum and similarly nonsensical stuff from the likes of Salby reminds me of the Simpsons episode where Bart is the "I didn't do it" boy. A juvenile display of not being capable of taking any responsibility for own actions. What is next from Humlum and his Norwegian cohorts ? A new paper claiming that humans don't actually emit CO2 at all?
Using the equatorial SST data for latitudes -6±15 degrees, we can take the Mauna Loa CO2 data and compensate for seasonal outgassing. This has a Henry's Law gain factor of 3 PPM/deg C after applying a lag of 1 month. This simple transformation completely removes the seasonal oscillations, leaving only low-level noise and perhaps a few glitches related to El Nino events (see 1998-1999).
The above figure is the compensated Mauna Loa CO2 data after removing the seasonal IPWP ocean outgassing of CO2. I also placed a polynomial fit as a guid to the eye.
The above figure shows the Indo-Pacific Warm Pool (IPWP) lies within the +9N to -21S SST average. This is the hottest part of the Pacific and should have the strongest activation for CO2 outgassing.
The SST data was taken from a NOMADS server (NOAA Operational Model Archive and Distribution System)
http://nomad3.ncep.noaa.gov/cgi-bin/pdisp_sst.sh?ctlfile=monoiv2.ctl&varlist=on&psfile=on&new_window=on&ptype=ts&dir=
The CO2 data was taken from the Mauna Loa records, going back to 1981 to match the archival extent of the SST records
http://www.woodfortrees.org/data/esrl-co2/from:1981
I have to say that the available oceanographic and atmospheric data is an amazing resource for debunking claims made by people like Humlum (and don't forget Murry Salby).
Aren't you applying algebra to a calculus problem?
Suppose atmospheric CO2 labelled “C” progresses according to the differential equation
dC/dt= -a*C + N + A
where ‘A’ is an inverse time constant. The first term is the action of “natural” sinks, which respond to the total level of C in the atmosphere. The second term is natural forcing. The third term is anthropogenic forcing.
The rate of change of C is less than A. Thus,
-a*C+ N .LT. zero
The ridiculous pseudo-mass balance argument then says, voila! Nature is a net sink.
But, the solution of the above equation is the convolution integral of N + A with the exponential term exp(-a*t). InLaplaceoperator form
C(s) = (1/(s+a)) * (N(s) + A(s))
The left side of the above inequality then becomes
-a*C+ N = (s*N(s) – a*A(s)) / (s + a)
Thus,
[dN/dt - a*A] .LT. zero
@civil engineer Calling arguments that have appeared in journal papers written by top carbon cycle experts, as well as the IPCC report "ridiculous" suggests hubris, which is not a good thing in science.
The mass balance argument, at least stated in its usual form, is not a calculus problem, as the quantites involved represent the actual amounts of carbon that have been moved between reservoirs within a particular timeframe - a year is a common choice. No calculus is involved.
Answer me this:
If during a particular year, net natural emissions are say 2 units and anthropogenic emissions are 2 units and the rise in atmospheric carbon is only 1 unit, where did the missing three units of carbon go?
Edit: By the way, your initial error is to double count natural fluxes,
dC/dt= -a*C + N + A
The net natural response of the carbon cycle is (to a first approximation) proportional to atmospheric CO2 levels, so the natural response is being represented by both -a*C and by N. If you want differential equation based models, you can find the in my journal paper, and give a reasonable reproduction of a variety of known observations, for instance a constant airborne fraction, and they do they also show that the natural environment is a net carbon sink.
(-snip-) Dikran Marsupial,
I'm curious to know your thoughts on Dr Salby's recent persentation.
http://www.youtube.com/watch?v=2ROw_cDKwc0&feature=player_embedded
[DB] It is considered poor form to attempt to call people operating under a pseudonym by what you think that their real name is. Future iterations of this behavior will be moderated out.
Unless you wish to go by yours...?
civil engineer, just to clarify, my name is Gavin Cawley (I post pseudonymously, but not anonymously), Prof. Essenhigh wrote the original paper on which mine was a comment. Mea culpa, the link in the earlier post was to Prof. Essenhigh's original paper, rather than my comment paper, which you can find here.
Sadly Prof. Salby's argument is also incorrect (I would be genuinely pleased if it were correct) and I and others have written blog posts on his presentations (my article is the first of those listed, and would be a good place to discuss this further):
Murry Salby's Correlation Conundrum
Murry Salby finds CO2 rise is natural
Murry Salby - Confused About The Carbon Cycle
Salby's ratio
Humlum et al. make basically the same mistake and another SkS author has published a peer-reviewed comment paper on that one as well, see:
New study by Skeptical Science author finds 100% of atmospheric CO2 rise is man-made
Roy Spencer also made a similar error (happily only on his blog and didn't actually publish it), which I discuss here:
Roys' Risky Regression
Scientists make mistakes frequently, you are not at the cutting edge of your field if all of your ideas are right, and some errors happen more than once. Sadly climatology gets a fair amount of media interest, so instead of these errors being quietly forgotten, they end up being discussed in public view.
Prof. Salby's new talk seems to have some additional material on ice core CO2 proxy data, but the central argument is still that addressed in my earlier SkS post.
DM,
I don't find the sks links that convincing and they "suggest hubris". You appeal to authority with your first reply, "top carbon cycle experts, as well as the IPCC report".
I find that Dr Salby has over 75 publications with nearly 3200 citations. I understand he now has 3 upcomming papers Re Carbon cycle so perhaps you can comment on those as well.
[DB] Any participants wishing to engage civil egineer on Salby should proceed to do so on one of the threads indicated by Dikran.
This applies to you as well, civil egineer.
civil engineer, I did not say that Salby's error was "ridiculous", so it is a fairly poor riposte to the observation of your hubris. If I am appealing to authority in citing the IPCC report and top carbon cycle experts, then you are undoubtedly doing the same by citing Salby's publications list (how many of his existing papers are on the carbon cycle?). If Prof. Salby does publish this research, then it is likely that I will, rather reluctantly write a comment paper.
The fact that you have responded with rhetoric, but no attempt whatsoever to refute the argument presented in my blog article is a good indication that you are not interested in rational scientific debate and are just trolling, so I shall not bother responding to you further. I suggest others do likewise and DNFTT.
The fact that the rise in atmospheric CO2 is anthropogenic is known beyond reasonable doubt, and as Fred Singer says, clinging to such obviously incorrect arguments gives skeptics a bad name - but it is your choice.
I have responded here.