


 Arguments
Software
Resources
Comments
The Consensus Project
Translations
About
Support
Arguments
Software
Resources
Comments
The Consensus Project
Translations
About
Support
![]()
![]()
![]()
![]()
![]()
![]()
![]()
![]()
![]()
![]()


![]()


Latest Posts
- Skeptical Science New Research for Week #18 2024
- At a glance - Clearing up misconceptions regarding 'hide the decline'
- Pinning down climate change's role in extreme weather
- 2024 SkS Weekly Climate Change & Global Warming News Roundup #17
- Fact Brief - Is Antarctica gaining land ice?
- Simon Clark: The climate lies you'll hear this year
- Skeptical Science New Research for Week #17 2024
- Water is at the heart of farmers’ struggle to survive in Benin
- At a glance - The difference between weather and climate
- India makes a big bet on electric buses
- 2024 SkS Weekly Climate Change & Global Warming News Roundup #16
- EGU2024 - An intense week of joining sessions virtually
- Skeptical Science New Research for Week #16 2024
- How extreme was the Earth's temperature in 2023
- At a glance - Is the science settled?
- What is Mexico doing about climate change?
- 2024 SkS Weekly Climate Change & Global Warming News Roundup #15
- Fact Brief - Did global warming stop in 1998?
- Skeptical Science New Research for Week #15 2024
- EGU2024 - Picking and chosing sessions to attend virtually
- At a glance - The Pacific Decadal Oscillation (PDO) is not causing global warming
- Climate Adam: Is Global Warming Speeding Up?
- 2024 SkS Weekly Climate Change & Global Warming News Roundup #14
- Gigafact and Skeptical Science collaborate to create fact briefs
- Skeptical Science New Research for Week #14 2024
- How can I make my retirement plan climate-friendly?
- At a glance - Global warming and the El Niño Southern Oscillation
- A data scientist’s case for ‘cautious optimism’ about climate change
- 2024 SkS Weekly Climate Change & Global Warming News Roundup #13
- Skeptical Science New Research for Week #13 2024
Comment Search Results
Search for Little Ice Age
Comments matching the search Little Ice Age:
- Climate's changed before
Eclectic at 11:22 AM on 21 April, 2024Spooky @899 , you should not really be surprised ~ since the OP article is referring to Global temperature changes.
Not to the local rapid changes in the boreal icesheet region (e.g. Denmark, Greenland, Alaska : during the last glacial age) as shown in the Bolling-Allerod warming and in the briefer Dansgaard-Oeschger events. Those local northern regions are affected by "sudden" changes in local oceanic currents ~ both smaller & larger (e.g. the AMOC). But that has little effect on the global scale, except when it involves a massive event like the melting of the Laurentide Ice Sheet (i.e. the Younger Dryas).
In India, the Indian Monsoons (to which you allude) show much fluctuation resulting from very small alterations in local temperatures & winds (winds which may bring more oxygen18-rich water) . . . even in the absence of a 30-year climate change.
For global temperature changes, there need to be global-scale changes in albedo / insolation / particulates / or greenhouse gasses.
- How extreme was the Earth's temperature in 2023
Jan at 17:45 PM on 19 April, 2024Made it a little bit nicer, as it is important:
On the causes of the exceptional temperature jump in 2023
First things first:
What was special about the warming in 2023 was, that it happened all in the last 6 months, so it was a much larger jump over these months than the mean values of 2023.
Further, only a moderate El Nino existed, so not too much warming came from here.
Reasons where:
SOx reductions over the shipping routes amplified the marine heatwave signal across the mid-latitudes.
The El Nino in combination with a positive Indian Dipole - both lead to a larger heat release of the tropical oceans as a clear and strong circulation cell is supported over the tropical oceans due to the zonal SSTs gradient.
Sea ice reductions around the Antarctic caused circulation changes that led to moist and warm air advection over Antarctica (strong effect on the warming as exceptional heat waves rocked Antarctica), as well as radiative effects of the sea ice reductions and heat release over sea ice-free areas.
Then that climate warming warms the oceans now more than natural variability is often able to produce colder than normal SSTs - at one time only some ocean regions existed with colder than normal temperatures.
Then we had the vast expansion of marine heatwaves across the global oceans, especially across the mid-latitudes reaching a coverage of more than 40% in July.
The warmer-than-normal Oceans created a cloud feedback thereby increasing shortwave absorption (reinforces marine heatwaves).
From 2012 to 2016 we had a non-linear increase of moisture in the marine boundary layer caused by exceptional SSTs. The next jump will have happened in 2023 causing a water vapor feedback over large parts of the oceans to increase. And tropical moist air advection is causing marine heatwaves in the subtropics to mid-latitudes. So also here is another feedback as more water vapor radiates longwave radiation back to the surface.
Further, we had during summer to autumn large areas where the soil-moisture-temperature cascade came into play producing these exceptional continental heat waves. It comes along with a cloud feedback and supports stalled/fixed high-pressure systems as these heat domes redirect the jet around them (higher troposphere).
Then we had the pattern effect of increasing zonal (east/west direction) temperature gradients at the ocean surface and continents which disturb the overlying circulation, often causing blocking patterns (also a reason for the marine heatwaves to build up)
Then we had towards autumn a heat release of the marine heatwaves across the mid-latitudes, as the atmosphere gets colder. Also, cold core and warm cors eddies cause extreme temperature gradients in the western boundary extension regions leading to a larger latent heat releases over these ocean regions (small-scale pattern effect of SSTs increases wind speeds).
Last it has been possible that the oceans released heat from the subsurface that had built up. Across the mid-latitudes warm freshening water masses are accumulating under the surface as shallow as 150m depth. And these heat depots could have been tapped, as the jets speed up during winter, as the density gradient between the tropics and poles increases in the upper atmosphere while it decreases near the surface, especially during winter. More and stronger low-pressure systems due to increased shear are the outcome. And all these extreme low-pressure systems in autumn and winter across the mid-latitudes in 2023/24 could have tapped these subsurface heat depots. But no study here as this is a new development seen in the intensity of the low-pressure systems the last years (e.g. number of atmospheric rivers hitting the US west coast)
Main problem thou is the expansion of marine heatwaves, as they are feedback driven by global warming heating the oceans from the surface too fast (thermal stratification increases non-linear in the upper 300m of the oceans in various regions), in combination with the pattern effect which disturbs global zonal circulation with the result of more stalled high-pressure systems (low wind speeds are in most instances the main precondition for marine heatwaves to form besides thermal stratification and shallow upper mixed layer depth).
Last the warming of the northern latitudes can also be included in the factors driving global warming in 2023.
In short, the warming of 2023 was feedback-driven by various systems forcing each other into a heating mode with the systems of the oceans, atmosphere, and landmasses acting in unison!
The exact series of which contributed to what extent to the heating science has to find out. But it would have to be done on a monthly basis!
The next jump will have devastating consequences as they become larger...
In my opinion, the model spread is now a joke as it is way too large proving the uselessness of models as they will increasingly become unable to predict what is coming as too many parametrizations prevent them from simulating the non-linear character of the mutually reinforcing systems with many processes operating on small scales...
p.s. we warm the oceans too fast from the surface that is our main problem!
- Welcome to Skeptical Science
Bob Loblaw at 01:07 AM on 5 April, 2024cookclimate @ 118:
I have looked at the paper in the volume I linked to in comment 121. There are definite changes compared to an earlier version I found that said "submitted to Earth and Space Science", so I presume that you've had some sort of review and modified the paper since the earlier drafts.
It looks like you have identified the 1470-year cycle using your eyecrometer. I see nothing in the paper that actually does any sort of signal processing to identify cycles using any objective statistical technique. You are seeing a cycle because you want to see a cycle.
Your speculation includes arguments that include all sorts of stuff that has been debunked many times before. Pages are available on Skeptical Science that cover thee topics:
- Geothermal heat flux is included in this post.
- The "CO2 lags temperature" argument is discussed here.
- Most of your examples use regional, not global, temperature proxies. Regional temperatures are far more variable than global ones, and it is invalid to compare the two directly. This is discussed in this SkS post.
- You're convinced that an increase in volcanoes are adding to warming. That is the opposite of the argument commonly made by "skeptics" that increasing volcanic activity caused the Little Ice Age, so a subsequent decrease is causing warming (discussed here). In any event, just counting the number of volcanoes (your figure 3) is extremely simplistic. Arguing that more volcanoes implies more geothermal heat is a non-starter, as discussed in the post linked above.
- Your "computer models are unreliable" is an old, tired argument, scoring position 6 on the SkS Most Used Climate Myths. The rebuttal is here.
So, your paper is really nothing more than an "I see it" 1470-year cycle mixed with a rehash and Gish Gallop through a variety of common "skeptic" myths. I could probably find more, but it isn't worth the time.
I hope you didn't pay too much money to get it published.
- Climate - the Movie: a hot mess of (c)old myths!
Two Dog at 22:33 PM on 2 April, 2024Scadd - #64
Thanks for the explanation and appreciate the civility, I don't consider it a dog-pile(on?) to reply - and its nice not to be accused of "abysmal ignorance" and told to "put up or shut up".
I get the fact the planet is warming and your sea temperature chart is more compelling for the reasons you cite, although I would like to understand where this temperature is measured and the average obtained - but I do not doubt the trend. I also agree the heat has to come from somewhere and, to be clear, I have no preference for theories of man-made sources or natural sources. My point remains that we are not dealing with a world in perfect temeprature equilibrium, so I feel uneasy discounting natural sources as significant when their impact is all too obvious when looking at the historical temperature record. I have no idea "which natural sources" I am referring to but I am fairly confident we are unable to accurately measure and predict them. However, so long as the temperature continues to rise in line with C02 emmissions I think the man-made argument becomes more and more compelling but a few years blip and, for me, it becomes open to considerable doubt. That is why the 30 year period of little warming looks suspicious to me (and I now know the explanation some have for this)
I did also read that the warming effect of CO2 decreases as its concentration increases so the warming is expected to reduce over time. Is there any truth in that?
- At a glance - Was Greenland really green in the past?
nigelj at 05:27 AM on 21 February, 2024This recent book is relevant to the MWP: "The Earth Transformed, by Peter Frankopan, first published 2023". The book is a complete 700 page environmental history of earth from its formation to this decade. It covers both natural environmental changes and human caused environmental changes.
The book has chapters on the MWP, Little Ice Age and modern anthropogenic warming period. And chapters on the impacts on the environment of indigenous culture, farming, early civilisations, the industrial revolution, and the colonial period, communist societies, capitalist countries and modern period and many other periods and issues.
Haven't had time to read the whole thing, but what I've read is fascinating, a real eye opener, even if you think you know much of the material already, and it flows nicely so is easy to read. You can also pick and choose chapters at random and still make sense of them. It comes across as facts based, well researched, and objective and unbiased.
Extensive bibliography running to 300 pages, not included in the book because its so long, but available online.
- Climate Adam: The tough reality of Carbon Capture & Storage
One Planet Only Forever at 05:00 AM on 29 December, 2023michael sweet @17,
Agreed that the use of CO2 to scrub oil off of rock formations, a possible benefit of CO2 injection to increase the production of oil as presented in the article, would almost certainly mean that CO2 comes out with the oil. But, to be fair, CO2 injection can potentially lock-away CO2 while producing more oil from an oil deposit.
Here are potential stages of oil production:
- Natural pressure of the trapped oil deposit forces oil to the surface when it is drilled into – the ‘gusher’.
- Pressure drops as the oil flows out.
- A pump-jack increases the rate of extraction by ‘lifting’ oil out of the well – like a water well pump.
- As more oil is removed the rate of flow to a well point pump-jack declines.
- Injecting gasses like captured CO2 can increase the pressure in the oil deposit and force more oil out of the well locations. Current operations inject CO2 captured from the exhaust of burned fossil fuels. This process potentially traps the injected CO2 in the rock formation that the oil was trapped in.
So oil can be produced by injecting and trapping CO2. But scrubbing oil off of the formation that the oil is in would mean CO2 comes out with the oil.
However, CO2 thought to be trapped in an oil deposit may not be truly trapped. Accurate pressure monitoring over a long time frame would be required to prove that the CO2 is staying where it was put. And until the completion of that pressure testing it is uncertain that the ‘claimed to be trapped’ CO2 is properly trapped. If a pressure test fails, the pressure drops, then the ‘carbon removal’ action plan is failing. And there would be little that could be done to keep the rest of the ‘believed to have been locked away’ CO2 from leaking out.
Who will pay for removing it and locking it away? Everybody essentially pays for the profit obtained, or pays for the government subsidy (worse when the government subsidizes the obtaining of profit - nobody should profit from publicly funded harm reduction like CO2 removal).
It would be nice if the ones who benefited most from the developed total current problem paid the most to limit the harm done ... but the current systems have a histry of making the least fortunate, who do not deserve to be penalized, suffer the most harm. Refer to the lead article in the Skeptical Science New Research for Week #50 2023 for a detailed presentation of concerns regarding free-market development of Carbon Capture.
- At a glance - Climate scientists would make more money in other careers
Philippe Chantreau at 10:07 AM on 31 October, 2023More questions:
What sources report a gross over-supply of engineers and scientists, a term used twice in post #2 above?
I have a little familiarity with the aerospace industry, where many scientists with physics and applied mathematics backgrounds can use their competence, even if they are not specifically trained as aerospace engineers. There is a serious shortage of talent in that field.
I am also familiar with medicine and biomedical applications, where shortage of scientists and engineers are also a problem, easily confirmed by any basic search.
Other sources report a serious shortage of hydrologists, a profession of very high interest for the future.
I'll add this article from the Bureau of labor Statistics. Of special interest is this quote: "A comprehensive literature review, in conjunction with employment statistics, newspaper articles, and our own interviews with company recruiters, reveals a significant heterogeneity in the STEM labor market: the academic sector is generally oversupplied, while the government sector and private industry have shortages in specific areas."
So, once again, how does this constitute a "gross over-supply"?
If anything, with the supply and demand law being what it is and the immense financial means available to private industries, it seems that this imbalance abundantly confirms that there is more money to be made for science majors in the private sector than in research, does it not?
- From the eMail Bag: Carbon Isotopes, Part 2: The Delta Notation
Bob Loblaw at 07:40 AM on 17 October, 2023Rabelt @ 9, 11, 13, and 14:
You are really missing the big picture on carbon isotope ratios. The C13 levels alone are not "proof" that the fossil fuels are causing the atmospheric rise in CO2 - they are one line of evidence that rules out other sources. You are over-interpreting what you are reading here (or elsewhere).
This post is titled "Part 2". I suggest that you also read Part 1. It gives essential background about how isotope ratios differ across C12, C13, and C14, depending on the source.
You should also read Climate Change Cluedo. Steps 4 and 5 note the significance of changing C14 and C13 levels. To quote,
- Declining C14 ratio indicates the source is very old, hence fossil fuel or volcanic (ie, not oceanic outgassing or a recent biological source);
- Declining C13 ratio indicates a biological source, hence not volcanic;
Isotope ratios are also discussed on How we know human CO2 emissions have disrupted the carbon cycle, and on What is causing the increase in atmospheric CO2.
The caption on figure 3, which states that declining C13 ratios tell us it is fossil fuel combustion should really be interpreted as "the declining C13 ratio tells us that it is not volcanic. Since volcanoes are the only other possible source of C14-depleted carbon, the only remaining explanation is fossil fuels".
And none of those explanations require that C13 ratios be solely dependent on fossil fuel combustion. Figure 3 shows that for 800 years, C13 ratios were only slightly variable, and have now changed significantly once fossil fuel combustion began.
Your argument that "it changed before, so it can't be fossil fuels now" is just a peculiar flavour of the general "climate's changed before" myth that is number one on the hit parade listed on the upper left of every SkS page.
Just because you don't know of or understand an explanation does not mean that there isn't one.
- We're coming out of the Little Ice Age
John Hartz at 05:01 AM on 17 September, 2023Recommended supplemental article:
What climate change deniers get totally wrong about the Little Ice Age
What does a regional period of mid-millennial cooling have to do with today's climate disasters? Absolutely nothing
by Matthew Rozsa, Science & Health, Salon, Aug 7, 2023
- Akasofu Proved Global Warming is Just a Recovery from the Little Ice Age
John Hartz at 03:44 AM on 17 September, 2023Recommended supplemental article:
What climate change deniers get totally wrong about the Little Ice Age
What does a regional period of mid-millennial cooling have to do with today's climate disasters? Absolutely nothing
by Matthew Rozsa, Science & Health, Salon, Aug 7, 2023
- There is no consensus
RicardoB at 23:13 PM on 10 September, 2023Eclectic @951:
Thank you for you comments.
You stated: "Dr Jordan Peterson shows how little he knows about climate matters ~ fair enough ~ but why is he choosing to boost Dr Curry?"
He chooses to boost Curry as he chooses to boost many other prominent "climate narrative contrarians" that he "interviews" in that same channel, like Robert Bryce, Steven Koonin, Richard Lindzen and Alex Epstein.
Dr. Peterson main point of view on the "climate debate" seems to come from his strong belief (?!) that the political measures that are being enforced by governments (to tackle global warming) will lead to mass impoverishment and starvation via the rise of the energy bill. In his words: "People can't care about environmental concerns when they are so desperate they are worried about tonight's shelter and the next meal." He frequently rages about "the consensus" and the "hysteria" that are leading to these political choices.
Hence, he deliberately chooses to debate the topic only with "specialists" from the "contrarian side" - champions for the carbon industry agenda. It suffices to say that these interviews function not as debates or means to get to the truth (by now, Dr. Peterson seems mostly uninterested in the cientific truth), but as opportunities both to let these "specialists" voice their cherry-picked concerns and attack established comprehensive scientific bases, and to not get himself confronted/debunked on his opinions. There's no debating; there's only agreeing.
- It's cooling
Bob Loblaw at 22:39 PM on 6 September, 2023CORK @ 330:
I see. You're in the group of people that say "how could we possibly know what happened in the distant past?
The simple answer to why the current warming is due to human emissions of CO2 is "physics". We do have information on past climates through geology - combined with understanding the physics involved. We know what physics can and has affected climate in the past, and we know that those processes do not explain the current warming - unless you also include the effect of CO2.
But as the moderator told you in comment 327 - this is getting off topic for this discussion. The moderator pointed you to the thread on past climates. Another post you may benefit from reading is the one on the Empirical evidence that humans are causing global warming.
- It's cooling
CORK at 04:27 AM on 5 September, 2023Climate's changed beforeWhat bothers me in the "Escalator" is the time scale. From 1970 to 2022 the temperatures rise, yes.
But this is not incompatible with a cooling at geological time scales. We may be in a rising part of the curve which will go down and over several 1000s of years the average will show a cooling trend.
The scale of time can be used and the curves can defend both arguments. Therefore the "escalator" is of no use.
The only pure fact in all the climate change saga is that humans are producing greenhouse gasses.
From that fact a whole theory of climate has been built. It is very difficult to say things like that without being insulted today.
- Climate Confusion
Markp at 22:43 PM on 3 September, 2023For Rob: I know I have not provided much data to back what I've been saying, but that's mainly because I was going on the assumption that you may already be aware of the data that could support me. In other words, I don't think what I've said is uncontroversial from a data point of view, but I do accept that it might be controversial from the point of view of making those holding a mainstream view (and I know that's vague) uncomfortable.
I disagree with little of what you say about climate in this last post. From your list of 8 items, only 1,4 and 5 are problematic in my view. Unfortunately, those few items are weighty:
"A lot is happening towards decarbonization" is vague enough to require examples to qualify the statement. There has definitely been a lot of talk about decarbonization, but as 2022 saw global emissions hit a new high of 36.8 Gt, according to the IEA's report "CO2 Emissions in 2022" one has to ask what decarbonization achievements, what action, in place of mere talk, can we point to. Renewable energy production plus use of EVs, heat pumps and who knows what else saved about 550 Mt. Fine. But this growth rate (growth of renewable contribution) won't hold up. So when you say "a lot" is happening, what's that really mean? And could you give just a few bullets on how you think we'll achieve net zero by 2050?
I'm also curious to know how much your vision of "net" zero relies on offsetting schemes, because I don't trust them and fear that they are being relied on too much for comfort.
As for what happens to the rising temperatures in a net zero 2050, we'll have to wait and see.
I'm certainly with you on breaching 2C by 2050, but since I've got little hope we'll be anything close to net zero by then (for whatever net zero is actually worth as long as we've got all the offestting nonsense thrown in there) it looks worse to me than to you.
Finally, and to change the subject a bit, I think the talk about models went too far. I'm not saying models are bad, just that they're being relied on too heavily in certain important cases. And as my primary experience (nearly 30 years now) has been in the financial arena for many "quant" strategies where, in that industry it is painfully common to see wonderful quant investment funds with great backtested results finally have some real money thrown at them and start a live track record, only to see the live returns look nothing like the lovely return characteristics of those backtests, I confess a lot of my skepticism comes from just that type of environment. Still, when we continually see news reports with headlines running "Researchers present shocking new data that climate change is happening much faster than expected" and the previous expectation was based on models, I don't feel at all surprised. I've just had a look at the "myths" section of Skeptical Science specifically at the models myth and I also see there that most of the argument seems to be toward trying to convince climate deniers who say models are all wrong that GW is real. That's clearly not me.
For Eclectic: I don't think I've written too much, do you? I know people these days don't like to read anything longer than a twitter post, but I don't think your assessment here is fair. I've tried to keep it short, in fact. Like I said, I assumed, and maybe wrongly(?), that you folks had a decent understanding of the data already, and could follow commentary like mine that took a broader look at things rather than fussing over citations and decimal points because I'm not claiming anything that boils down to a disagreement over small measurements but has been more about one's basic orientation: some of you seem to be wearing rose-colored glasses in my view, like too many people are.
As for the mirror concept, if the goal were to limit global temperature rise to 2C by 2100 we would need about twice the surface area of the contiguous USA. Although these reflectors would be useful in many instances, like on rooftops, parks, outdoor markets, reservoirs, etc., the main idea is for them to be used in agricultural settings because there's a lot of agricultural land, and because the reflectors would bring both local benefits to the crops by cooling, saving water and increasing yield, and contribute to global cooling. How to do that on a large scale is a problem that needs to be worked out. Any cropland managed by tractors and other large machines would either need to involve reflectors that would be removed from time to time for those machines to do their work, which wouldn't be easy, or they'd need to be placed so as not to interfere with those machines, perhaps by having them suspended vertically alongside crops rather than horizontally over them. And of cource, horizontal coverage would not involve blocking all available sunlight as to choke off photosynthesis, but as most crops can thrive with up to 30% shading, it would be placed intermittently. Anyway, this is the rough idea. Reflectors made from PET and aluminum cans from landfill provide more than enough for this level of scale, but other reflector constructions/materials could pop up as well. If you feel this isn't the type of detail you'd like to see, I'm not allowed to offer more. Not to protect technology or profits, because this comes from a nonprofit, but simply because I'm not authorized. As some of you know, the science takes time. We're working on it.
If that surface area seems "too big" as in "nobody will go for that" I can certainly feel that, but what choice have we got? The Earth is big. We can do it. We've got 4 million miles of roads in the USA. When cars first got started, nobody would have thought that possible. All of our climate "solutions" are by nature on a grand scale. Nothing to do about that as far as I know. And why people might balk at lots of mirrors/reflectors when they seem to think DAC (or your solution of choice) can clean (enough of) the entire atmosphere, I'm stumped.
- Eastern Canada wildfires: Climate change doubled likelihood of ‘extreme fire weather’
Eclectic at 22:49 PM on 29 August, 2023Davz @4 : you are wrong. That paper does not support your claim of showing "far fewer not more fires over a long period of time". Please read through the paper, and with particular attention to the last paragraph.
The paper is from 2016 and includes mention of "recent" study decades of up to 2012 and up to 2015 ( eight years ago ). The paper was very vague about "areas burned versus fire intensity" [unquote].
The authors also said: "We do not question that the fire season length and area burned has increased in some regions over past decades" [unquote]. Again, no quantification. And you, Davz, have the advantage of knowing something of the past eight years of global fire activity ~ unlike the authors.
They also mentioned (in an unquantified manner) the other factors of "increased fire prevention, detection and fire-fighting efficiency, abandonment of slash-and-burn cultivation in some areas and permanent agricultural practice in others" .
And the authors commenced with: "Charcoal records in sediments and isotope-ratio in ice cores suggest that global biomass burning during the past century has been lower than at any time in the past 2000 years." Davz , this is very vague unquantified stuff ~ indeed, the paper is little more than a discussion essay.
The title is grand, though. "Global trends in wildfire and its impacts: perceptions versus realities in a changing world". But the paper itself is so vague as to be almost useless.
It is certainly not qualifying as "Counter-Propaganda" ~ if that was what you were intending?
- ClimateAdam: The Vlog Brothers on geoengineering
Markp at 22:49 PM on 24 August, 2023This is a reasonably well-done video by Adam, but there are some points that need to be made.
As many people have learned, the IPCC has done a pretty lousy job of informing the public, and the scientific views it presents have been warped both by the scientists themselves (the dreaded "scientific reticence" effect) as well as the politicians from 195 member countries that have veto power on much of the content released to the public which can be generally characterized as very, very conservative. In other words, it's way worse than they tell us, and their "solutions" not nearly as effective as they tell us. Adam and his friend Miriam are both, from what I can tell, very much cheerleaders for the IPCC. Not surprising: they are fresh out of university and so in that sense have not spent much (any?) time in the real world of working scientists, so their current YouTube careers aside, they may not want to annoy the IPCC-dominated narrative on all things climate.
Two big issues: 1) we need geoengineering more than they tell us, and 2) there is more to geoengineering than SAI.
1) Like so many climate scientists under the spell of the IPCC, (for many reasons which take too long to unpack here) Adam and Miriam accept the logic that the only necessary thing to do in order to reverse GW is to reverse GHGs, in other words, get rid of them. That's a little bit like having your doctor tell you that in order to cure your tobacco-caused cancer, you just need to stop smoking. Fighting the cause isn't always guaranteed to bring about a result in a timely manner. Reducing GHGs, yes, but who is doing that? Miriam said something like international agreements like Paris have "already reduced warming by 1C" and I say huh? All the talk of international agreements sounds good but isn't our reality, as anyone looking at our world's biggest problems today knows in an instant. Our "efforts" to reduce emissions are nowhere. It's not happening. Targets and discussions aren't enough. The point that people behind geoengineering make is: emissions reduction is not and WILL NOT happen fast enough to stop our ecosystem from collapsing. Additionally, carbon removal methods, whether nature-based or mechanical, have huge scaling problems. Yes, nature has dealt with CO2 in the past, but not like what we have now. They are very slow, are not always even feasible (tree-planting a perfect example, look at the studies) and have other issues such as water constraints making them impossible at scale. And mechanical CO2 removal is even worse. When it works, it's fast, but unscalable, with DAC being the most obvious case. So after the IPCC cheerleading stops, we have to face the music. We don't have time to rely only on the method of "turn off the tap and clean up the mess."
2) Geoengineering (you heard Adam slip in "SRM" as well, Solar Radiation Management, a type of geoengineering) is almost always equated with just ONE currently discussed method, which is Stratospheric Aerosol Injection, or SAI. That's because it's got a lot of billionaire-potential!
SAI is NOT more than a theory at this point, however. But you won't find that mentioned by many of its proponents. It is not the only way to go, is not loved by many (unbiased) climate scientists, has oodles of scientific problems to overcome if it would even work, and so is NOT the end of the geoengineering or SRM story. So Nigelj's characterization above, which makes it seem that SAI is ready-for-take-off, is wrong.
I will admit that, like the VAST majority of actual movement on climate we have seen, geoengineering efforts have a lot in common with disaster capitalism, and so should be checked out very thoroughly. Making money off of GW is the most effective thing we humans have done to date, which is a crime against humanity. Period. Governments now throwing large sums of money out for grants only on very narrowly-defined work chokes real progress. What we forget is that scientists have to get paid. Who pays them? Why? Most scientific research is arguably being funded by those who are expecting a product to patent and sell if things go well. Scientists are NOT always out there trying to find the fastest most practical fix here. The more tech that goes into it, the better. The more career-building we can get out of it, the better. That's why we see people talking about, of all things, space mirrors, as if simply putting them on the ground here to do what clouds and snow do is out of the question. There are people promoting that very idea and it has vastly more promise than any other geoengineering solution but is largely ignored (but that's changing) because it doesn't create billionaires and cannot be weaponized.
Like many things, this discussion has so much more to it than meets the eye. We need to think, REALLY think, and be realistic, and stop listening so much to government institutions (or their cheerleaders) that have almost never served anyone other than the powerful very well.
- A Frank Discussion About the Propagation of Measurement Uncertainty
MA Rodger at 18:52 PM on 11 August, 2023Nigelj @13,
The paper Frank (2019) did take six months from submission to gain acceptance and Frontiers does say "Frontiers only applies the most rigorous and unbiased reviews, established in the high standards of the Frontiers Review System."
Yet the total nonsense of Frank (2019) is still published, not just a crazy approach but quite simple mathematical error as well.
But do note that a peer-reviewed publication does not have to be correct. A novel approach to a subject can be accepted even when that approach is easily show to be wrong and even when the implications of the conclusions (which are wrong) are set out as being real.
I suppose it is worth making plain that peer-review can allow certain 'wrong' research to be published as this will prevent later researchers making the same mistakes. Yet what is so often lost today is the idea that any researcher wanting publishing must be familiar with the entirety of the literature and takes account of it within their work.
And for a denialist, any publication means it is entirely true, if they want it to be.
In regard to the crazy Frank (2019), it is quite simple to expose the nonsense.
This wondrous theory (first appearing in 2016) suggests that, at a 1sd limit, a year's global average SAT could be anything between +0.35ºC to -0.30ºC the previous year's temperature, this variation due alone to the additional AGW forcing enacted since that previous year. The actual SAT records do show an inter-year variation but something a little smaller (+/-0.12ºC at 1sd in the recent BEST SAT record) but this is from all causes not just from a single cause that is ever accumulating. And these 'all causes' of the +/-0.12ºC are not cumulative through the years but just wobbly noise. Thus the variation seen do not increase with variation measured over a longer period. After 8 years in the BEST SAT record is pretty-much the same as the 1-year variation and not much greater at 60 years (+/-0.22ºC). But in the crazy wonderland of Pat Frank, these variations are apparently potentially cumulative (that would be the logic) so Frank's 8-year variation is twice the 1-year variation. And after 60 years of these AGW forcings (which is the present period with roughly constant AGW forcing) according to Frank we should be seeing SAT changes anything from +17.0ºC to -12.0ºC solely due to AGW forcing. And because Frank's normal distributions provides the probability of these variations, we can say there was an 80% chance of us seeing global SAT increases accumulating over that 60 years in excess of +4.25ºC and/or decreases acumulating in excess of -3.0ºC. According to Frank's madness, we should have been seeing such 60-year variation. But we haven't. So as a predictive analysis, the nonsense of Frank doesn't begin to pass muster.
And another test for garbage is the level of interest shown by the rest of science. In the case of Frank (2019), that interest amounts to 19 citations according to Google Scholar, these comprising 6 citations by Frank himself, 2 mistaken citation (only one by a climatological paper which examines marine heat extremes and uses the Frank paper to support the contention "Substantial uncertainties and biases can arise due to the stochastic nature of global climate systems." which Frank 2019 only says are absent), a climatology working-paper that lists Frank with a whole bunch of denialists, three citations by one Norbert Schwarzer who appears more philosopher than scientist, and six by a fairly standard AGW denier called Pascal Richet. That leaves a PhD thesis citing Frank (2019)'s to say "... general circulation models generally do not have an error associated with predictions"
So science really has no interest in Frank's nonsense (other than demonstrating that it is nonsense). - Just how fast will clean energy grow in the U.S.?
Eclectic at 04:43 AM on 11 August, 2023Davz @3 , you are quite right that it is only the actual production of electricity that should be stated. Like you, I am irritated by public announcements of XYZ generation capacity newly installed . . . when it would be more honest to quote the actual effective generation (which is in the 15-30% range, for various wind & solar).
Since you have used UK figures (rather than the OP's North American bias) ~ there we see wind turbines supplying around 20-25% of electricity needs. Planned turbine growth will exceed expected growth of UK electricity needs.
The UK usage of lubricating oil is an interesting topic. Davz, on your figures the oil usage by wind turbines is close to 10% of the lubricating oil used by the UK's 40 million vehicles. More turbines = more oil, and yet more more electric vehicles = less lubricating oil. A nett advantage for EV's (and that also ignores the fuel oil used by ICE vehicles).
Davz, please check the figures for lubricating oil used by nuclear plants ~ on the little that I have seen, it is reported that "nuclear" uses a much higher oil amount per MegaWatthour than does coal / gas / wind turbine. And then there is the problem of nuclear's huge costs & very slow build times (but I presume you know that).
Costs of batteries is red-herring. When wind turbines are over-producing electricity, the turbines are feathered or stopped down. Future battery costs . . . who knows? . . . but the technology is leading to much lower prices. Eventually, a small household battery may get to the price of a household refrigerator.
# By the way Davz, please return to your comment on another thread, where you suggested that climate warming had no way of contributing to increased wilfires. It would be ethical of you to discuss your point further ~ or acknowledge that you were wrong.
- 2023 SkS Weekly Climate Change & Global Warming News Roundup #29
Bob Loblaw at 05:10 AM on 26 July, 2023Wild and One:
I'm going to have to express some disagreement. Although in public discourse and discussion there may be reasons to keep emphasizing the links between human activities, fossil fuels, and changing climates, in the scientific discussion (which Skeptical Science tries to focus on), the terms such as "climate change" have specific scientific meaning.
Not all climate change is induced by burning fossil fuels or other recent human activities. Using vocabulary that fails to recognize that will lead to a risk of losing credibility. Number 1 on the SkS "Most used climate myths" is "Climate's changed before". Number 89 is "They changed the name from 'global warming' to 'climate change'." Number 209 is "IPCC edited out natural causes of climate change".
It's unfortunate, but you need to be careful on how contrarians will twist your words.
- How big is the “carbon fertilization effect”?
daveburton at 01:45 AM on 14 July, 2023Eclectic wrote, "Daveburton @22 ~ Please explain more of your first chart [ IPCC's decadal Carbon Flux Comparison 1980-2019 ]. The natural sink flux figures… show a rather steady proportionality to the total carbon emissions."
Glad to. Any two things which steadily increase are thereby correlated. There's only a possibility that the relationship might be causal if there's a possible mechanism for such causality.
There's no possible mechanism by which the rate at which CO2 emerges from chimneys could govern the rate at which CO2 is taken up by trees & absorbed by the oceans, or vice-versa, so the relationship cannot be causal — just as this famous relationship is not causal:

Eclectic wrote, "The land sink shows about 30-35% of total emissions, while the sum of land & ocean remains around 55-60%."
Yes, I usually say "about half," as in, "If our CO2 emissions were cut by more than about half then the atmospheric CO2 level would be falling, rather than rising."
It is important to recognize that the relationship is merely coincidental, not causal.
Eclectic wrote, "as the decades progress, the natural carbon sink flux in absolute terms rises with the rising emissions ~ but does not show a proportional increase."
The rate at which natural processes, such as ocean uptake, uptake by trees and soil ("greening"), and rock weathering, remove CO2 from the air, is affected in minor ways by many factors, but in a major way by only one: the current amount of CO2 in the air.
Our CO2 emission rate does not and cannot affect the natural removal rate, except indirectly, in the long term, by being one of the most important factors which affect the amount of CO2 in the air.
Eclectic wrote, "looking back in time ~ as the atmospheric CO2 level decreases, the size of the natural sink flux decreases also."
That is correct. It will also be correct looking forward in time, when CO2 levels are falling, someday.
Eclectic wrote, "this directly contradicts your hypothesis of 'if emissions were halved ... atmospheric CO2 level would plateau.'"
If you'll allow me to use "halved" as a shorthand for "reduced to the point at which emissions merely equal current natural removals, rather than exceed them," then those two statements are both correct, and perfectly consistent. It's pCO2 (level), not the rate of CO2 emissions, which (mostly) governs the rates of all the natural CO2 removal from the atmosphere.
Of course there are also minor factors which affect the removal rates. For instance, as we've already discussed, a 1°C rise in water temperature slows ocean uptake of CO2 by roughly 3%. Conversely, a rise in air temperature accelerates CO2 removal by rock weathering. (Sorry, I don't have a quantification of that.) But the main factor which controls the rate of CO2 removals is pCO2.
Eclectic wrote, "While the nutritive components of some food crops may reduce slightly as CO2 rises…"
Oh boy, another rabbit hole! That's the Loladze/Myers "nutrition scare."
It is of little consequence. That should be obvious if you consider that crops grown in commercial greenhouses with CO2 levels as high as 1500 ppmv are as nutritious as crops grown outdoors with only 30% as much CO2.

≥1500 ppmv CO2 is optimal for most crops. That's why commercial greenhouses typically use CO2 generators to raise daytime CO2 concentration to well above 1000 ppmv. It is expensive, but they go to that expense because elevated CO2 (eCO2) makes crops much healthier and more productive. (They don't typically supplement CO2 at night unless using grow-lamps, because plants can't use the extra CO2 without light.)
If elevating CO2 by >1000 ppmv doesn't cause crops to be less nutritious, then elevating CO2 by only 140 ppmv obviously doesn't, either.
Better crops yields, due to eCO2 or any other reason, can cause lower levels (but not lower total amounts) of nutrients which are in short supply in the soil. But that doesn't happen to a significant extent when agricultural best practices are employed.
I had an impromptu online debate about the nutrition scare with its most prominent promoter, mathematician Irakli Loladze, in the comments on a Quora answer. If you're not a Quora member you can't read it there, so I saved a copy here. He acknowledged to me that food grown in greenhouses at elevated CO2 levels is as nutritious as food grown outdoors.
Faster-growing, more productive crops require more nutrients per acre, but not more nutrients per unit of production.
Inadequate nitrogen fertilization reduces protein production relative to carbohydrate production, because proteins contain nitrogen, but carbohydrates don't. Likewise, low levels of iron or zinc in soils cause lower levels of those minerals in some crops. So, it is possible, by flouting well-established best agricultural practices, to contrive circumstances under which eCO2, or anything else which improves crop yields, causes reduced levels of protein or micronutrients in crops.
But farmers know that the more productive crops are, the more nutrients they need, per acre. Competent farmers fertilize accordingly.
Or, for nitrogen, they may plant nitrogen-fixing legumes — which benefit greatly from extra CO2.
If you don’t fertilize according to the needs of your crops, negative consequences may include reductions in protein and/or micronutrient levels in the resulting crops. The cause of such reductions isn't eCO2s, it's poor agricultural practices.
The nutrient scare is an attempt to put a negative "spin" on the most important benefit of eCO2: that it improves crop yields.
Eclectic wrote, "it is (as you state) beyond argument that higher CO2 benefits overall crop yield & plant mass."
That's correct. Moreover, agronomy studies show that for most crops the effect is highly linear as CO2 levels rise, until above about 1000 ppmv (which is far higher than we could ever hope to drive outdoor CO2 levels by burning fossil fuels). That linearity is obvious in the green (C3) trace, here:

That improvement is one of several major reasons that catastropic famines are fading from living memory.
If you're too young to remember huge, catastrophic famines, count yourself blessed. Through all of human history, until very recently, famine was one of the great scourges of mankind, the "Third Horseman of the Apocalypse." But no more. This is a miracle!
https://ourworldindata.org/famines

Ending famine is a VERY Big Deal, comparable to ending war and disease. Compare:
● Covid-19 killed 0.1% of world population.
● 1918 flu pandemic killed about 2%.
● WWII killed 2.7%.
● The near-global drought and famine of 1876-78 killed about 3.7% of the world population.
Eclectic wrote, "other CO2/AGW concomitant effects of increased droughts /floods /heat-waves can be harmful to crop yields in open-field agriculture. [And especially so for the staple crop of maize.]"
Well, let's examine those one at a time.
Heat-waves. Overall, temperature extremes are not worsened by the warming trend. Heat waves are slightly worsened, but by less than cold snaps are mitigated. That's because, thanks to "Arctic amplification," warming is disproportionately at chilly high latitudes, and it is greatest at night and in winter. The tropics warm less, which is nice, because they're warm enough already.
1°C is about the temperature change you get from a 500 foot elevation change. (That's calculated from an average lapse rate of 6.5 °C/km.)
On average, 1°C is similar in effect to a latitude change of about sixty miles, as you can see by looking at an agricultural growing zone map. Here's one, from the Arbor Day Foundation:

From eyeballing the map, you can see that 1°C (1.8°F) = about 50-70 miles latitude change.
James Hansen and his colleagues reported a similar figure: "A warming of 0.5°C... implies typically a poleward shift of isotherms by 50 to 75 km..."
1°C is less than the hysteresis ("dead zone") in your home thermostat, which is the amount that your indoor temperatures go up and down, all day long, without you even noticing.
In the American Midwest, farmers can fully compensate for 1°C of climate change by adjusting planting dates by about six days.

Floods. Theoretically, by accelerating the water cycle, climate change could increase the frequency or severity of floods. But the effect is too slight to be noticeable. AR6 says no change in global flood frequency is detectable:

Droughts. Droughts have not worsened. In fact, the global drought trend is slightly down. Here's a study:
Hao et al. (2014). Global integrated drought monitoring and prediction system. Sci Data 1(140001). doi:10.1038/sdata.2014.1

Here's the U.S. drought trend (the bottom/orange side of the graph):
https://www.ncei.noaa.gov/access/monitoring/uspa/wet-dry/0

Not only does climate change not worsen droughts, it has long been settled science that eCO2 improves plants' water use efficiency (WUE) and drought resilience, by improving CO2 stomatal conductance relative to transpiration. So eCO2 is especially beneficial in arid regions, and for crops which are under drought stress.
Maize (corn) has been very heavily studied. Even though it is a C4 grass, it benefits greatly from elevated CO2, especially under drought stress. Here's a study (one of many):
Chun et al. (2011). Effect of elevated carbon dioxide and water stress on gas exchange and water use efficiency in corn. Agric For Meteorol 151(3), pp 378-384, ISSN 0168-1923. doi:10.1016/j.agrformet.2010.11.015.
EXCERPT:
"There have been many studies on the interaction of CO2 and water on plant growth. Under elevated CO2, less water is used to produce each unit of dry matter by reducing stomatal conductance."
Here's a similar study about wheat:
Fitzgerald GJ, et al. (2016) Elevated atmospheric [CO2] can dramatically increase wheat yields in semi-arid environments and buffer against heat waves. Glob Chang Biol. 22(6):2269-84. doi:10.1111/gcb.13263.
However, I agree with you that putting a monetary value on the benefits of CO2 for crops is difficult. In part that's because the price of food soars when it's in short supply, and plummets when it's plentiful. So, for example, if we were to attribute, say, 15% of current crop yields to CO2 fertilization & CO2 drought mitigation, and value that 15% using current crop prices, we would be underestimating the true value, because absent that 15% boost the prices would have been much higher.
- How big is the “carbon fertilization effect”?
daveburton at 15:36 PM on 13 July, 2023Rob wrote elsewhere, "greening is now turning into 'browning.' ... fertilization [has now been] overwhelmed by other effects... In other words, the greening has now stopped," and here, "You were making the claim that natural sinks were removing more of our emissions, and that is not the case by any stretch of the imagination.""
Here's AR6 WG1 Table 5.1, which shows how natural CO2 removals are accelerating:
https://www.ipcc.ch/report/ar6/wg1/downloads/report/IPCC_AR6_WGI_Chapter_05.pdf#page=48
Here it is with the relevant bits highlighted:
https://sealevel.info/AR6_WG1_Table_5.1.png
Or, more concisely:
https://sealevel.info/AR6_WG1_Table_5.1_annot1_partial_carbon_flux_comparison_760x398.png
: 2.0 ⇒ 2.6 ⇒ 2.9 ⇒ 3.4 PgC/yr")
(Note: 1 PgC = 0.46962 ppmv = 3.66419 Gt CO2.)
As you can see, as atmospheric CO2 levels have risen, the natural CO2 removal rate has sharply accelerated. (That's a strong negative/stabilizing climate feedback.)
AR6 FAQ 5.1 also shows how both terrestrial and marine carbon sinks have accelerated, here:
https://www.ipcc.ch/report/ar6/wg1/downloads/report/IPCC_AR6_WGI_Chapter05.pdf#page=99
Here's the key graph; I added the orange box, to highlight the (small) portion of the graph which supports your contention that, "greening is now turning into 'browning.' ... fertilization [has now been] overwhelmed by other effects... In other words, the greening has now stopped."
https://sealevel.info/AR6_FAQ_5p1_Fig_1b_final2.png
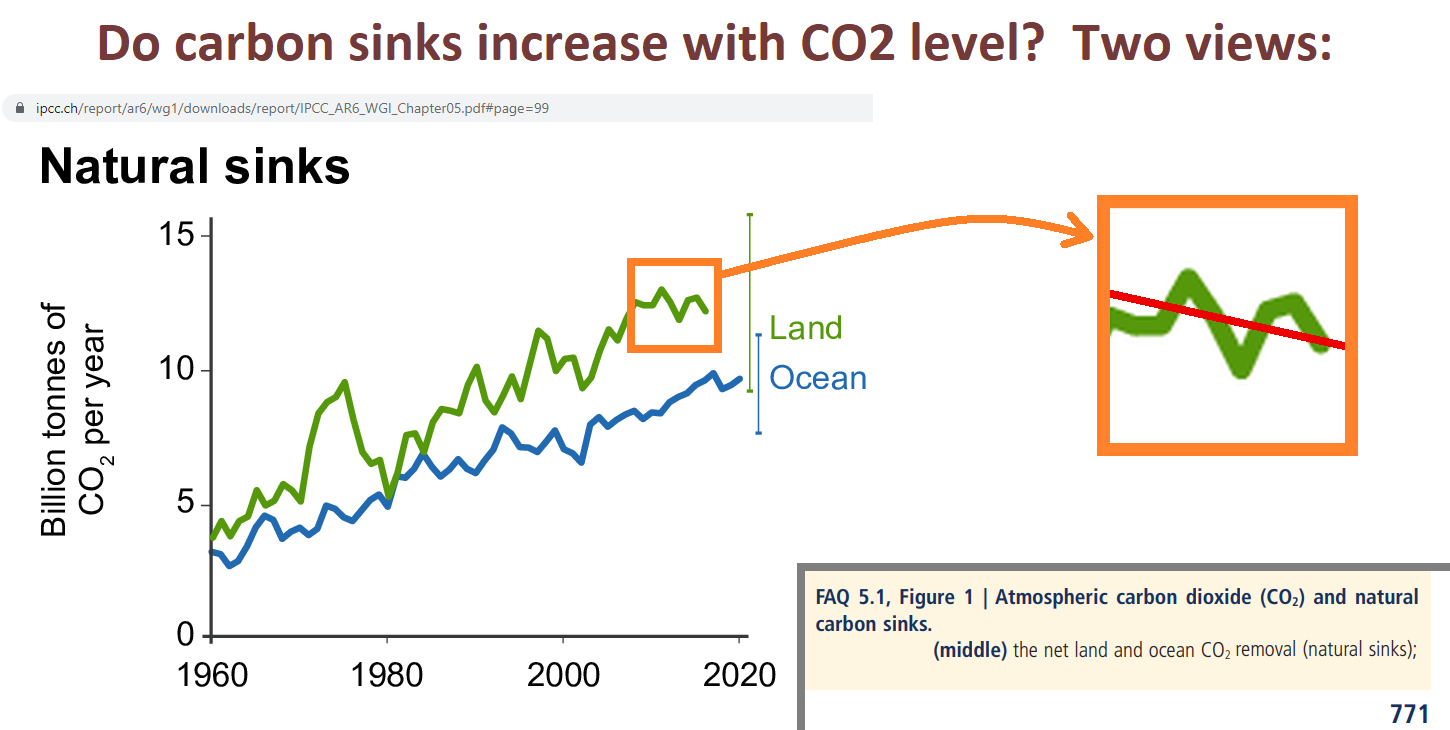
Here's the caption, explicitly saying that natural removal of carbon from the atmosphere is NOT weakening:

The authors did PREDICT a "decline" in the FUTURE, "if" emissions "continue to increase." But it hasn't happened yet.
What's more, the "decline" which they predicted was NOT for the rate of natural CO2 removals by greening and marine sinks, anyhow. Rather, if you read it carefully, you'll see that that hypothetical decline was predicted for the ratio of natural removals to emissions.
What's more, their prediction is conditional, depending on what happens with future emissions ("if CO2 emissions continue to increase").
Well, predictions are cheap. My prediction is that natural removals of CO2 from the atmosphere will continue to accelerate, for as long as CO2 levels rise.
The "fraction" which they predict might decline, someday, doesn't represent anything physical, anyhow. (It is one minus the equally unphysical "airborne fraction.") Our emission rate is currently about twice the natural removal rate, so if emissions were halved, the removal "fraction" would be 100%, and the atmospheric CO2 level would plateau. If emissions were cut by more than half then the removal "fraction" would be more than 100%, and the CO2 level would be falling.
I wrote elsewhere, "This recent study quantifies the effect for several major crops. Their results are toward the high end, but their qualitative conclusion is consistent with many, many other studies. They reported, "We consistently find a large CO2 fertilization effect: a 1 ppm increase in CO2 equates to a 0.4%, 0.6%, 1% yield increase for corn, soybeans, and wheat, respectively.""
If you recall that mankind has raised the average atmospheric CO2 level by 140 ppmv, you'll recognize that those crop yield improvements are enormous!
Rob replied, "If you actually read more than just the abstract of that study you find this on page 3: 'Complicating matters further, a decline in the global carbon fertilization effect over time has been documented, likely attributable to changes in nutrient and water availability (Wang et al. 2020).'"
Rob, I already addressed Wang et al (2020), but you might not have seen it, because the mods deemed it off-topic and deleted it. Here's what I wrote:
Rob, it's possible that your confusion on the greening/browning point was due to a widely publicized paper, with an unfortunately misleading title:
Wang et al (2020), "Recent global decline of CO2 fertilization effects on vegetation photosynthesis." Science, 11 Dec 2020, Vol 370, Issue 6522, pp. 1295-1300, doi:10.1126/science.abb7772
Many people were misled by it. You can be forgiven for thinking, based on that title, that greening due to CO2 fertilization had peaked, and is now declining.
But that's not what it meant. What it actually meant was that the rate at which plants remove CO2 from the atmosphere has continued to accelerate, but that its recent acceleration was less than expected. (You can't glean that fact from the abstract; would you like me to email you a copy of the paper?)
What's more, if you read the "Comment on" papers responding to Wang, you'll learn that even that conclusion was dubious:
Sang et al (2021), "Comment on 'Recent global decline of CO2 fertilization effects on vegetation photosynthesis'." Science 373, eabg4420. doi:10.1126/science.abg4420
Frankenberg et al (2021), "Comment on 'Recent global decline of CO2 fertilization effects on vegetation photosynthesis'." Science 373, eabg2947. doi:10.1126/science.abg2947
Agronomists have studied every important crop, and they all benefit from elevated CO2, and experiments show that the benefits continue to increase as CO2 levels rise to far above what we could ever hope to reach outdoors. Perhaps surprisingly, even the most important C4 crops, corn (maize) and sugarcane, benefit dramatically from additional CO2. C3 plants (including most crops, and all carbon-sequestering trees) benefit even more.
Rob also quoted the study saying, "While CO2 enrichment experiments have generated important insights into the physiological channels of the fertilization effect and its environmental interactions, they are limited in the extent to which they reflect real-world growing conditions in commercial farms across a large geographic scale."
That's a reference to the well-known fact that Free Air Carbon Enrichment (FACE) studies are less accurate than greenhouse and OTC (open top container) studies, because in FACE studies wind fluctuations unavoidably cause unnaturally rapid variations in CO2 levels. So FACE studies consistently underestimate the benefits of elevated CO2. Here's a paper about that:
Bunce, J.A. (2012). Responses of cotton and wheat photosynthesis and growth to cyclic variation in carbon dioxide concentration. Photosynthetica 50, 395–400. doi:10.1007/s11099-012-0041-7
The issue is also explained by Prof. George Hendrey, here:
"Plant responses to CO2 enrichment: Much of what is known about global ecosystem responses to future increases in atmospheric CO2 has been gained through Free-Air CO2 Enrichment (FACE) experiments of my design. All FACE experiments exhibit rapid variations in CO2 concentrations on the order of seconds to minutes. I have shown that long-term photosynthesis can be reduced as a consequence of this variability. Because of this, all FACE experiments tend to underestimate ecosystem net primary production (NPP) associated with a presumed increased concentration of CO2."
Rob wrote, "It does seem that you're claiming CO2 uptake falls with increasing temperature.""
That is correct for uptake by water. Or, rather, it would be correct, were it not for the fact that the small reduction in CO2 uptake due to the temperature dependence of Henry's Law is dwarfed by the large increase in CO2 uptake due to the increase in pCO2.
Rob wrote, "But it's unclear to me how you think this plays into the conclusion that CO2 levels would 'quickly normalize' over the course of 35 years" and also, "You also claimed CO2 concentrations would quickly come down (normalize) once we stop emitting it. This is also not correct unless you're using 'normalize' to mean 'stabilize at a new higher level'."
Perhaps you've confused me with someone else. I said nothing about CO2 levels "normalizing."
I did point out that the effective half-life for additional CO2 which we add to the atmosphere is only about 35 years. I wrote:
The commonly heard claim that "the change in CO2 concentration will persist for centuries and millennia to come" is based on the "long tail" of a hypothetical CO2 concentration decay curve, for a scenario in which anthropogenic CO2 emissions go to zero, CO2 level drops toward 300 ppmv, and carbon begins slowly migrating back out of the deep oceans and terrestrial biosphere into the atmosphere. It's true in the sense that if CO2 emissions were to cease, it would be millennia before the CO2 level would drop below 300 ppmv. But the first half-life for the modeled CO2 level decay curve is only about 35 years, corresponding to an e-folding "adjustment time" of about fifty years. That's the "effective atmospheric lifetime" of our current CO2 emissions.
Rob wrote, "Dave... The fundamental fact that you disputed is that oceans take up about half of our emissions."
That reflects two points of confusion, Rob.
In the first place, our emissions are currently around 11 PgC/year (per the GCP). The oceans remove CO2 from the atmosphere at a current rate of a little over 2.5 PgC/year. That's only about 1/4 of the rate of our emissions, not half.
More fundamentally, the oceans are not removing some fixed fraction of our emissions. None of the natural CO2 removal processes do. All of them remove CO2 from the bulk atmosphere, at rates which largely depend on the atmospheric CO2 concentration, not on our emission rate. If we halved our CO2 emission rate, natural CO2 removals would continue at their current rate.
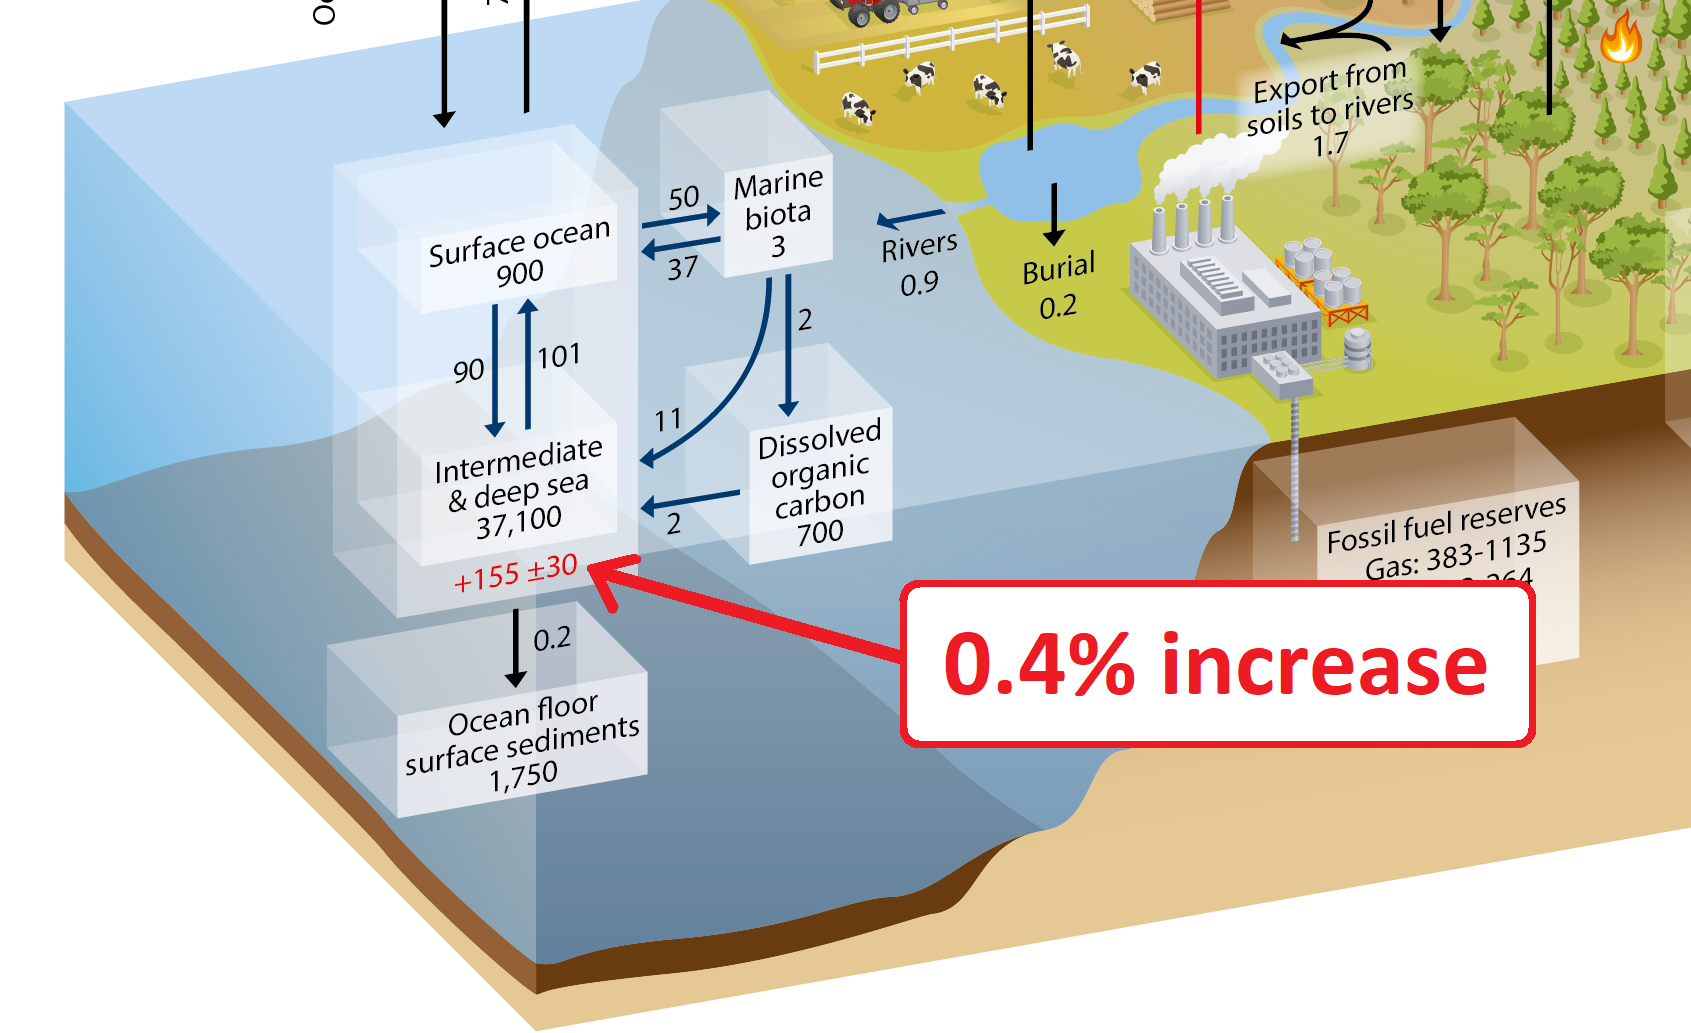
Because human CO2 emissions are currently faster than natural CO2 removals, we've increased the atmospheric CO2 level by about 50% (140 ppmv), but we've increased the amount of carbon in the oceans by less than 0.5%, as you can see in AR5 WG1 Fig. 6-1.
Sorry, this got kind of long. I hope I addressed all your concerns.
- Hansen predicted the West Side Highway would be underwater
daveburton at 07:39 AM on 6 July, 2023Rob wrote, "that greening is now turning into 'browning.'"
Well, here's what AR6 shows:
Some people point to that little orange box and say that greening has ceased. That reminds me of the folks who say that the it's not as warm as the 2015-16 El Nino, so warming has ceased.
Philippe wrote, "There is probably a better thread for this argument,"
I agree. I was just trying to address OnePlanet's remark about a "locked in" CO2 level.
Philippe wrote, "There is only one factor that truly controls how green any region can be: water availability."
That's a common misconception. Elevated CO2 levels greatly improve plants' water use efficiency (WUE) and drought resilience. That's why elevated CO2 is especially beneficial for crops when under drought stress. It has been heavily studied by agronomists. Here's a paper about wheat:
Fitzgerald GJ, et al. (2016) Elevated atmospheric [CO2] can dramatically increase wheat yields in semi-arid environments and buffer against heat waves. Glob Chang Biol. 22(6):2269-84. doi:10.1111/gcb.13263.
Philippe wrote, "The experiences that have shown a CO2 fertilization effect were done in very controlled conditions and involved extremely high concentrations (800 ppm and up)."
That's incorrect. All major crops have been studied, and all benefit from elevated CO2. It is true that the greatest benefits accrue at 1000 ppmv or higher, but even modest CO2 increases significantly improve crop yields.
This recent study quantifies the effect for several major crops. Their results are toward the high end, but their qualitative conclusion is consistent with many, many other studies. They reported, "We consistently find a large CO2 fertilization effect: a 1 ppm increase in CO2 equates to a 0.4%, 0.6%, 1% yield increase for corn, soybeans, and wheat, respectively."
This study evaluated pine trees:
Idso, S., & Kimball, B. (1994). Effects of atmospheric CO2 enrichment on biomass accumulation and distribution in Eldarica pine trees. Journal of Experimental Botany, 45, 1669-1672.

As you noted, the effect is greatest with CO2 >800 ppmv, but, as you can see, even a much smaller CO2 increase has a substantial effect.
Rob wrote, "This entire paragraph is patently absurd and completely fabricated."
It is 100% factual, Rob. I'm surprised that you didn't already know it.
These figures are from that same AR6 Table 5.1 excerpt which I already showed you:
average CO2 removal rate in the 2010s = 2.7707 ppmv/yr
average CO2 removal rate in teh 2000s = 2.3481 ppmv/yr
These figures are from Mauna Loa:
average CO2 level in the 2010s = 399.91 ppmv
average CO2 level in the 2000s = 378.84 ppmv
(399.91-378.84) / (2.7707-2.3481) = 49.86
So a 50 ppmv increase in CO2 level accelerates the natural removal rate by about 1 ppmv/year.
49.86 / 2.1294 = 23.42 ppmv increase yields a +1 PgC removal rate increase.
I encourage you to do the calculations yourself for any other time period of your choice.
If you have the natural removal rate as a function of CO2 level (which we do), it is trivial to simulate the CO2 level decline if emissions were to suddenly cease. I wrote a little Perl program to do it; email me if you want a copy.
Rob wrote, "if true, the oceans would just continue to suck up all the atmospheric CO2 and we'd live on a frozen planet."
That's incorrect. The system progresses toward equilibrium, which is below 300 ppmv, but not zero.
Rob wrote, "rather that starting from a prior where all the published science is getting it wrong, and making stuff up... you don't have the requisite training to fully grasp the topic"
Rob, it's not necessary to resort to ad hominem attacks. I'm happy to document things that are surprising to you. You need but ask. Everything I've written is well-supported.
Rob wrote, "take some time to fully familiarize yourself with Henry's Law."
Due to the temperature dependence of Henry's Law, a 1°C increase in temperature slows CO2 uptake by the oceans by about 3%. But a 50% (140 ppmv) rise in atmospheric CO2 concentration accelerates CO2 uptake by the oceans by 50%. That's the main reason that ocean uptake of CO2 continues to accelerate.
- Hansen predicted the West Side Highway would be underwater
daveburton at 03:51 AM on 6 July, 2023Thanks for fixing those links, Rob. We were obviously typing simultaneously; you beat me to it by 7 minutes.
However, nothing I wrote was misleading. If you "follow the link to the actual IPCC page to read the full" table, you'll see that it shows exactly what I said it shows: as atmospheric CO2 levels have risen, the natural CO2 removal rate has sharply accelerated. (That's a strong negative/stabilizing climate feedback.)
The commonly heard claim that "the change in CO2 concentration will persist for centuries and millennia to come" is based on the "long tail" of a hypothetical CO2 concentration decay curve, for a scenario in which anthropogenic CO2 emissions go to zero, CO2 level drops toward 300 ppmv, and carbon begins slowly migrating back out of the deep oceans and terrestrial biosphere into the atmosphere. It's true in the sense that if CO2 emissions were to cease, it would be millenia before the CO2 level would drop below 300 ppmv. But the first half-life for the modeled CO2 level decay curve is only about 35 years, corresponding to an e-folding "adjustment time" of about fifty years. That's the "effective atmospheric lifetime" of our current CO2 emissions.
Moreover, it is not correct to say that "the ocean takes up about half of our emissions." Our emissions are currently around 11 PgC/year (per the GCP). The oceans remove CO2 from the atmosphere at a current rate of a little over 2.5 PgC/year, but they are not removing some fixed fraction of our emissions. If we halved our emission rate, natural CO2 removals would continue at their current rate.
Because human CO2 emissions are currently faster than natural CO2 removals, we've increased the atmospheric CO2 level by about 50% (140 ppmv), but we've increased the amount of carbon in the oceans by less than 0.5%, as you can see in AR5 WG1 Fig. 6-1. (It's not a problem for "sea dwelling creatures.")
In the oceans, biology generally trumps chemistry, and that is certainly true for CO2 uptake. Some people think that the capacity of the oceans to take up CO2 is limited to surface water by ocean stratification. But that's incorrect, beause the "biological carbon pump" rapidly moves CO2 from surface waters into the ocean depths, in the form of "marine snow."
The higher CO2 levels go, the faster that "pump" works. Here's a paper about it:
https://www.science.org/doi/reader/10.1126/science.aaa8026
Once carbon has migrated from the ocean surface to the depths, most of it remains sequestered for a very long time. Some of it settles on the ocean floor, but even dissolved carbon is sequestered for a long time. For instance, it is estimated that the AMOC takes about 1000 years to move carbon-rich water from high latitudes to the tropics, where it can reemerge. That is obviously far longer than the anthropogenic CO2 emission spike will last.
- EPA’s car pollution rules would save Americans trillions of dollars
michael sweet at 06:16 AM on 13 May, 2023Reading Eric's link about Brake and tire dust I noticed that they always said "brake and tire". That suggests to me that brake dust is more important. The article suggests that this research is just beginning because ICE pollution used to be so much bigger that people did not bother looking at brakes and tires.
I Goggled a little and found that a lot of EV's use one pedal driving. I have found that with one pedal driving I rarely use the brakes. I have not measured but I would estimate much less than 5% of the time. It appears that all electric cars use regenerative brakes. The brake wear from electric cars will be much lower than current ICE cars. I saw a youtube video (what could be more accurate ;) where after 90,000 miles (about 145,000 Km) the brake pads were about 15% worn. Google says brake pads should be replaced every 20,000 miles, although some pads last longer.
The mechanic estimated that the tires had been driven 65,000 miles and had 5,000 miles left on them. The car was a Tesla model. 70,000 miles is not much different than an ICE car tire wear. I note that when you buy tires some have much longer warranty milage claims than other tires. Presumably tires with a longer lifetime release less dust per mile. The size of the dust particles is probably also different but I have no idea what the differences are.
My conclusion is that elecric cars release much less brake dust and probably a little more tire dust than ICE cars. Since these are currently not even measured because ICE cars release so much particle pollution, switching to electric cars will dramatically reduce small particle pollution.
- EPA’s car pollution rules would save Americans trillions of dollars
michael sweet at 10:21 AM on 12 May, 2023Eric,
My Tesla Model 3 uses the motor for almost all of the braking. I will be very surprised if the vehcle ever requires new brake pads. I have read that many other (most? All?) electric cars primarily use the motor for braking since they generate electricity to increase driving range. Can you provide a reference that says electric cars will wear out brake pads faster than ICE cars? Even hybrids use regenerated braking to increase range.
What do other model electric car users who read SkS find about brake use? All Teslas primarily use regenerative braking with the engine and not brake pads.
I have heard a little about tire wear. My niece, who is a environmental scientist working on land management, had never heard of this type of pollution, which suggests to me that it is not very important. Can you provide a link that describes the importance of electric cars versus ICE and tire wear? I expect that tire manufactures will reformulate tires to reduce wear if it is a problem, how much that would help is another question.
I notice that fossil fuel proponents raise a lot of red herrings about electric cars, like brake pad and tire wear. Are these really issues or are they fossil propaganda?
- CO2 is not the only driver of climate
Bob Loblaw at 07:54 AM on 9 May, 2023piotr @ 73:
I am not sure what your "not directly" statement refers to. I presume that the Martin Mlynczak quote is the one in comment 69. To put it simply, the thermosphere and the earth's surface respond to solar radiation in very different ways. You can read about the thermosphere on Wikipedia. Note that the thermosphere is at very high altitudes (>80km), and its temperature structure is the result of the absorption of UV radiation. It also has very low density, so even though average kinetic energy is high ("temperature") it does not hold a lot of heat. It is not strongly linked to the surface, which is heated by the absorption of solar radiation over the full spectrum.
This paper by Lean, Beer, and Bradley (1995) shows in figure 2 that variations in total solar irradiance are much less than for the UV range (in %).

To use the 4W/m2 drop in that figure, you need to first reduce it by a factor of 4 (area of a sphere vs. area of a circle), and then adjust for global albedo (0.3), giving an overall forcing of only about 0.7 W/m2. Sustained over only a period of about 50 years, this is not going to have a major cooling effect on its own.
You say that "it noticeabl[y]e cooled large parts of the no[r]thern hemisphere", which I presume is a claim with respect to surface temperature responding to these solar variations. You then throw in volcanic effects. You seem to grossly overestimate those solar effects, though - with no references to any supporting information. If you look at this SkS post, the first figure shows that reconstructed global temperatures for that period are much smaller than your claimed "decrease up to 1.5°C".

In your second paragraph, you start talking about "The past 10.000 years where up and downs in global mean temperature like +/- 2°C for dozen decades, even for nearly 2000 years - as we can reconstruct with little data-points." This starts to wander into the last glacial period, where Milankovitch cycles start to play a role. You are mixing together a lot of different forcing mechanisms, as if they are all equivalent in some fashion.
You then start into urban heat island effects, and finish off with a couple of paragraphs that represent an argument from incredulity. If you actually want to learn something about temperature reconstructions from proxies, Wikipedia has a decent article on this, too. The Wikipedia page also has a graph that shows even less variation in temperature than the one above:

The numbers you are throwing around in your "just imagine" scenarios seem to be ones that you have a lot of confidence in. The problem is that they also appear to disagree with broad swaths of the scientific literature. You appear to be claiming that science is unsure of what happened in the past - but you are. It seems highly unlikely that you are correct.
If you want to have any credibility here, you are going to have to provide references to the numbers you post. This is not a site where you will be permitted to post a lot of unsubstantiated opinion. As you are a new user here, I strongly suggest that you read the Comments Policy.
- CO2 is not the only driver of climate
Eclectic at 05:51 AM on 9 May, 2023Piotr @73 ,
Wind & ocean currents move heat energy around the planet - and so there is a considerable "averaging" effect on global temperatures. Even today, you do not need thousands of observation stations in order to assess changes in global temperature. Analysis shows that less than 100 stations are needed (if well-distributed, of course) to give a closely accurate picture of conditions.
A so-called Grand Solar Minimum is not actually very grand ~ studies such as Feulner & Rahmstorf, 2010 and Anet et al., 2013 indicate that a GSM produces a global cooling of around 0.3 degreesC. (Other studies indicate slightly smaller changes.) And this is because our Sun is a very stable star, with a very stable output of radiation. Very little variation.
Even the Little Ice Age was not spectacularly cold ~ a global cooling around 0.5 degreesC . . . which had been helped along by a number of cold winters from volcanic eruptions.
There have been periods of decades of marked cooling in the neighborhood of Greenland earlier in the Holocene, as a result in temporary changes in ocean currents. But these had little effect on average global temperature (the planet is big, and there is a vast amount of tropical ocean). The one exception is the millennium of strong cooling (the "Younger Dryas" ) about 12,000 years ago ~ and this was a one-off event produced by the single event of melt/discharge of the Laurentide Ice Sheet situated in Canada.
Piotr, you seem to have a wrong idea about earlier warm periods (of the Holocene) such as the so-called Minoan / Roman / Medieval Warm Period ~ these were only very slight changes, around 0.3 degreesC or smaller. These were only tiny "blips" on the general slow cooling from the Holocene Maximum temperature (slow cooling owing to the Milankovitch Cycle).
Possibly you have been misled by reports based on Arctic region temperature estimates (the Arctic shows bigger swings than the average global temperature).
- CO2 is not the only driver of climate
piotr at 03:11 AM on 9 May, 2023@Bob Loblaw
Not directly. I was just wondering on Nasa's Martin Mlynczak statement to Grand solar minimum "and will not cause noticeable cooling at the surface". Yeah, not globally, except the overall temperatures may decrease a bit in statistics too. But it noticeable cooled large parts of the nothern hemisphere, like big vulcanic eruptions can cause for few years and did in even the last 150 years too -> global mean temperatures decrease up to 1.5°C, besides some areals warmed then too.
So what is Martin Mlynczak talking about? The past 10.000 years where up and downs in global mean temperature like +/- 2°C for dozen decades, even for nearly 2000 years - as we can reconstruct with little data-points.
Overall my main questions is the concerning how plausible is the reconstruction of earthly temperatures over thousands of years just with indirect data besides modern technology with thousend parameters, stations around the globe and on every time (even in grown urban places, which totally heat up just being sealed ground and overcrowded for decades). modern observation for like 30 years am totally cool with, but the rest is a large extrapolation of indirect measurement and got "worse" at we strife further away in time.
Just imagen if we would have high technology measurements like today in for example 6000 BC to 5500 BC, then we would see global warming for at least 0,5 - 0,8 °C over aproxx 1-200years similar like today and we knew that for some areas or changing habitats like sahara desert, but not excessive like modern data amount. btw. its also stated there were same co2 ppm levels as pre-industrial times.
i think its "fascinating" to have data from million years ago, when no modern human lived and we think to "know" how life was back then, globally, just by knowing some single fragments and feeding supercomputers with, which try hart to simulate complex features like climate or even local weather to be back then. Im a big fan of astronomy since my child days and read about the fist extrasolar-findings back in the days. but thats much more extreme, as we can never proof for real, even if its pretty possible to conclude a habital place somewhere on a planet just by reconstruction of the atmosphere, despite being back in time maybe million years ago. its hilarious to say "we found a possible earthlike planet!".
- CO2 is not the only driver of climate
Bob Loblaw at 11:20 AM on 8 May, 2023piotr @ 70:
You ask what might have caused the Maunder Minimum. First, you should think about exactly what the Maunder Minimum was: a period of low sunspot numbers. Wikipedia has a good article, and they include this figure:

Technically, "what caused the Maunder Minimum?" is a question of astrophysics, not climatology. But what you are probably wanting to ask is "what caused the xxxxx?, where xxxxx is something that you feel is correlated with the Maunder Minimum. Reduced solar irradiance? Lower temperatures? The Little Ice Age?
So, this means that you are looking at something where the Maunder Minimum is an indirect/proxy indicator of some potential climate factor. You do realize that we do not have direct evidence that the Maunder Minimum caused a specific decrease in solar irradiance? You do realize that many of the observations indicating cooler temperatures - such as ice on the Thames -are local, and not global? The Little Ice Age appears to be related to a number of factors. You can read about it a bit more in this post.
Understanding of past climates is based on things like vegetation, sediments, etc. A lot of those have automatic time-averaging (trees don't grow in a year) and spatial averaging (sediments and pollen get carried in to lakes from large watersheds). The analysis of past climates includes a wide variety of proxy indicators. You can read more about it on this post.
In short, you need to be more specific in explaining what you do understand, and what questions you have.
- CO2 is not the only driver of climate
Eclectic at 10:20 AM on 8 May, 2023Piotr @70 ,
Think about it this way ~ causes and effects.
In this universe, if you see an effect, there must be a cause (and with enough study, you can find that cause - which may be a single cause, or a combination of causes).
Past studies (by experts) have shown broad changes in climate - not measured in tenths of a degree as per modern thermometers, but in broad assessments of indirect indications of climate average temperatures / sea level changes / vegetation changes / and so on. From this, it is evident that the climate changes when there is a causative change (a change in solar output, or in atmospheric CO2 levels, or in reflective "albedo" from global ice coverage, or in stratospheric aerosol particles from major volcanic eruptions).
All these jig-saw pieces fit together nicely, to give the scientists (and us) a good understanding of how climate "works".
Beware of non-scientists who say that "stuff just happens" [excuse the American expression]. They seem to wish to believe that the past century or two of very rapid global warming is somehow not caused by the obvious causes. And that it came for no identifiable reason. They seem to wish to believe that the modern warming "just happened for no cause" (sometimes expressed in the meaningless phrase "it is just a rebound from the Little Ice Age").
(The Little Ice Age had its own causes - frequent major volcanism plus episodes of reduction in solar output.)
Or they say that the modern rapid warming must instead be caused by "long-term changes/oscillations in ocean currents" ~ which actually does not make scientific sense (if they bothered to think it through).
Piotr, there are definitely some people who do not wish to think.
- Arctic sea ice has recovered
Albert at 17:00 PM on 20 April, 2023The Kinnard has Arctic ice extent increasing from about 750 to 1500 which is an absurdity. Vikings colonised Greenland about 980 and farmed some areas that today are permafrost.
But the graph shows 980 ice extent to be about the same as 1700 and by that time the areas farmed were permafrost.
The graph shows ice extent dropping dramatically from about 1400 but the little ice age was ramping up in 1400, not down.
The graph shows ice extent increasing dramatically from about 1600 but the LIA peaked around 1650-1700 and temperatures have risen sporadically ever since. The Central England Temperature database correlates well with this.
Here is a different reconstruction that shows 1940 Arctic ice to be about the same as
[LINK]
See figure 1b
But the guy was italian and what would they know? See, I can be sarcastic as well.
- There is no consensus
Rob Honeycutt at 10:24 AM on 20 April, 2023"But Michael Mann showed us in his model that the medieval warm period and little ice age never existed so all those thousands of scientists that proved they did exist must be wrong."
a) Please look up the definition of the word "heterogeneous."
b) Assuming you're talking about MBH98/99, that was nearly 25 years ago and their research only went back too the MWP. Perhaps you should catch up on more recent research.
(Yes, this is quickly veering off-topic... as one would expect.)
- There is no consensus
Albert at 09:46 AM on 20 April, 2023"Such low ECS figures would mean the earth's climate should be almost perfectly stable over geologic time (no glacial-interglacial cycles) and we know that's not true."
Rob, believe it or not there are other factors that effect global temperature like, the sun, solar winds, magnetic fields, cosmic rays, transportation and retention and expulsion of ocean heat, volcanic activity above and below water, aerosols, clouds, gravitational pull of other planets, milankovitcg cycles, earth rotation wobble, shifting of poles, etc.
Our current warming cycle started around 1700 as The little ice age peaked negatively and we have been warming sporadically ever since.
its all perfectly normal with many historical precedents in the Holocene and previous interglacials.
1000 years ago Vikings colonised and farmed parts of Greenland that are still permafrost today. How can this be unless Greenland was far hotter than today. etc Etc etc.
But Michael Mann showed us in his model that the medieval warm period and little ice age never existed so all those thousands of scientists that proved they did exist must be wrong.
- Arctic sea ice has recovered
MA Rodger at 23:43 PM on 19 April, 2023Albert @133/134,
Simply accepting anecdotal evidence from newspapers is not the way to determine historical Arctic ice conditions.
There are serious attempts to create records running back before the instrument era, like Walsh et al (2017) 'A database for depicting Arctic sea ice variations back to 1850' which is the subject of the CarbonBrief article linked @131 with the graphic @132. A little more recently there is Schweiger et al (2019) 'Arctic Sea Ice Volume Variability over 1901–2010: A Model-Based Reconstruction' which reaches similar conclusions, the graphic below from that paper showing rolling annual averages of Arctic SIV and annual red dots.

I would suggest you read the comment @123 if you feel that "no one has challenged the fact that Arctic ice thickness or extent has not dropped since 2012." And I do look at JAXA data and it evidently has "decreased since 2006" in that the JAXA annual average SIE 2006-22 has a linear trend of -0.032M sq km/y, a smaller decline than for the earlier part of the record (-0.51Msq km/y) but still a decline. So it has "dropped."
- The Big Picture
Bart Vreeken at 05:57 AM on 22 March, 2023Hi Rob @153
"the gravitational effects from the Greenland ice sheet are not going to reduce the Netherlands' risk from sea level rise."
Looks like you still don't understand the topic completely. I stated that only 12.5% of the meltwater of Greenland comes to the Netherlands. So yes, the gravitational effect does reduce the risk from sea level rise in NL a little.
"You were not the first to create temperature bars on a graph"
When I started with that I hadn't seen it anywhere else. But of course I can't oversee everything. I didn't research the complete Internet then. My remark about the inspriration for the Climate Stripes was just my opinion, just a site remark and not my main message of @131. You make it more important then it was.
- Antarctica is gaining ice
Bob Loblaw at 12:09 PM on 13 March, 2023Bart @ 552:
The point in my comment at 534, responding to your first comment, was that it is a huge mistake to try to make extrapolations into the future from a short time period. We see it all the time: temperature (The Escalator), sea ice coverage, etc. People that want to believe a particular thing, and ignore the long-term trend by saying "look at this!" from a short period of data at the end of a noisy data set.
If you had followed the link to The Escalator, you would have seen that the very first sentence says:
One of the most common misunderstandings amongst climate contrarians is the difference between short-term noise and long-term signal.
That you choose to call it "a stupid graph" indicates that you still don't understand the error in drawing grandiose claims from short periods of data.
Now, you are saying "The result is interesting: there don't seem to be much correlation between SMB and discharge. Strange enough, in the last year with little sea ice the discharge was even less then normal."
No, this is not at all interesting. As has been said to you previously, relationships between precipitation, accumulation, glacier flow, discharge, and sea ice are not simple. Rob Honeycutt has posed a number of questions to you in comment 554 that are germane to the point. Unless you understand why those questions are important, and can begin to think of answers to them, you are not looking at the topic seriously.
The very first response I gave to you - the first paragraph - was:
What exactly is your point? The links between sea ice area and land ice mass are not simple, and have been discussed in the detailed sections of the blog post and earlier comments.
I suggest that you actually try doing some reading, starting with the blog post (both the basic and intermediate sections) and then through the numerous comments, and maybe then you'll have enough understanding to be able to engage in a "serious discussion".
The simple answer is that you seem to be expecting a simply answer and a simple relationship for a complex system, and you are simply wrong.
- Antarctica is gaining ice
Bart Vreeken at 07:09 AM on 13 March, 2023As I said, I was hoping for a more serious discussion on this site.
What went wrong: in my first post I wanted to show the graph with the SMB as well. I must have done something wrong, for it didn't came up. Sorry for that. But this information is not so hard to find. MA Rodger succeeded in doing this, Bob Loblaw preferred to show a stupid graph about cherry-picking. Well, that's not the point here.
Anyhow. The correlation between SMB and mass change was not clear, so I put them together in one table. The SMB is calculated over November - November. The original graph gives the anomaly of the SMB. The average mass of the anomaly seems to be some 2700 Gigaton, so I added that to the anomaly. Then the discharge of the ice sheet can be calculated as the difference between the GRACE data and the SMB.
The result is interesting: there don't seem to be much correlation between SMB and discharge. Strange enough, in the last year with little sea ice the discharge was even less then normal.
An important thing could be that GRACE isn't measuring the total amount of ice, but only the amount above the sea level. So, increased calving from floating iceshelfs isn't noticed.

- It's not bad
PollutionMonster at 18:07 PM on 21 February, 2023Rob Honeycutt @412
That's an awesome example. "I don't deny the Earth has a climate." I love it! Thank you. :)
Eclectic @413
Thanks this helps me a lot.
""Denier" is a handy short label for those who are opposed to taking action for fixing the global warming problem. They themselves dislike it, and whinge greatly about the label" Eclectic
I won't visit or even mention the name of the website you mentioned. I figure it is just giving them more ad revenue. As for the part about Africa, I call what the climate change denier is doing as concern trolling. This argument also relies heavily upon climate myth #3 it is not bad.
Sometimes the denier takes the moral grandstanding route, angry, and insulted when I implied they are a climate change denier. I usually, just apologize to be nice, but sometimes I think I apologize too much. Anti-vaxxers do this too.
Caricature of a climate argument.
me: "climate change can be prevented without pitting the enviorment versus poor people. I recommend the websites skepticalscience.com and crankyuncle."
Sample denier argument: "You are calling me a climate change denier by linking to the two links above. How dare you insult me! Calling me a climate change denier is an ad hominem and dehumanizing language. You should be ashamed of yourself. I will not stand for such harassment, abusive hate speech, I am highly offended!!!"
This moral outrage type of argument can be quite difficult to stomach. More so if they catch you off guard. Let's check my message, wait what? Let alone if I show any emotion especially anger.
me: "Wow, this is tin foil hat level of conspiracy thinking gish gallop."
Climate change denier: "Enough with the attitude! I wrote twenty pages and you dismiss my claims with a single sentence. You ignore all of my claims and make no effort. What do I get in response, snark? I find this disrespectful. Nobody listens to me. How dare you! "
Pay attention to the self-pity in the above paragraph. I can practically hear them playing a violin.
With your example of Africa the climate change denier tries to peg the skeptic as a member of the cabal, the denier as a member of the army of light, and everyone else as sheeple. That's why I think #3 its not bad is such an important myth to dispel.
The idea that proponents of climate change action are cast as the villains and deniers the heroes bothers me. Taken a step further the climate change denier sometimes resorts to abusive ad hominems and even threats. Justifying their nasty remarks and threats because in their warped sense of reality they are heroes defeating a horrific villain and saving the sheeple.
I call the tactic attack the skeptic. Sometimes I get a little scared when a denier uses violent rhetoric and graphic threats. At first I thought it was funny because it was so over the top. I though he was just poeing to be funny.
Poe's Law
https://rationalwiki.org/wiki/Poe%27s_Law
Pretty scary because this has been going on since about May 2022, I though if I ignored him he would just go away.
But I guess that's pretty normal if you debunk climate myths long enough you are going to attract a tin foil hat Young Earth Creationist Christian zealot who really thinks God is on their side believes in Qanon and views the opposition as a satanic threat. How common is this?
In conclusion, I think #3 myth it is not bad is a pretty good place to focus because climate change deniers love to declare themselves the heroes and vilify anyone who pushes climate change action.
Simplest form:
Climate change action advocate: "We should do something about climate change."
Denier: "You monster! Groups x,y, and z will be harmed by your immoral and reckless actions. We should be completely passive and do nothing because climate change is good."
- It's not bad
Eclectic at 09:29 AM on 20 February, 2023PollutionMonster @409 ,
Good luck with your battle against the science-deniers. As you have noticed, they use all sorts of poor logic and see-the-tree-but-ignore-the-forest stuff. They are emotionally driven ~ as you must be, if you wish to entertain yourself by crossing swords with them in public.
Your task of course is to persuade the onlookers, not the intransigent Denialists. My humble advice is to Keep It Simple.
A/ The observed Stratospheric Cooling is a great argument : being proof that it is not The Sun causing modern global warming. And the Stratospheric Cooling was successfully predicted by "models" of 80-ish years ago.
B/ The observed sea level rise is great proof of actual global warming (Denialists try to deflect on to the gray area of "but the rise is not accelerating" or the rubbishy "it's just rebound from the Little Ice Age".) Also you can mention the coastal measurements by Kulp & Strauss [2019] showing that a 1 meter sea level rise would displace 230 million people (Denialists hate the idea of refugees & migrants).
C/ When pressed to declare what the perfect climate is ~ I state the climate of 1950 A.D. (Easy to defend.)
These sorts of arguments suit my simple brain, and are difficult to counter by sophists, bloviators & other trollish propagandists.
- Skeptical Science News: The Rebuttal Update Project
One Planet Only Forever at 04:46 AM on 20 February, 2023John Mason @8,
To be clear, I am not suggesting an end to human efforts to combat misinformation. And I am sure that constant human monitoring would be required to ensure that an AI ChatBot was as effective as possible. And human monitoring and input would also be required to identify and counteract 'novel developed attempts to impede the effectiveness of the helpful AI ChatBot'.
Thinking a little more about it, it is likely that harmful pursuers of advantage in obtaining personal benefits to the detriment of Others are already working on developing AI ChatBots for their interests.
As is often noted, there is an endless possibility for developing 'harmfully appealing misleading claims'. And the efforts to limit the harm are always too little too late.
Trying to correct harmful misunderstandigs is fighting an uphill battle. There is a profusion of harmful misleading unjustified positive impressions and unjustified anxieties and fears (negatives) that impede learning to be less harmful and more helpful to Others. The Story of the week in 2023 SkS Weekly Climate Change & Global Warming News Roundup #7 and the first 2 comments are evidence of a globally coordinated effort to oppose the interests of the future of humanity. And the Story of the Week in 2023 SkS Weekly Climate Change & Global Warming News Roundup #5 provides a detailed evaluation of the success of such efforts impeding the achievement of the Paris Agreement objective, making that achievement 'not plausible' (Limiting impacts to 1.5 C not plausible even with significant systemic transformation starting today. And limiting impacts to 2.0 C requiring significant systemic transformations starting today).
A significant systemic transformation could be one powerful ChatBot developed collaboratively by the UN (UNICEF, UNDP, UNEP, ...). That could help the 'effort to educated people' on the many matters of concern regarding the future of humanity, not just the climate impact challenge. But I would suspect very few current day powerful governments would support the effective development of something like that. They almost all have their power because of a lack of eductation of the population that gives them the power they have.
- The Problem with Percentages
PrzemStep at 08:31 AM on 18 February, 2023Hi there,
Unfortunately I'm posting because I noticed what can only be called bad trend analysis.
1. The renewable energy growth trend is simply badly done.
a) Renewable energy has four distinct components with different growth trends. Wind, solar, hydro and the rest (primarily bioenergy). Hydro and other renewables is following a linear growth trend, while wind and hydro are growing exponentially. However this exponentiality is hidden if you throw them in together: the dominant hydro represses the actual growth rates of solar/wind. This means your analysis is inherently flawed.
b) Solar is growing from 2011 to 2021 by 38,8% annually, while wind by 16,5%. Assuming hydro and other renewables continue linear growth they reach respectively 5000 TWh and 1100 TWh by 2032. By comparison if solar and wind retain 38,8% and 16,5% annual growth rates they will reach 37600 TWh and 9900 TWh respectively, so jointly renewables would have 53600 TWh by 2032. That would be the result of a proper trend analysis. Surprisingly you seem to have had a problem with percentages...
c) Now both solar and wind seem to be following more of an S-curve, so 38,8% and 16,5% growth rates seem unlikely to hold. Basic analysis of trends suggests average growth rate for 2022-2032 at 25,5% and 14% respectively, worst case scenario 20% and 11%. This average scenario would mean 26300 TWh renewable energy by 2032, while the worst case scenario 19000 TWh. As you can see all result put it much higher than your wrongly done trend analysis suggests.
2. The fossil fuel usage graph has an even simpler flaw. It suggests continued linear growth, but absolutely ignore the fact that fossil fuel usage seems to have stalled in 2018 and shown little growth. We seem to have hit peak oil consumption. IEA notes all these facts. No does this mean that fossil fuel usage will stop growing or even start falling? No. But you should have at least noted the recent stagnation of fossil fuel growth as the sudden jump from 2022 is odd to say the east.
- Skeptical Science New Research for Week #7 2023
John Hartz at 09:55 AM on 17 February, 2023By coincidence, Greta Thunberg adresses CCS head-on in a recently (yesterday) published Op-ed that I today posted a link to on the SkS Facebook Page. A key pragraph from Thunberg's Op-ed:
"Also, the carbon-removal facility in Iceland has some serious scaling up to do. Yet that is clearly not happening, which makes no sense at all. Why foster the idea that this underdeveloped technology could be a substitute for the immediate, drastic mitigation needed? Why bet our entire civilization on it without making the slightest effort to make it work? Why make the world picture a potential solution so vividly that we include it in every possible future scenario and then fail to invest in it? Could it be that it was never even meant to work at scale? That it was just being used — once again — as a way of deflecting attention and delaying any meaningful climate action so that the fossil fuel companies can continue business as usual and keep on making fantasy amounts of money for just a little while longer?"
Source: Greta Thunberg: Global leaders are dropping the ball on climate change, Op-ed by Greta Thunberg, Winston-Salem Journal, Feb 15, 2023
- 2023 SkS Weekly Climate Change & Global Warming News Roundup #5
One Planet Only Forever at 08:06 AM on 11 February, 2023EddieEvans,
Thanks for the words of encouragement in your comment @11.
I plan to continue to be 'anonymous' on the internet. As an anonymous participant I have no copyright on the thoughts I share. I am still learning from others and I am happy to have others adopt aspects of what I share as part of their learning.
I agree with your current understanding that significant social change is required to limit the harm done by misleading pursuers of personal benefit. Without that social change harm will continue to be done by pursuers of status and personal benefit. A 'technological transition' that appears to address the climate change problem could end up being like putting new wall-paper on the walls of a dwelling that is continuing to rot, be burned-out and be pest-infested, but the walls will look nicer - for a little while.
- Don’t get fooled: Electric vehicles really are better for the climate
Philippe Chantreau at 03:56 AM on 6 January, 2023I believe that this has been looked at already in details by multiple teams:
arstechnica.com/cars/2021/07/electric-cars-have-much-lower-life-cycle-emissions-new-study-confirms/
Overall impact is highly dependent on battery manufacturing processes, and the ones made in Asia have an overall higher adverse impact:
www.sciencedirect.com/science/article/abs/pii/S0048969721079493
By far the most comprehensive analysis I have seen on the subjects is that of the EEA:
https://www.eea.europa.eu/publications/electric-vehicles-from-life-cycle
From section 6.1, summary of key findings, climate change impacts: ". In general, GHG emissions associated with the raw materials and production stage of BEVs are 1.3-2 times higher than for ICEVs (Ellingsen et al., 2016; Kim et al., 2016), but this can be more than offset by lower per kilometre use stage emissions, depending on the electricity generation source (Figure 6.1). Hawkins et al. (2013) reported life cycle GHG emissions from BEVs charged using the average European electricity mix 17-21 % and 26-30 % lower than similar diesel and petrol vehicles, respectively (Figure 6.1). This is broadly in line with more recent assessments based on the average European electricity mix (e.g. Ellingsen et al., 2016, Ellingsen and Hung, 2018."
The referenced papers are available, Hawkins et al (2013) is probably a little dated but not as European specific as others cited. Neugebauer, Zebrowski and Esmer (2022) has a variety of models that show benefits in most situations. Ellingsen and Hung (2018) is more specifically focused on the European generation mix. In general, CO2 emissions favor EVs, unless the EV would replace a still operational ICE car that is driven less than 5000miles/year. This holds even for generation mixes that are heavily reliant on coal.
- Skeptical Science New Research for Week #52 2022
MA Rodger at 20:45 PM on 5 January, 2023michael sweet @4,
This document 'Global warming in the pipeline' by Hansen et al does appear to need some rewriting in my view.
It explains it is the first of a pair (the second being 'Sea Level Rise in the Pipeline') and together they are perhaps akin to Hansen et al (2016) 'Ice melt, sea level rise and superstorms: evidence from paleoclimate data, climate modeling, and modern observations that 2 °C global warming could be dangerous' which was more a discussion document than a piece of science. But given 'Global warming in the pipeline' starts off with our understanding of the greenhouse effect back in the 1800s, its audience is probably not climatologists, so not a discussion document, although it does get a bit 'detailed' in places where a good understanding of climatology is required.
At 48 pages, it covers a lot of ground and as-yet I haven't read very far through it, down to page 12 which covers the assessment of ECS. But it does read a little odd.
The Abstract tells us that "improved knowledge of glacial-to-interglacial global temperature change implies that fastfeedback equilibrium climate sensitivity is at least ~4°C for doubled CO2"
The first thing that I felt odd was reference to Hansen et al (1984) 'Climate sensitivity: analysis of feedback mechanisms' but without a sign that this was such an old paper. The tempersture rise from the LGM used to calculate the ECS in Hansen et al (1984) is said to be +3.6°C, a value said to yield ECS=2.5 to 5°C. For me, that +3.6°C temperature increase is way below that usually quoted elsewhere for the post-LGM temperature rise.
And 'Global warming in the pipeline' indeed then presents higher estimates of the temperature rise from the LGM: +6.8°C (± 0.8) in Osman et al (2021), +5.9°C (± 0.3) in Tierney et al (2020) and +5.8°C (± 0.6) for land SAT from Seltzer et al (2021).
These are in keeping with values I've seen in literature for recent decades which usually sit +5°C to 6°C, perhaps the +6.8°C (± 0.8) in Osman et al (2021) a little higher than normal while some of those lower values have also persisted.
And using such LMGR temperature increases, 'Global warming in the pipeline' then calculates ECS concluding "Thus, while the LGM-Holocene climate change implies ECS =3.3-5.1°C for 2×CO2, the PGM-Eemian implies ECS ~ 4-6°C. We conclude ECS is at least approximately 4°C and is almost surely in the range 3.5-5.5°C."
What goes unsaid is that the literature used to source LGMR the temperature rise from the LGM also developes ECS values with ECS = 2.2°C to 4.3°C in Tierney et al (2020) (Fig 4 from this paper below, the RAE accounting for 'mineral dust forcing') with Seltzer et al (2021) concurring with the central value of this, 3.4°C. For 'Global warming in the pipeline' to ignore these ECS values is entirely unscientific as we now have two values for ECS derived from LGMR which are at odds with each other.
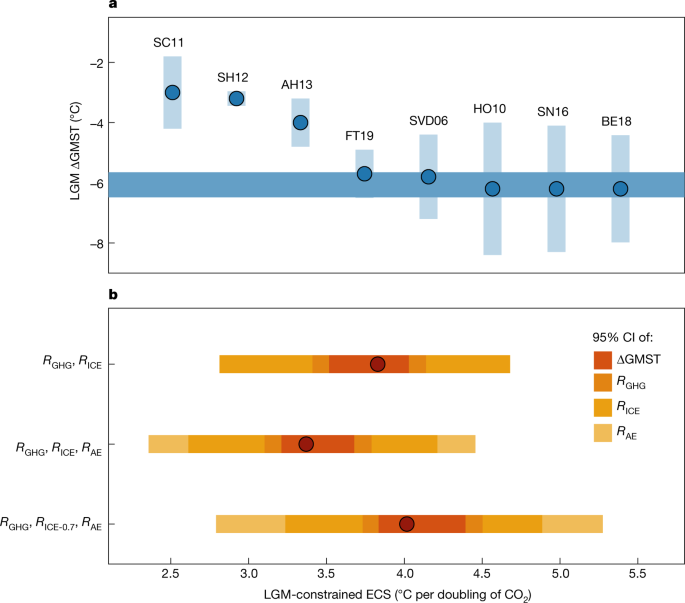
And the use of the PMG-Eemian temperature rise to calculate an ECS value is a novel and perhaps rather too adventurous as I don't know of such a use previously. 'Global warming in the pipeline' references Rohling et al (2017), a long paper which does not itself address ECS.
So that is not a good start for a work which presents such startling findings.
- Skeptical Science New Research for Week #50 2022
peterklein at 07:12 AM on 16 December, 2022I mostly became mostly aware of the climate and global warming issue about the time that Al Gore began beating the drum (even while he continued to fly globally in his private jet). Since then, I've read about climate change and climate modeling from many sources, including ones taking the position that ‘it is not a question if it is a big-time issue, but what to do about it now, ASAP?’.
In the past few weeks, it appeared to me there has been a of articles, issued reports, and federal government activity, including recently approved legislation, related to this topic. While it obviously has been one of the major global topics for the past 3+ decades, the amount of public domain ‘heightened activity’ seems (to me) to come in waves every 4-6 months. That said, I decided to write on the topic based on what I learned and observed over time from articles, research reports, and TV/newspaper interviews.
There clearly are folks, associations, formal and informal groups, and even governments on both sides of the topic (issue). I also have seen over the decades how the need for and the flow of money sometimes (many times?) taints the results of what appear to be ‘expert-driven and expert-executed’ quantitative research. For example, in medical research some of the top 5% of researchers have been found altering their data and conclusions because of the source of their research funding, peer ‘industry’ pressure and/or pressure from senior academic administrators.
Many climate and weather-related articles state that 95+% of researchers agree on major climate changes; however (at least to me) many appear to disagree on the short-medium-longer term implications and timeframes.
What I conclude (as of now)
1. This as a very complex subject about which few experts have been correct.
2. We are learning more and more every day about this subject, and most of what we learn suggests that what we thought we knew isn't really correct or at least as perfectly accurate as many believe.
3. The U.S. alone cannot solve whatever problem exists. If we want to do something constructive, build lots of nuclear power plants ASAP (more on that to follow)!
4. Any rapid reduction in the use of fossil fuels will devastate many economies, especially those like China, India, Africa and most of Asia. Interestingly, the U.S. can probably survive a 3 or 4% reduction in carbon footprint annually over the next 15 years better than almost any country in the world, but this requires the aforementioned construction of multiple nuclear electrical generating facilities. In the rest of the world, especially the developing world, their economies will crash, and famine would ensue; not a pretty picture.
5. I am NOT a reflexive “climate denier” but rather a real-time skeptic that humans will be rendered into bacon crisps sometime in the next 50, 100 or 500+ years!
6. One reason I'm not nearly as concerned as others is my belief in the concept of ‘progress’. Look at what we accomplished as a society over the last century, over the last 50, 10, 5 and 3 years (e.g., Moore’s Law is the observation that the number of transistors on integrated circuits doubles about every two years!). It is easy to conclude that we will develop better storage batteries and better, more efficient electrical grids that will reduce our carbon footprint. I'm not so sure about China, India and the developing world!
7. So, don't put me down as a climate denier even though I do not believe that the climate is rapidly deteriorating or will rapidly deteriorate as a result of CO2 upload. Part of my calm on this subject is because I have read a lot about the ‘coefficient of correlation of CO2 and global warming, and I really don't think it's that high. I won't be around to know if I was right in being relaxed on this subject, but then I have more important things to worry about (including whether the NY Yankees can beat Houston in the ACLS playoffs, assuming they meet!).
My Net/Net (As of Now!)
I am not a researcher or a scientist, and I recognize I know far less than all there is to know on this very complex topic, and I am not a ‘climate change denier’… but, after
also reading a lot of material over the years from ‘the other side’ on this topic, I conclude it is monumentally blown out of proportion relative to those claiming: ‘the sky is falling and fast’!
• Read or skim the book by Steven Koonin: Unsettled: What Climate Science Tells Us, What It Doesn't, and Why It Matters /April 27, 2021; https://www.amazon.com/Unsettled-Climate-Science-Doesnt-Matters/dp/1950665798
• Google ‘satellite measures of temperature’; also, very revealing… see one attachment as an example.
• Look at what is happening in the Netherlands and Sri Lanka! Adherence to UN and ESG mandates are starving countries; and it appears Canada is about to go over the edge!
• None of the climate models are accurate for a whole range of reasons; the most accurate oddly enough is the Russian model but that one is even wrong by orders of magnitude!
• My absolute favorite fact is that based on data from our own governmental observation satellites: the oceans have been rising over the last 15 years at the astonishing rate of 1/8th of an inch annually; and my elementary mathematics suggests that if this rate continues, the sea will rise by an inch sometime around 2030 and by a foot in the year 2118… so, no need to buy a lifeboat if you live in Miami, Manhattan, Boston, Los Angeles, or San Francisco!
• Attached is a recent article and a Research Report summary.
Probably the most damning is the Research Report comparison of the climate model predictions from 2000, pointing to 2020 versus the actual increase in temperature that has taken place in that timeframe (Pages 9-13). It's tough going and I suggest you just read the yellow areas on Page 9 (the Abstract and Introduction, very short) and the 2 Conclusions on Page 12. But the point is someone is going to the trouble to actually analyze this data on global warming coefficients!
My Observations and Thinking
In the 1970s Time Magazine ran a cover story about our entering a new Ice Age. Sometime in the early 1990s, I recall a climate scientist sounding the first warning about global warming and the potentially disastrous consequences. He specifically predicted high temperatures and massive floods in the early 2000’s. Of course, that did not occur; however, others picked up on his concern and began to drive it forward, with Al Gore being one of the primary voices of climate concern. He often cited the work in the 1990’s of a climate scientist at Penn State University who predicted a rapid increase in temperature, supposedly occurring in 2010 and, of course, this also did not occur.
Nonetheless many scientists from various disciplines also began to warn about global warming starting in the early 2000’s. It was this growing body of ‘scientific’ concern that stimulated Al Gore's concern and his subsequent movie. It would be useful for you to go back to that and review the apocalyptic pronouncements from that time; most of which predicted dire consequences, high temperatures, massive flooding, etc. which were to occur in 10 or 12 years, certainly by 2020. None of this even closely occurred to the extent they predicted.
That said, I was still generally aware of the calamities predicted by a large and diverse body of global researchers and scientists, even though their specific predictions did not take place in the time frame or to the extent that they predicted. As a result, I become a ‘very casual student’ of climate modeling.
Over the past 15 years climate modeling has become a popular practice in universities, think-tanks and governmental organizations around the globe. Similar to medical and other research (e.g., think-tanks, etc.) I recognized that some of the work may have been driven by folks looking for grants and money to keep them and their staff busy.
A climate model is basically a multi-variate model in which the dependent variable is global temperature. All of these models try to identify the independent variables which drive change in global temperature. These independent variables range from parts per million of carbon dioxide in the atmosphere to sunspot activity, the distance of the earth from the sun, ocean temperatures, cloud cover, etc. The challenge of a multi-variant model is first to identify all of the various independent variables affecting the climate and then to estimate the percent contribution to global warming made by a change in any of these independent variables. For example, what would be the coefficient of correlation for an increase in carbon dioxide parts per million to global warming?
You might find that an interesting cocktail party question to ask your friends “what is the coefficient of correlation between the increase in carbon dioxide parts per million and the effect on global warming?” I would be shocked if any of them even understood what you were saying and flabbergasted if they could give you an intelligent answer! There are dozens of these climate models. You might be surprised that none of them has been particularly accurate if we go back 12 years to 2010, for example, and look at the prediction that the models made for global warming in ten years, by 2020, and how accurate any given model would be.
An enterprising scientist did go back and collected the predictions from a score of climate models and found that a model by scientists from Moscow University was actually closer to being accurate than any of the other models. But the point is none were accurate! They all were wrong on the high side, dramatically over predicting the actual temperature in 2020. Part of the problem was that in several of those years, there was no increase in the global temperature at all. This caused great consternation among global warming believers and the scientific community!
A particularly interesting metric relates to the rise in the level of the ocean. Several different departments in the U.S. government actually measures this important number. You might be surprised to know, as stated earlier, that over the past 15 or so years the oceans have risen at the dramatic rate of 1/8th of an inch annually. This means that if the oceans continued to rise at that level, we would see a rise of an inch in about 8 years, sometime around 2030, and a rise of a foot sometime around the year 2118. I suspect Barack Obama had seen this data and that's why he was comfortable in buying an oceanfront estate on Martha's Vineyard when his presidency ended!
The ‘Milankovitch Theory’ (a Serbian astrophysicist Milutin Milankovitch, after whom the Milankovitch Climate Theory is named, proposed about how the seasonal and latitudinal variations of solar radiation that hit the earth in different and at different times have the greatest impact on earth's changing climate patterns) states that as the earth proceeds on its orbit, and as the axis shifts, the earth warms and cools depending on where it is relative to the sun over a 100,000-year, and 40,000-year cycle. Milankovitch cycles are involved in long-term changes to Earth's climate as the cycles operate over timescales of tens of thousands or hundreds of thousands of years.
So, consider this: we did not suddenly get a lot more CO2 in the atmosphere this year than we had in 2019 (or other years!), but maybe the planet has shifted slightly as the Milankovitch Theory states, and is now a little closer to the sun, which is why we have the massive drought. Nothing man has done would suddenly make the drought so severe, but a shift in the axis or orbit bringing the planet a bit closer to the sun would. It just seems logical to me. NASA publicly says that the theory is accurate, so it seems that is the real cause; but the press and politicians will claim it is all man caused! You can shut down all oil production and junk all the vehicles, and it will not matter per the Theory! Before the mid-1800’s there were no factories or cars, but the earth cooled and warmed, glaciers formed and melted, and droughts and massive floods happened. The public is up against the education industrial complex of immense corruption!
In the various and universally wrong ‘climate models’, one of the ‘independent’ variables is similar to the Milankovitch Theory. Unfortunately, it is not to the advantage of the climate cabal to admit this or more importantly give it the importance it probably deserves.
People who are concerned about the climate often cite an ‘increase in forest fires, hurricanes, heat waves, etc. as proof of global warming’. And many climate deniers point out that most forest fires are proven to be caused by careless humans tossing cigarettes into a pile of leaves or leaving their campfire unattended, and that there has been a dramatic decrease globally on deaths caused by various climate factors. I often read from climate alarmists (journalists, politicians, friends, etc.), what I believe are ‘knee-jerk’ responses since they are not supported by meaningful and relevant data/facts, see typical comments below:
• “The skeptical climate change deniers remind me of the doctors hired by the tobacco industry to refute the charges by the lung cancer physicians that tobacco smoke causes lung cancer. The planet is experiencing unprecedented extreme climate events: droughts, fires, floods etc. and the once in 500-year catastrophic climate event seems to be happening every other year. Slow motion disasters are very difficult to deal with politically. When a 200-mph hurricane hits the east coast and causes a trillion dollars in losses then will deal with it and then climate deniers will throw in the towel!”
These above comments may be right, but to date the forecasts on timing implications across all the models are wrong! It just ‘may be’ in 3, 10 or 50 years… or in 500-5000+ before the ‘sky is falling’ devastating events directly linked to climate occur. If some of the forecasts, models were even close to accuracy to date I would feel differently.
I do not deny there are climate related changes I just don’t see any evidence their impact is anywhere near the professional researchers’ forecasts/models on their impact as well as being ‘off the charts’ different than has happened in the past 100-1000+ years.
But a larger question is “suppose various anthropogenetic actions (e.g., chiefly environmental pollution and pollutants originating in human activity like anthropogenic emissions of sulfur dioxide) are causing global warming?”. What are they, who is doing it, and what do we do about it? The first thing one must do is recognize that this is a global problem and that therefore the actions of any one country has an effect on the overall climate depending upon its population and actions. Many in the United States focus intensely upon reducing carbon emissions in the U.S. when of course the U.S. is only 5% of the world population. We are however responsible for a disproportionate part of the global carbon footprint; we contribute about 12%. The good news is that the U.S. has dramatically reduced its share of the global carbon footprint over the past 20 years and doing so while dramatically increasing our GDP (up until the 1st Half of 2022).
Many factors have contributed to the relative reduction of the U.S. carbon footprint. Chief among these are much more efficient automobiles and the switch from coal-driven electric generation plants to those driven by natural gas, a much cleaner fossil fuel.
While the U.S. is reducing its carbon footprint more than any other country in the world, China has dramatically increased its carbon footprint and now contributes about 30% of the carbon expelled into the atmosphere. China is also building 100 coal-fired plants!
Additional facts, verified by multiple sources including SNOPES, the U.,S. government, engineering firms, etc.:
• No big signatories to the Paris Accord are now complying; the U.S. is out-performing all of them.
• EU is building 28 new coal plants; Germany gets 40% of its power from 84 coal plants; Turkey is building 93 new coal plants, India 446, South Korea 26, Japan 45, China has 2363 coal plants and is building 1174 new ones; the U.S. has 15 and is building no new ones and will close about 15 coal plants.
• Real cost example: Windmills need power plants run on gas for backup; building one windmill needs 1100 tons of concrete & rebar, 370 tons of steel, 1000 lbs of mined minerals (e.g., rare earths, iron and copper) + very long transmission lines (lots of copper & rubber covering for those) + many transmission towers… rare earths come from the Uighur areas of China (who use slave labor), cobalt comes from places using child labor and use lots of oil to run required rock crushers... all to build one windmill! One windmill also has a back-up, inefficient, partially running, gas-powered generating plant to keep the grid functioning! To make enough power to really matter, we need millions of acres of land & water, filled with windmills which consume habitats & generate light distortions and some noise, which can create health issues for humans and animals living near a windmill (this leaves out thousands of dead eagles and other birds).
• So, if we want to decrease the carbon footprint on the assumption that this is what is driving the rise in the sea levels (see POV that sea levels are not rising at: www.tiktok.com/t/ZTRChoNTg) and any increase in global temperature, we need to figure out how to convince China, India and the rest of the world from fouling the air with fossil fuels. In fact, if the U.S. wanted to dramatically reduce its own carbon footprint, we would immediately begin building 30 new nuclear electrical generating plants around the country! France produces about 85% of its electrical power from its nuclear-driven generators. Separately, but related, do your own homework on fossil fuels (e.g., oil) versus electric; especially on the big-time move to electric and hybrid vehicles. Engineering analyses show you need to drive an electric car about 22 years (a hybrid car about 15-18 years) to breakeven on the savings versus the cost involved in using fossil fuels needed to manufacture, distribute and maintain an electric car! Also, see page 14 on the availability inside the U.S. of oil to offset what the U.S. purchases from the middle east and elsewhere, without building the Keystone pipeline from Canada.
Two 4-5-minute videos* on the climate change/C02/new green deal issue, in my opinion, should be required viewing in every high school and college; minimally because it provides perspective and data on the ‘other’ side of the issue while the public gets bombarded almost daily by the ‘sky is falling now or soon’ side on climate change!
* https://www.prageru.com/video/is-there-really-a-climate-emergency and
https://www.prageru.com/video/climate-change-whats-so-alarming - SkS Analogy 9 - The greenhouse effect is a stack of blankets
Charlie_Brown at 07:27 AM on 20 November, 2022The blanket analogy is fine for those who are not familiar with radiant energy transfer. For those who do know a little about it (think night vision goggles), there are other analogies that could be used that are not based on thermal conduction heat transfer. 1) Smudge pots used in fruit orchards on cold, clear nights. Increasing CO2 would be akin to thickening the smoke layer. 2) The effect of cloud cover on cold, but otherwise clear, nights. Similarly, increasing CO2 would be akin to thin clouds vs. thicker clouds. 3) Mylar space blankets instead of fabric blankets. Increasing CO2 would be akin to filling in holes changing the material to reduce the emissivity. There are weaknesses in the analogies, but they can help to convey the message about global warming. Resolving the weaknesses can be educational. A technical description necessarily involves emissivity as a function of wavelength. The Advanced description in “Is The CO2 Effect Saturated” is excellent. The Basic description also is very good because it includes the critical effect of cold temperature at high altitude with a very nice graphic image. The 27 pages of 668 comments are tedious to work through because they contain a lot of misinformation mixed in with some very good information, and it takes quite a bit of critical thinking to sort through what is accurate and important. I will post my additional comment there, at risk of making repetitive points and being lost in the mix.
- Don’t get fooled: Electric vehicles really are better for the climate
Doug Bostrom at 10:21 AM on 18 November, 2022Per Eddie's remarks, we have an EV that does the vast bulk of our mileage. It can handle dimensional items up to 118" (~3m) with the hatch closed and can comfortably do a 190 mile (305km) roundtrip I routinely need to cover, in winter, mostly at 70mph (112kph) and without the driver freezing, w/~40 miles (64km) reserve range on returning to driveway. And it's a delight to drive, makes me feel a little bit too much like I'm 16 years of age again. So lots of bullet points covered there.
For other needs we have a 1997 Ford Ranger. It goes through about 40 gallons of gas per year, at about 25MPG (10km/l) for above trip case. I've not done the math, but I suspect the current embodied carbon in replacing it with the most plausible EPU candidate (Ford F150 Lightning) may be problematic; the choice would not necessarily be a win over the geriatric Ranger.
There are two other problems.
For us, $40k is not a dealbreaker. But as a practical matter and in the context where a lot of PUs are used (think solo operators running a yard care concern, etc.) that's a huge lift, essentially impossible.
But here's another dealbreaker: none of the current EPUs will hold a 6' (1.8m) dimensional item in the bed with the gate closed, the lowest bar of legitimate PU cargo specs*. All of them are centered as designer accessories first, tool second. This is like having to use a tack hammer where one needs a framing hammer, or (given the toy-like nature of such an implementation) a kid's plastic hammer instead of the real deal. And that's a shame, because for the legitimate use case of many PUs, EPUs otherwise offer distinct advantages, and have range more than ample for a typical day's work.
Eventually this will get sorted and we'll probably even see -proper- EPU models with what used to be the correct treatment: an 8' (2.4m) bed. But right now, conflicted objectives, still catering to urban cowboys having PUs with no scratches or dirt in the bed. A lot of cost and a lot of dead weight are concentrated on useless appurtenances, things that are completely irrelevant to the original use case of PUs, hardware as psychological reassurance, ending up with the worst possible analogy to designer handbag.
All that said, the more EVs, the better for the planet, with the stipulation that fewer vehicle miles of all kinds are also going to be necessary. We're habituated to automobiles, but in truth if we can't feed or house ourselves with jumping into a car, our "convenience" item is substantially a prosthetic device, a very large and inefficient wheel chair.
*"just leave the gate open" isn't responsive to how that actually unpacks in practice. As usual, "just" is way too economical.
- 2022 SkS Weekly Climate Change & Global Warming News Roundup #42
nigelj at 11:04 AM on 29 October, 2022scvblwxq1.
Your solar theory of the recent warming period since the 1970's is wrong. There is only a very poor correlation between surface warming and solar irradiance over the last 50 years. Solar irradiance increased early last century until about 1960, then levelled off or fell slightly for about 30 years, then fell sharply from about 30 years ago to presently, but warming steadily increasing over that same total 50 year time frame. So you have a poor level of correlation.
skepticalscience.com/solar-activity-sunspots-global-warming.htm
If global warming over the last 50 years was being caused by fluctuations in solar activity, you would expect a near perfect correlation between solar activity and warming over that 50 years, because the effects of solar irradiance on surface temperatures are reasonably instantaneous. Instead we see a very low level of correlation if any.
Fluctuations in solar irradiance over the last 50 years have also been quite small in terms of WM2, and not enough to account for the quantity of warming measured. So nothing in the way of causation.
With the climate issue the devil is in the detail like this. The fact that solar irradiance is generally a bit higher than 100 years ago doesn't explain the recent warming trend when you look into the details. Thats why we have climate scientists to look at the details.
The grand solar minimum during the little ice age is suspected of contributing to that cool period, but the little ice age only affected part of the northern hemisphere, temperatures dropped only about a degree c and over hundreds of years. So a similar thing now would clearly do very little if anything to offset the predicted 3 - 5 degrees of warming this century and 8 degrees of warming over 2 - 3 centuries. A grand solar minimum, If it actually happens, is clearly not going to save use.
- No, a cherry-picked analysis doesn’t demonstrate that we’re not in a climate crisis
Bob Loblaw at 23:38 PM on 9 October, 2022Eric. Thank you for the updated links.
In your second link, which allows searching for stations, the top title is a link to this web page that give an indication of the instrumentation that is used to collect this data. On that page we see (emphasis added):
The Cooperative Observer Program (COOP) Hourly Precipitation Data (HPD) consists of quality controlled precipitation amounts, which are measurements of hourly accumulation of precipitation, including rain and snow for approximately 2,000 observing stations around the country, and several U.S. territories in the Caribbean and Pacific from the National Weather Service (NWS) Fischer-Porter Network.
The Fischer-Porter is a weighing-type automated precipitation gauge. You can read a little bit about it here. Old data will have been on the paper coded tapes described in that link, but a lot of more recent data (last 30 years) will have been "modified for remote transmission" (interpretation: modified for electronic readouts).
Weighing gauges in general are poor at determining small amounts of precipitation over short intervals. The noise characteristics are not good. The gauge just tells you "this is how much weight I have now", and you need to process that into a change in weight over time to determine precipitation amounts. That can be done externally using the raw weights, but modern gauges may have internal electronics that will do the processing - for better or for worse. You have a classic "signal to noise" ratio problem with small changes.
Weighing gauges should be more reliable for heavier rainfall amounts, but they are still a limiting technology. There are many other brands of weighing gauges, too - Geonor, Pluvio and Pluvio2 are ones that I have worked with. They are generally better at cumulative rainfall estimates over longer periods of time. (One of their advantages is that they collect snow as well as rain.)
Short term rainfall intensity data are more commonly collected using tipping bucket technology, which can provide one-minute rainfall intensity data. Tipping buckets have problems at high rainfall rates, and are not so good for long-term cumulative amounts, so many automated stations (virtually all at Canadian automated stations) will have both types.
Intensity-Duration-Frequency curves are a standard part of precipitation analysis. They are needed for engineering design (drainage design) and are useful for many hydrological and ecological purposes. You can read more about the Canadian methodology and results by following the links on this page.
Any precipitation gauge will have issues with "capture efficiency" at high winds. Winds cause turbulence around the gauge, which general causes the gauge to under-collect. Much more important for snow, but still a factor with rain. Most automated weighing gauges will be installed with some sort of wind shield to help with this. Tipping buckets are usualy mounted close to the surface, where wind is less of a factor. Getting data that have been adjusted for wind capture efficiency is often very difficult.
Changes in instrumentation (which automated gauge, what wind shielding, how the data are processed) will be inportant in looking at trends.
And none of that helps much with the problems of localized storms passing between recording stations.
- A critical review of Steven Koonin’s ‘Unsettled’
michael sweet at 01:24 AM on 11 September, 2022dvaytw:
You list two items where you think Koonan was correct and climate scientists are incorrect:
1) "The economic impacts of climate change will be minimal to the end of this century". Tell that to Pakistan which has suffered $30 billion of damage from the worst flooding recorded. Record flooding is occuring around the world. There are billions of dollars damage in the USA alone from forrest fires, and those fires are happening around the entire globe. The damage suffered yearly now are severe, we don't need to wait untill the end of the centuary.
2) "Use of fossil fuels is the only real means by which developing countries can achieve parity". Perhaps you have not noticed but a shortage of fossil fuels are currenly causing economic pain across the world. Countries that have invested in renewable energy are doing great! Renewable energy is the cheapest energy all around the world now and is cheaper every year. Meanwhile fossil fuels get more expensive every year since all the cheap fossil fuel was mined years ago. Do you want to condem developing nations to expensive, polluting energy that they will have to replace as soon as it is built with cheaper renewable energy? I note that in developed countries little new fossil fuel generators are being built, virtually all new installations for new energy are renewable. In addition, distributed solar can be installed immediately virtually everywhere while central fossil generation requires expensive transmission systems that do not exist in developing countries.
Your arguments were false ten years ago and are absurd now. Read more and get up to date.
- A critical review of Steven Koonin’s ‘Unsettled’
Eclectic at 18:15 PM on 10 September, 2022Dvaytw @21 : my 2 cents on that August 2022 debate :-
Two questions.
A/ What is "minimal" impact? To use those cliches Global North and Global South . . . the North has considerable fat on its waistline. For instance, in the USA the wealth of the socioeconomic top 1% is approx 40 trillion USD ~ so the nation could comfortably manage to deal with a plus/minus 10% economic impact over the course of the next eighty-ish years.
# But for the South, things like the [presentday] disastrous Pakistan flooding/ other droughts floods heatwaves and increasing sea-level rise (over the coming 100 years & beyond) . . . are heading in the direction of cumulating catastrophe, which will fall most heavily on the South. Quite possibly the total global GNP's will continue to increase [to the applause of economists] ~ but that would provide little comfort against a vast scale of human misery. So shame on Koonin, if that is his line of "economic impact" argument.
B/ What do the people of the so-called developing countries actually need over the next 100 years? First answer is : food/ shelter/ education/ freedom from oppression, and so on. Parity, in the sense of a widescreen television etcetera would be nice, but it is a long way down the immediate wish list, I'm sure. Neither the food nor the TV will be produced by a large ramping-up of fossil fuel usage. Much reform (and careful international aid) is needed ~ but Koonin is absurd if he opines that Nigeria will necessarily benefit from more oil production or Congo Republic benefit from more cobalt production.
If Koonin thinks that more fossil fuel usage will not cause an overall digging-deeper of the present "hole" for global conditions, then he is being disingenuous (for the sake of quickie debate points).
# Third question . . . is the Koonin/Dessler debate worth viewing? Dvaytw, if the two points you mention are the best/strongest that Koonin can do, then their debate sure ain't worth viewing.
- What’s going on with the Greenland ice sheet?
MA Rodger at 23:09 PM on 3 September, 2022Wayne @4,
I was in two minds on continuing our interchange, but I decided I would continue when I came across coverage of the paper underlying this SkS OP which surprisingly appeared today on the pages of my local rag with the title "Zombie ice to raise global sea level". On-line I see the same story getting into newspapers elsewhere (eg The Washigton Post).
In terms of an SLR-CO2 correlations, I don't recall seeing Hansen provide it. I believe the closest he got was in Hansen et al (2013) 'Climate sensitivity, sea level and atmospheric carbon dioxide' (with its well-used Fig 1) which looked at temperature & SLR but only inferred CO2 levels with very cursory checks to actual CO2 reconstructions.

And for me, Hansen's 5m SLR by 2100 was always a bit of theorising that I struggled with. Even after it appeared properly written up in Hansen et al (2016), which at least answered the energy equations that were my initial objection to such a large SLR projections, for me it still remains more 'discussion document' than a full-blooded argued case. In my view, worrying as it is, the future SLR from Greenland & Antarctica depends on the Precipitation minus Ice-Loss balances and that puts us in the hands of climatologists for the precipitaion and glaciologists for the ice-loss. The application of paleoclimatology and whether Greenland melted out in the Eemian isn't so relevant for our future SLR.
Just to throw in my other SLR bug bear which also becomes relevant here, I've always reckoned SLR ain't gonna stop at 2100. So why do we go on so long about the 2100 SLR when by 2150, 2200, 2300 etc it's going to be seriously bigger? (A total of 2.3m SLR/ºC AGW according to IPCC AR5 fig13.14.)
The SLR-ΔCO2 relationship is of course a paleoclimate thing, so may not be immediately relevant outside the Eemian or now we have a Panama Isthmus connecting N&S America. That said, the SLR-ΔCO2 relationship is usually a step beyond what most graphics provide, but fig 6 of Rea et al (2021) 'Atmospheric CO2 over the Past 66 Million Years from Marine Archives' does provide us a ΔT-SLR-ΔCO2 graphic. Note that they do not attempt to be definitive with this CO2 reconstruction, saying "While each method has uncertainties, these are largely independent, so their broad convergence on similar CO2 histories is encouraging."
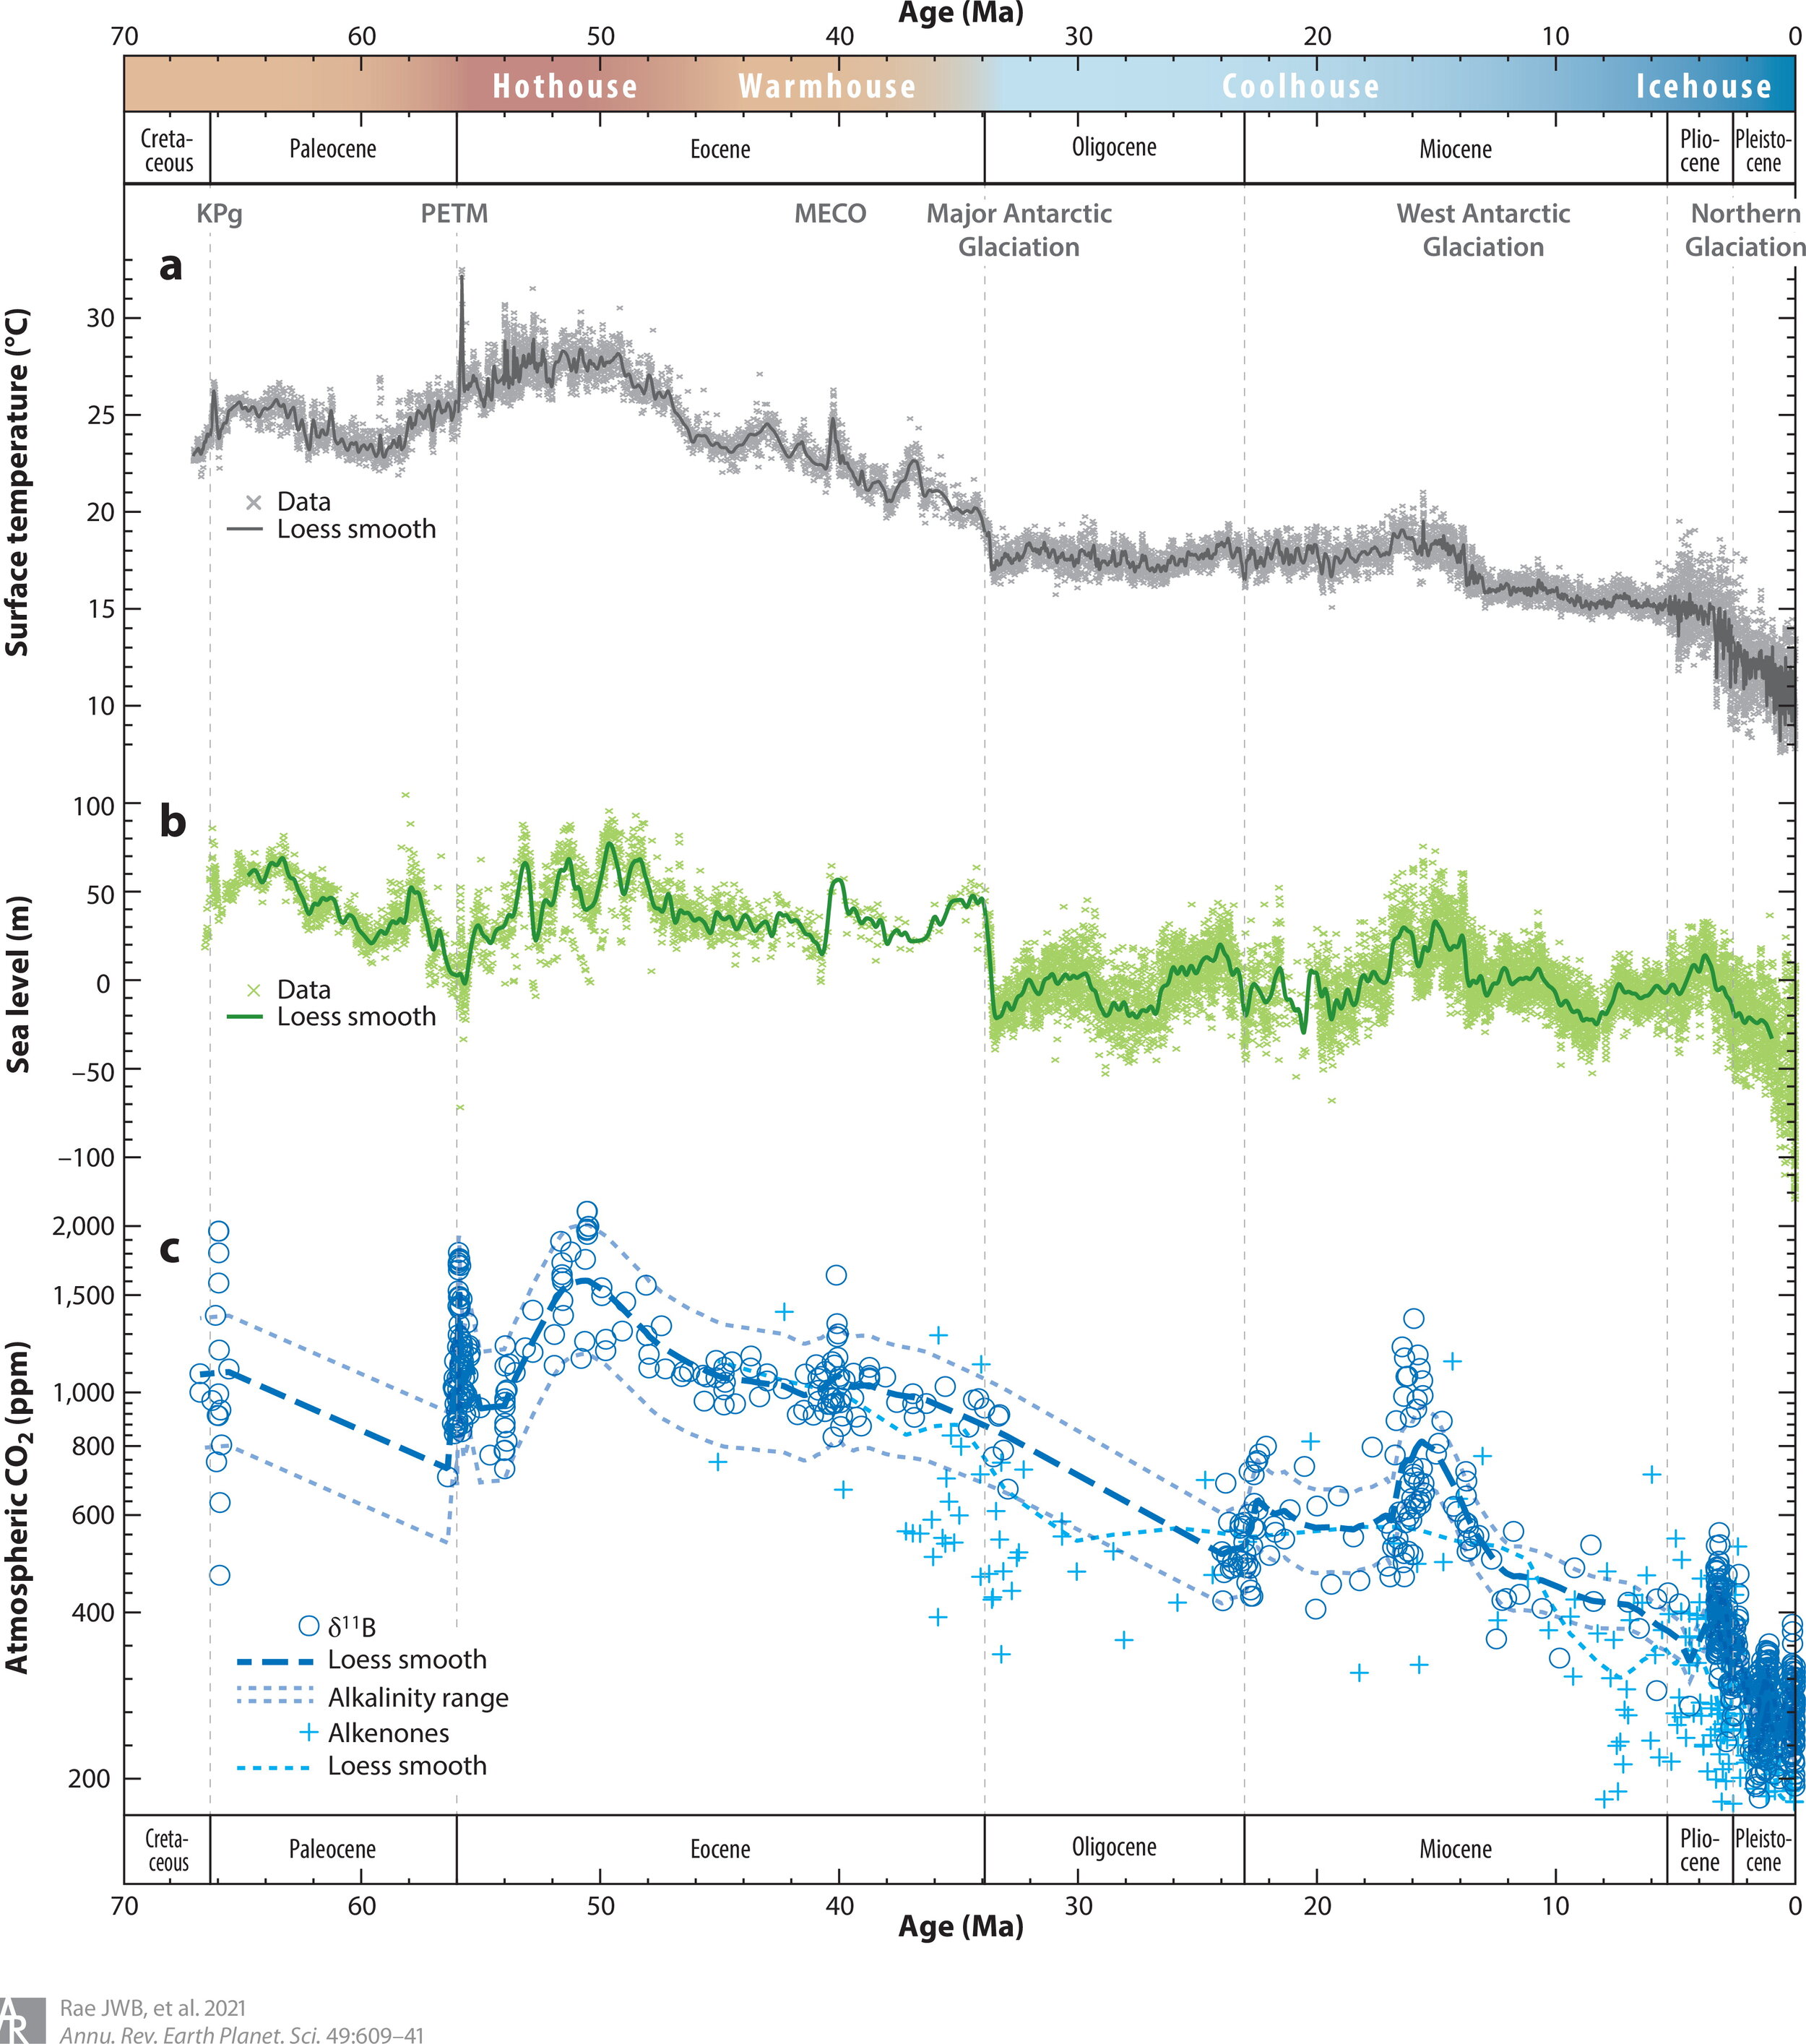
But I stress the idea that paleoclimate stuff should concede precedence to glaciology when it comes to the melting ice caps today and glaciology is where the paper underlying the SkS OP above comes from, Box et al (2022) 'Greenland ice sheet climate disequilibrium and committed sea-level rise'. I read that paper as saying that, as of now (2000-19), Greenland is not tipped over into melt-out mode (which I think was always seen as requiring a little more AGW to do that tipping, but nonetheless is good news to hear said) and that the Greenland melt which we are committed-to will happen in the next several decades, not several centuries, and will be mainly over by 2100.
So at least for Greenland under the AGW so-far, my bug bear (that we are in denial ignoring massive SLR awaiting us post-2100) is assuaged.
Mind, the SLR thus awaiting from Greenland isn't trivial. And there is still Antarctica. And not forgetting we still have the tiny task of halting future AGW.
- Science: What it is, how it works, and why it matters
Bob Loblaw at 10:22 AM on 2 September, 2022Thanks, Baerbel, for that information on arXiv. It indeed seems to be simply a place for people to upload papers with little regard to quality. They may or may not be papers that are submitted elsewhere. Calling something a "publication" because one puts a copy on arXiv is hubris at the extreme.
On their "About" page, arXiv states the following (emphasis mine):
Material is not peer-reviewed by arXiv - the contents of arXiv submissions are wholly the responsibility of the submitter and are presented “as is” without any warranty or guarantee. By hosting works and other materials on this site, arXiv, Cornell University, and their agents do not in any way convey implied approval of the assumptions, methods, results, or conclusions of the work.
The main arXiv page actually has a warning related to Covid-19 submissions (again, emphasis mine):
Important: e-prints posted on arXiv are not peer-reviewed by arXiv; they should not be relied upon without context to guide clinical practice or health-related behavior and should not be reported in news media as established information without consulting multiple experts in the field.
I agree with MA Rodger's initial evaluation of the merit of these "publications" - not worth the time to look at.
- How not to solve the climate change problem
Bob Loblaw at 04:50 AM on 25 August, 2022scvblwxq1:
Yes we know that solar output has been decreasing. But this purported "cooling" just isn't happening, Things are warming up, instead. Maybe there is some other factor involved?
If you think we're heading towards another glacial period (within the current ice age), you're worrying about something that would not happen until the distant future.
If you think that warming is going to be good for us, you need to think again.
Please take discussions of these arguments to the appropriate thread, as indicated by the links I have provided.
- There's no tropospheric hot spot
MA Rodger at 19:23 PM on 23 August, 2022Cedders @33,
And having had a read of that PDF...
Cedders @33,
Having examined the PDF (16 pages not 24), it is quite evident that it is a pile of utter nonsense, a "welcome to the lunatic asylum" message and not anything in any way scientifically-based.
The author is Piers Corbyn, a well-kown denialist and an elder brother of Jeremy Corbyn (a long-serving left-wing Labour MP who bizarrely gained the heady position of Leader of the Labour Party for 4½ years).
Piers Corbyn is described in Wikithing as "an English weather forecaster, businessman, anti-vaxxer and conspiracy theorist" and does feature here at SkS being (1) Cited within a spot of denialism of 2015 in the Daily Express tabloid/comic, (2) The main source of a pile of climate nonsense of 2013 from the then Mayor of London Alexander Boris von Pfiffle Johnson, a man now renowned throughout the known world for not being particularly truthful, (3) Listed here at SkS as a denialsit with zero peer-reviewed writings.
The 16 page thesis linked up-thread @33 is a 2019 thesis presented to the Reading University Debating Journal and sitting at the top of a list of 24 such theses posted 2018-19, top of the list because it is the most recent (the journal lasted less than a year), a list which addresses such important topics as 'Why Self-Service Checkouts are the Invention of the Devil' and 'The Great University of Reading Catering Con: Man Shall Not Live off Sandwiches Alone' and an anonymous piece 'Why I Support the Conservatives: The Most Successful Party in British History'.
The Piers Corbyn thesis begins by citing David Legates' dismissal of the 97% AGW consensus before dismissing that because "it is about facts; and no Global-Warming Inquisition is going to prevent me exposing their nonsensical theories."
Corbyn then kicks off by asserting anthropogenic CO2 comprises 4% of atmospheric CO2 (thus confusing FF carbon with naturally-cycled carbon) and that CO2 is not the main controller of global temperature (here presenting a graphic which confuses the US temperature with global temperature - shown below in this comment).
A further assertion is then presented, that CO2 is the result of warming oceans with six references/notes provided in support which seem to all point back to crazy denialist Murry Salby.
So, a la Salby, the present rise in CO2 is claimed to result from the good old Medieval Warm Period. A graphic is presented comparing a denialist 1,000y temperature record (based on the schematic FAR Fig 7c) with the much-confirmed scientifically-based Hockey Stick graph.
This brings us to the halfway page of Corbyn's denialist rant.
The thesis continues with pageful of misunderstanding of how the GH-effect works, ending with accusations that this misunderstood 'theory' breaks the 2nd Law of Thermodynamics (or it does if you misinterpret the 2nd Law of Thermodynamics).
Happily, this misunderstanding is considered to be not supported by "better scientists" who consider the lapse rate. And this indeed is a 'better' consideration. But here Corbyn perhaps confuses the tropical 'hot spot' (which is caused by increased tropical rainfall transporting more latent up into the troposphere) with some CO2 effect. (The 'hot spot' results from a warmer tropics and not per se any enhanced GH-effect.) And he fails to address the reasons why there is difficulty detecting this tropical 'hot spot'. Indeed he brands it as a 'coldspot' that he seems to say is caused by "more CO2 & other GHGs" which cause a diurnal fluctuation in the IR "heat-exit height" to become greater and, due to the 4th-power in the SB equation, this causes cooling. Whether such a phenomenon extends beyond the tropics (thus globally more-than negating the 'hot spot') is not properly explained but, due to the lapse rate this phenomenon can apparently also negate "the original expected surface warming."
A first graphic box is presented with three unsubstantiated bullet points explaining "Why CO2 theory does not work" alongside two similar "apart from"s.
A second graphic box also titled "Why CO2 theory does not work" states:-
In the real atmosphere there are day/night temperature fluctuations (eg in upper atmosphere). They are larger with more CO₂ because CO₂ (infra red absorber / emitter) gains & loses heat easier than N₂ & O₂ and so enables all the air to adjust quicker.
This is a fundamentally different explanation from the previous fluctuation in IR "heat-exit height" explanation described earlier, and it is still wrong.
(A packet of air with X concentrations of CO2 will both emit and absorb an IR photons of quantity P. With absorb=emit, it is thus in equilibrium. Add CO2 so the concentration is doubled to 2X, and the emitting photons will double to 2P and the absorbed photons will also double to 2P so absorb=emit and the same equilibrium is maintained. The main result is that twice the level if IR emission has half the pathlength before absorption so at any point the IR flux remains unchanged. And CO2 does not "gain & lose heat easier than N₂ & O₂" when it remains thermally coupled to the N₂ & O₂. )
The remainder of this second graphic box on PDF page 9 is a little too confused to rebut with any confidence. A diurnal range of "about 5 or 6 deg" is given which is apparently a temperature range yet whatever “deg” means (presumably Kelvin), the bulk of the troposphere has a far smaller diurnal range than even 5ºF. The mechanism for the enhanced cooling from the "heat-exit height" is presented as due to a fluctuating temperature losing more heat (by radiating IR) than a constant temperature (which is true). A rather dodgy-looking equation is followed by the note "Detail subject under research" but no reference is given and three-years-on there is no sign of such "research."
And a third graphic box is shown on the next page also titled "Why CO2 theory does not work," this third such graphic mainly presenting a pair of images from Australian denialist David M. W. Evans who has his own SkS page of climate misinformation.
The thesis then turns to the proposition that it is not CO2 but solar forces that "rules climate temperature" with the dotted line on the graphic below described as such a ruling influence. It apparently shows how the "9.3yr lunar-nodal crossing & the full 22yr solar magnetic cycle" allegedly shift the jet stream and "many circulation patterns." The graphic's 60-yr periodicity is less than convincing,being fitted to US rather than global temperature which, when extended beyond the 1895-2008 period shows itself to be simple curve-fitting (eg the Berkeley Earth US temperature record 1820-2020 does not show it, even to a blind man). The graphic was presented by Corbyn at the Heartland Institute's 2009 conflab in NY in which Corbyn [audio] insists other findings demonstrate “something is going on” but why it is this graphic being reused in this 2019 thesis is not clear – perhaps the forecast of world temperature dropping to 1970s levels by 2030 is too evident on other slides he used in that Heartland presentation.
To support his thesis Corbyn mentions an alleged cover-up by the likes of the BBC in reporting only global warming when the 'true' data shows cooling, the reported support for all this Piers Corbyn craziness from oil companies who shy away only because they want to use AGW to "make higher profits" and how these AGW-inspired mitigation agendas are already directly responsible for needlessly killing "millions" annually.
The thesis ends with a challenge:-
It is for this reason that I, Piers Corbyn, challenge whoever is willing in Reading University or other appropriate institutions to a debate on the failed Global warming scam vs evidence-based science.
So I interpret the thesis as a "welcome to the lunatic asylum" message from Piers Corbyn.
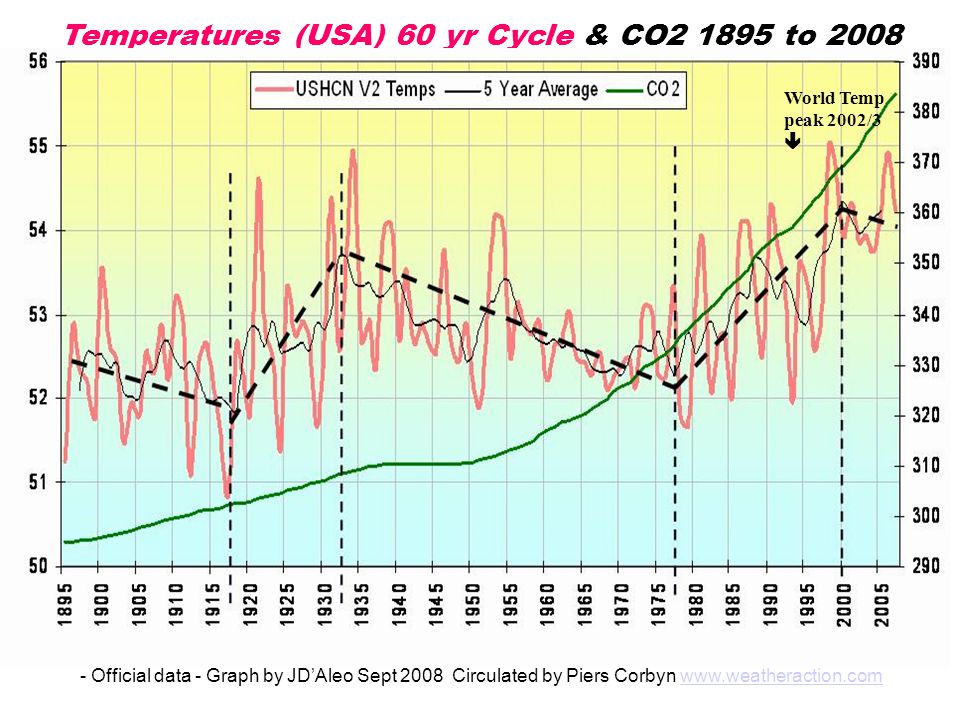
- Skeptical Science New Research for Week #32 2022
One Planet Only Forever at 02:36 AM on 13 August, 2022The study “Estimating the environmental impacts of 57,000 food products” adds to awareness and understanding helping consumers make less harmful food choices. But it contains a couple of questionable points:
- It is questionable to consider any water needed for food growing to be a problem. Water use is only a concern if it is artificial potentially unsustainable human caused water extraction or diversion such as irrigation, especially water extraction from aquifers. Food production that does not require artificial water use is not a problem. Almond growing without irrigation an be lower impact than growing food that requires very little water but is done by diverting natural water for the growing.
- It is questionable to claim that the impacts of processing the processed foods are insignificant compared to the impacts of ‘growing, harvesting, and delivering basic food commodities to retail stores for sale’ (the following quote makes that questionable claim).
"The estimated environmental impacts account for the processing and transportation of commodities to retail stores, but do not incorporate postproduction processing, packaging, and transportation of, for example, converting sugar into a sugar-sweetened beverage or flour and butter into a croissant. This is unlikely to have a large influence on the estimated environmental impact scores as the large majority of food-related environmental impacts result from agricultural production (14), but it is important to note that this may affect the estimated scores for, for example, air-freighted produce or highly processed foods composed of agricultural commodities with low environmental impacts (19, 20).”
The authors should have stated that the full lifecycle impacts of postprocessing need to be included in the evaluation of the total impact of a consumer’s purchase choice. A personal bag of crisps (UK term for what N. Americans call potato chips), with ~1.5 oz (40 g) of potato in it, contains about 1/4 of a medium-sized potato. It seems very unlikely that the impacts of construction and operation of the processing, packaging, transportation of end products, and all related wastes of every part of the process are insignificant compared to the impacts of growing, harvesting, and delivering 1/4 of a potato to a retail display. Frying the bits of potato is not an insignificant impact, though it has to be off-set by the impacts of the home cooking method. And the transportation of the massive volume of completed ‘bags full of very little material’ would appear to produce a significant impacts per 100 g of product. Also, related important impact of a bag of crisps is the end disposal of the packaging of that little bit of edible product.
- Skeptical Science New Research for Week #31 2022
One Planet Only Forever at 02:41 AM on 6 August, 2022Presentations like “Climate Endgame: Exploring catastrophic climate change scenarios” are what matter most in science.
And the matter is more than "Given our circumstances and the wellspring of advice at hand, we'd be stupid not to pay attention." Not pursuing increased awareness and improved understanding and applying it to limit harm done and help those needing assistance is unethical - immoral.
Ethical Scientists need to maintain a focus on identifying the harm done by developed human activity. The marketplace competition for perceptions of superiority based on popularity and profit has proven to be uninterested in identifying and limiting harm done.
In the 2022 book “What Climate Justice Means and Why We Should Care” Elizabeth Cripps provides a well-reasoned moral/ethical understanding built on the thoughtful work of many others.
The bottom line understanding undeniably includes:
- the impacts of everyone’s thoughts and resulting actions add up to become the future reality.
- it is catastrophic for anyone to choose to act in ways that are unnecessarily harmful
- it is sad and harmful when a person chooses to be less helpful than they could be
The question of ‘unnecessary harm’ leads to understanding that only people living less than a basic decent life can be excused for acting harmfully in pursuit of a basic decent life. But the actions taken to achieve a basic decent life need to be as harmless as possible. Others who are living ‘better than basic decent lives’ at least owe assistance that they can easily provide to help those living less than basic decent lives sustainably improve their lives. In many cases the least that is owed is ‘to seek out and vote for leaders who would lead effective collective efforts to limit harm done and sustainably improve conditions for those who live less than basic decent lives’.
That ethical understanding makes it plain that people living more than basic decent lives are only pursuing ‘wants’, not ‘needs’. Pursuit of improved circumstances above a basic decent life ‘need’ to be essentially harmless because everyone doing a little bit of unnecessary harm can easily add up to a massive amount of harm. And any claim that ‘it is harmful to limit the excess harmful actions of people who are enjoying more than basic decent lives’ is an absurd, but potentially very popular and profitable, argument.
That understanding leads many people to try to deny that there is any harm being done by the harmful actions they developed a liking for. They try to deny there is any harm done by the undeniable increased CO2 due primarily to fossil fuel use. Some try to promote beliefs that there is no relationship between increased CO2 and harmful results of increased global average surface temperature (many of the items on the SkS list of “arguments” are versions of that).
The ability of misleading marketing efforts to tempt people to deny or excuse the unnecessary harmfulness of their chosen ways of enjoying ‘better than basic decent lives’ is potentially the most catastrophic thing that humans have developed. The resulting unsustainable harmful over-developed consumption by supposedly 'more advanced' people is a catastrophe. That portion of humanity 'is the asteroid ruining the future of humanity'.
- Taking the Temperature: a dispatch from the UK
MA Rodger at 09:44 AM on 23 July, 2022Bob Loblaw @17,
The CET is described as "representative of a roughly triangular area of the United Kingdom enclosed by Lancashire, London and Bristol." That would give it a centre somewhere near Stratford-on-Avon and only the western edge of your red area sitting within that triangle which extends mostly to the south. One problem with using early daily data (or even monthly data) from CET is that it is not using standardised thermometer hosuings. The Met Office do give ranked regional, national and UK-wide monthly averaged data for max min & mean temperatures but only go back to the start of use of the Stevenson Screen in the 1860s. These at least would be "sticking with national averages" which as described by Fixitsan @2 indeed would be "a better guide to what is happening in terms of trends over a larger sample area," although advice apparently then ignored.
These UK-wide top-rankers come in:-
Max Temp - Jan 1916, Feb 2019, Mar 2012, Apr 2011, May 2018, Jun 1940, Jul 2006, Aug 1995, Sep 1895, Oct 1921, Nov 2011, Dec 2015, Winter 1989, Spring 1893, Summer 1976, Autumn 2006, Annual 2014.
Mean Temp - Jan 1916, Feb 1998, Mar 1938, Apr 2011, May 2008, Jun 1940, Jul 2006, Aug 1995, Sep 2006, Oct 2001, Nov 1994, Dec 2015, Winter 1989, Spring 2017, Summer 2018, Autumn 2006, Annual 2014.
But single months and even single years ar subject to a lot of noise so listing out these top-ranked months etc and reflecting on the length of time thay have maintained that top-rank is doing little more than examining randomness. Even for annual means, this UK-wide data provides a randomness spread of +/- 0.9ºC (2 sd) and the rankings will be latching on to even rarer events than 1-in-20.
So the argument set out up-thread by Fixitsan is baseless.
Added to that, the statement @2 that "most of the CO2 was produced before 1989" is wrong. In terms of FF emissions, more has now been emitted since 1989 and in terms of the rise in atmospheric CO2 levels, 1989 sit at about halfway from pre-industrial, but not forgetting the poor old climate system does need a decade or more to get its reaction to climate forcing working significantly.
- Clouds provide negative feedback
Bob Loblaw at 06:00 AM on 13 July, 2022Likeitwarm:
The paper by Mulmenstadt et al that you mention was covered in this blog post at Skeptical Science, around the time it first appeared. (SkS reposted the Carbon Brief article.)
In that post, a key summary is:
However, the lead author of the study tells Carbon Brief that fixing the “problem” in rainfall simulations “reduces the amount of warming predicted by the model, by about the same amount as the warming increase between CMIP5 and CMIP6”.
So, the results are not as earth-shattering as you seem to want to imply. Uncertainties in cloud feedback are a well-known part of climate modelling and understanding, and this paper represents one more small step in helping understand the consequences.
As for your description of the water cycle:
- A wet surface evaporates more than a dry one. This transfers energy as latent heat into the atmosphere, and reduces the energy transfer as sensible heat (thermal energy). Thus, it priimarily changes the balance in how the energy reaches the atmosphere, not the total.
- What evaporates evenutally condenses and falls out as precipitation, but it rarely condenses or precipitates over the location it evaporates. Most extra water vapour is transported to other regions, where it falls as precipitation.
- Oceans receive far less water via precipitation than they lose as evaporation.
- Land areas (mostly) are the opposite - much more precipitation than evaporation.
- Increased evapoation does not necessarily lead to increased cloud cover at the evaporation location. Any changes in cloud type, amount, etc., are strongly depndent on when and where and how that cloud eventually forms.
- This complexiity is why cloud feedbacks are still an area of active study.
- The current understanding remains that clouds provide neither strong negative or positive feedback.
As for your discussion of "runaway warming" - nobody is predicting such a result due to CO2, so you are arguing a strawman.
And as to "self regulation of the temperature of the atmosphere" - the simple fact that climate has changed in many ways, for many reasons, over centuries and millenia is strong evidence that this is not true. Perhaps try reading the "Climate's changed before" post that reponds to our number 1 myth listed in our "Most Used Climate Myths" in the top left sidebar of all our pages.
I have worked through some darn cold sunny days in winter - much colder than overcast days in summer - to illustrate how incomplete your cloudy/sunny day closing statement is.
- How to inoculate yourself against misinformation
MA Rodger at 19:56 PM on 7 July, 2022Petra Liverani @68,
I do not see any connection which would require you to begin the comment "Just to add,..." You appear to be suggesting that certain argument proves nothing yet will still be savaged by those responding.
Simply stating "The climate's always changed," or "CO2 is plant food" does not of itself contradict the accepted fundings of climatology. I think you would need to set out the use of such statements (& the responses) to be able to judge whether "the kind of responses" were inappropriate.
To provide such context for your "The climate's always changed" statement, the first listed SkS myth cites Dickie Lindzen who is an actual clomatologist but who has never accepted the science of AGW and has done a lot of work attempting to overturn that science. Yet despite his best efforts, he has established nothing and in his attempts to establish something has adopted many egregious arguments like "The climate's always changed."
Indeed, the climate has always changed but that does not prevent us understanding why it changes and thus seeing that it has not changed before like today's AGW. Even the PETM which was also driven by rising CO2 levels took tens of thousands of years when we are driving the climate in mere centuries.
The "CO2 is plant food" argument is listed as the SkS's 43rd myth which describes why elevated CO2 is not entirely a good thing for plants. And do note that the plants are not very hungry for CO2 as they are only eating up a quarter of the CO2 we serve up.
- What role for small modular nuclear reactors in combating climate change?
michael sweet at 09:48 AM on 20 June, 2022Macquigg,
You have acted as an advocate of nuclear here so I have responded in kind. The Renewables vs Nuclear Debate forum on Facebook seems to me like a lot of nuclear advocates slamming the "greenies". You frequently state there that you support nuclear power. I see little informed discussion. The nuclear proponents who come here to post usually have little knowledge about reactors. One poster, Ritchieb1234, was very informed and we had a good discussion.
As I have previously told you, Abbott 2012 describes the issue with uranium. He shows that with low uranium concentrations in the ore it takes more energy to mine the uranium than you get from using it in a reactor. Your WNA article assumes that future engineers will develop mining processes that are orders of magnitude more efficient than any currently known processes. I doubt that is possible. Nuclear supporters would not work on breeder reactors or thorium if they thought there was enough uranium. We could get unlimited supplies of hydrogen simply by syphoning off the surface of the sun, but that is impossible. I note that you said "the cost of uranium is unlimited", not the supply.
Thor Cons statement that they do not process the salt is obviously false since they remove the noble gasses from it. That is a chemical process by definition. You do not understand the difference between a chemical "process" and "reprocessing" nuclear fuel. Thor Con is misleading. That is not my problem. Chemical processing the fuel is not a proliferation risk. Reprocessing the fuel is a proliferation risk. It appears to me that you are decieved by misleading information from Thor Con.
137Cs. As stated clearly in Lyman 2021, which I linked for you at least twice about this issue, giving you the page number (91) to read here, Thor Con would remove 137Xe, a noble gas, from the salt as part of their scheme to remove the noble gasses. The Xenon then decays into 137Cs in whatever storage system they have for the noble gasses. It would coat the inside of all the piping and the pumps. Thor Con has to answer the question of how they plan to deal with radioactive cesium-137 formed in the noble gas stream. Read the reference I have given for you to get the question that you are seeking. Lyman stated (in advance) that Thor Cons answer is misleading.
Your statement about Cesium being in column one is uninformed. If you had read the citation I gave you, you would know that the cesium is formed in the gas stream from radioactive decay, it does not evaporate from the salt. Since I am a professional chemist and I have read much, much more about reactors than you, I understand the chemistry of reactors better than you. If you framed your statments as questions I would be more helpful and less irritated.
Keep in mind that I have been having this debate with nuclear supporters for 15 years. From your posts I understand that you are a newbie. I researched most of your points years ago. Nuclear supporters online repeat the same old tired arguments that were already false 15 years ago. Back then renewables were more expensive than nuclear and there was a debate. Now renewables are much cheaper than nuclear. Informed debate ended several years ago, you have just not learned enough about nuclear and renewable energy yet to realize you are barking up the wrong tree. Read Abbott 2012 about 15 reasons why nuclear cannot work. His arguments have not been answered by nuclear supporters.
This discussion has become very repetitive. Since you do not read the references that I give, you do not understand the questions and answers. I note that I have read your citations, read your Facebook site and read your Citizendium posts. I have read Abbott, Krall and Lyman entirely and the response to Lyman on Facebook (the response is completely worthless). Why don't you come back when you have done your homework and can address the issues that I raise.
I have authored three posts on Skeptical Science about producing all the world's energy supply using renewable energy. Read them here here and here. All three say nuclear power is not necessary or economic. That is what scientists think about future energy supplies. You could use them as a basis of your renewable post. Dana Nucitelli also authored a post about renewable energy powering the world.
Nuclear power is not economic and the matrerials do not exist.
- Skeptical Science tackles 'discourses of climate delay' and 'solutions denial'
One Planet Only Forever at 11:22 AM on 19 June, 2022Another priority for “discourse of climate delay” would be the diversity of unsustainable harmful actions that were quick fixes claimed to be helpful but really weren’t helpful. What is needed is the development of sustainable improvements. Anything other than that is harmful or a harmful distraction.
The BBC Ideas video “The 12-year-old who tried to save the world” is related. It expressed concern (in 1992) that adult leaders may not responsibly act to limit harm done and would try to claim that they were acting helpfully.
Examples of this problem since then are:
- Claims that changing the date of start and stop of Daylight-saving (a silly term to begin with) time change would significantly reduce energy demand. US President Bush did that. And he also declared that Americans did not have to change how they lived.
- Claims that compact fluorescent bulbs were a part of the solution. They were a harmful wasteful product. It would have been better to get people to replace use lower wattage incandescent bulbs and turn off bulbs when not needing the light while the development of LED light fixtures was prioritizes and expedited. A policy step for that would have been imposing a significant tax on higher wattage bulbs.
- Claims that wind turbines with blades that could not be recycled or that solar panels made in ways that are hard to recycle were part of the solution. It would have been better to get people who used more electricity than they needed to while the development of recyclable renewable systems was prioritized. A policy step for that would have been imposing a graduated pricing model for home electrical use, with the price rising for steps of higher use ($0.10/kWh for the first amount, $0.15/kWh for the next increment .....)
- Claims that nuclear fission is part of the solution. Nuclear fission consumes resources without recycling ... it is unsustainable. And nuclear fission produces accumulating harmful waste ... it is doubly unsustainable just like fossil fuel use. But, unlike solar and wind which can be part of a distributed integrated sharing power generation system, nuclear will be centralized power generation that investors and executives are more likely to be able to benefit from, as long as they are ‘privatized’ rather than being ‘Public owned utilities’.
The status quo of developing a series of harmful unsustainable things and claiming they are improvements that are ‘part of the solution’ is a delay tactic. The actions often do little to encourage the required reduction of energy consumption.
Reducing energy demand would be far more beneficial to future generations than higher demand for less harmful energy. Totally recyclable renewable energy generation and use may never be developed. It hasn't yet been developed. The most advanced systems still are not fully recyclable and accumulate harmful waste. It is possible that fully recyclable renewable energy systems will never be developed. Seriously restricting energy use is required until fully recyclable renewable energy generation is developed. Those restrictions would seriously motivate the development of the required recyclable renewable energy systems.
There is ‘only this one planet that is habitable for humans almost forever as long as humans don't ruin it with their technological creativity and related harmful misunderstandings about how great the new things are’. Humans have to learn to adapt to live with that reality.
- Planetary Dieticians
One Planet Only Forever at 12:42 PM on 15 June, 2022This is a good analogy. However, building on my Planetary Diets comment, the context for the dietician’s work should be expanded to be working with multiple people. And one of the objectives would be to help reduce the collective harm of avoidable future demand for health care services or other needed future adaptations or attempts to repair the avoidable harm.
In that context, the resistance of learning (lack of change of behaviour) of some patients would cause the dietician to pursue understanding of the likely developed motivations of the patients which would be influenced by the environment they developed in. Consumption-based competition driven by popularity and profit should be expected to develop powerful resistance to governing that would limit the pursuit of enjoyment and status. And it is worse if there is misleading marketing that scientifically tempts people to harmfully over-develop primal instinct-based harmful misunderstandings. That scientifically driven system of misleading marketing can promote desires for sweet, fat and salt in the pursuit of profitable popular harmful over-consumption. Examples include:
- a culture development like the ‘Reward of Birthday Cake’ (the donut being like that reward)
- enjoyment of salty snacks at a bar (causing you to desire more beverages)
- a cultural development like being impressed by a large piece of unhealthy fatty meat (fatty fish in moderation can be a helpful part of a healthy diet)
The dietician would become aware of the harmful desires for more consumption of whatever is perceived to be enjoyable or perceived to indicate higher status. Those desires could motivate people to resist changes that reduce their perceptions of enjoyment or status. And some people can become so harmfully tempted that they irrationally declare that they will only behave better if new things are developed that they perceive to be equally or more enjoyable, and cheaper and easier, than their harmful developed preference.
If the individual is determined not to learn to limit harm done to themselves then there is little that the dietician can do to help them. Updated monitoring and explanations of the results will continue to be denied and dismissed until the patient personally suffers horrible consequences that shake them out of their developed pattern of desired harmful misunderstanding.
That leads to understanding the dilemma of the reality of higher costs for renewable energy compared to the misleadingly low costs of fossil fuel energy. Fossil fuel costs are misleading because the costs do not fully neutralize the harmful impacts. The specific case of electricity is highlighted in “Cost increase in the electricity supply to achieve carbon neutrality in China” presented as the lead item on the Skeptical Science New Research for Week #23 2022. I will make a more extensive comment about that there.
- Planetary Diets
One Planet Only Forever at 04:15 AM on 14 June, 2022This is a good analogy for part of the fuller more complex issue of climate science. But it is missing some important aspects of the increased awareness and understanding of what is happening and the required changes and adaptations.
It has taken some time to reduce this to the following comment on this post. I intend to provide related ‘complementary or convergent’ comments on the Planetary Dieticians post and the “Cost increase in the electricity supply to achieve carbon neutrality in China.” item that is the lead in to the Skeptical Science New Research for Week #23 2022
A important awareness/understanding to be included is that the harmful climate impact problem is the result of the collective of personal actions. Everybody’s actions add up to be the future, and invariably impact Others. Climate science understanding is that the consequences of the climate change impact actions, the benefits and harms, are unfairly experienced. The ones who benefit most from the harm done generally will not suffer a commensurate amount (most) of the harm. What is happening is a reality that is a nasty version of the Corsican Brothers fictional tale. The Brother enjoying something feels little harm. Significant harm and little of the enjoyment is experienced by the Other Brother. It is also important to understand that those suffering climate impact harm include all the people of the future who have no influence today (which is a major part of the reason that the problem has not been seriously addressed in societies governed by current perceptions of popularity and status). That is a very important difference from presenting the case that an individual, or group, is only harming themselves by their actions.
A less significant point to include is that the type of donut consumed can also be understood to make a difference. But changing to lower calorie types only reduces the rate of the problem. Ending the donut eating is what is required along with actions by the donut eater to undo the damage done by the donut consumption.
That understanding connects to the unhelpful and harmful, but valid, claims that people will only change what they do after what they have developed a liking for is able to be replaced by something they see as being as enjoyable, cheaper and easier. Many people have learned things like ‘not to drive dangerously’ or ‘not to hit Other people’ or ‘not to litter’ without the development of an equally enjoyable alternative that was cheaper or easier (and some people did not even require the threat of penalties to learn to be less harmful and more helpful).
A serious problem is the people who resist learning from the advice of experts -> related comment in Planetary Dieticians.
- Why and How to Electrify Everything
John S at 10:21 AM on 7 May, 2022Don't electify where equivalent or better service can be provided in a way that uses less valuable electricity system capacity; e.g. building heating and cooling can can be accomplished directly via district energy systems from natural resources like the sun or deep water or waste heat or surplus power with just a little help from heat pumps and seasonal thermal enegy storage. BTW air source heat pumps are not efficient at the very low temperature which is exactly where a lot of the heating is needed in the northern US and Canada and the heating peak demand could be about three times the current electricity system winter available capacity (my estimate for Ontario).
- The Climate Shell Game
jan at 01:53 AM on 29 March, 2022@michael sweet #61
I will continue to use the facts only:
1. in my post #40 you can read:
Vehicles operation is not global but regional. It follows that we cannot use global emissions from cars as a tool to calculate emission reductions with the introduction of EVs, but strictly regional, per country. It will be mathematically correct (the global data approach), but you will not be able to put it into practice.
What was the purpose of my discussion regarding the largest producer of GHG emissions with the largest EVs market in this world (+50%) with +70% of Power production from fossil fuels (and it grows). I don't like Global Math Averages. In principle, the arithmetic mean is the least accurate indicator of reality. I presented you with the NREL study, which may not fit into your concept, but it cannot suit everyone. However, if the comprehensive study by The National Renewable Energy Laboratory is not enough for you, it is difficult to look for anything more accurate.
So we can check your mentioned study about the EVs better emissions for Global strategy:
2. Your study (Vliet et all, 2011) mentioned in #61 contains a different statement (page 7):
"We find that EVs charged using electricity from coal do not have significantly different GHG emissions from driving in regular cars."
and as you wrote here:
"We find that EVs charged using [100%] electricity from coal do not have significantly different GHG emissions from driving in regular cars."
the value [100%] was defined on the basis of your own interpretation?
link to the study to confirmation of the mentioned wording (page 7)
following the study you need to take into account:
- study is from 2010 (published)
- it is about the Netherland's specific conditions only, you can't take it as the holy grail for each country
- also specific conditions for Power production must be taken into account - the NGCC technology is more predominant in this country = lower emission factor than coal-fired plants (you can see the differences in Table 4.: Electricity generation capacity in the Netherlands)
- you will find there also an increase in the pulverised coal-fired plants for the 2015-2030 period (Table 4)
- and finally - Summary and conclusions (Page 11) ... read carefully:
WTW GHG emissions from electric driving depend most on the fuel type (coal or natural gas) used in the generation of electricity
for charging, and range between 0 g km−1 (using renewables) and 155gkm−1 (using electricity from an old coal-based plant). Based
on the generation capacity projected for the Netherlands in 2015, additional electricity for EV charging would largely be generated
using natural gas, emitting 35–77 g CO2eq km−1. In the Dutch context, emissions vary little with charging patterns, and are unlikely
to change much before 2030.
And here is a summary from the IEA report 2020:
In 2018, TPES came from natural gas (42%), oil (37%), coal (11%), biofuels and waste (5%), and small shares from nuclear, wind, solar, hydropower and geothermal. The Netherlands is still one of the largest gas producers in Europe; however, domestic gas supply and gas exports are rapidly declining as production from Groningen is being phased out. Domestic oil supply is small, especially in comparison to the large oil demand. All coal is imported and is used primarily for electricity generation and steel production. The electricity supply is also heavily reliant on fossil fuels. In 2018, electricity generation came primarily from gas (52%) and coal (27%).
it means that there was no such significant coal damping as the study mentioned for 2015 = 55%; it's actually less. And even worse for 2021:
The current energy mix in the Netherlands is natural gas (38%), oil (35%), coal (11%), biofuels and waste (5%), and 11% from nuclear, wind, solar, hydropower and geothermal.
Following reality, the mentioned study is out of a doable plan. I like data and I would like to listen more than personal attacks, rather more deep-dive information from my base education in Energy engineering. I'm the proud owner of a small PVe and Solar water heating, so you really don't have to swear at my fossil fuels lobby. I understand energy - from its production, distribution to consumption.
That's why I'm researching anything related to emissions. Not everyone will like this option - but I'm not a friend of extreme solutions or chaos.
Finally, I'm sending a link to one peer-reviewed study from The Nature - A plant-by-plant strategy for high-ambition coal power phaseout in China. link
If you will find at least 3 fatal mistakes that should not appear in The Nature or any peer-reviewed studies, you have passed the Energy engineering exam. Otherwise, we can no longer talk about Energy engineering from the position where you want to be a professor.
I judge people by what they write about and how they write. I don't care what their education is. And I don't care if the document was peer-reviewed because:
- Energy engineering is my native domain
- We have scientists like Ivar Giaever and similar creators here
- you can choose peer-review as a service from your defined contacts, even in reputable journals.
Each of my documents contains data only from scientific sources and/or national sources from which I drew (defined). I don't like bending data. I do not have time for this.
- The Climate Shell Game
Philippe Chantreau at 02:50 AM on 28 March, 2022I don't understand what Jan is talking about at 54. The problem of how the electricity is generated is such a basic consideration that it has been studied enough to draw conclusions. Multiple studies have shown that the life cycle carbon footprint of EVs is lower than that of ICEs even if they are charged with electricity produced with coal. The battery production process is carbon intensive but that is compensated by the superior efficiency over the lifetime of the car. In pure mpg equivalent over only road use, it more than compensates, even with FF produced electricity.
It takes only 2 years on average for the balance to tilt in favor of EVs. Location and driving habits make it vary. However, when comparing EVs to ICE, it is always possible to reach a mileage where the whole vehicle life carbon emissions become lower for the EV and it is always a realistic number of miles. It just takes more miles when using electricity that has a lot of fossil fuel in the production mix and batteries made in Asia.
CarbonBrief has looked at this in details:
https://www.carbonbrief.org/factcheck-how-electric-vehicles-help-to-tackle-climate-change
Unfortunately, a vehicle is a big purchase. I already have a hybrid that I bought only a few years ago so no EV for me in the near future. Would help also if they became a little less expensive...
- The Climate Shell Game
michael sweet at 06:30 AM on 25 March, 2022Jan,
I think you have the incorrect assumptions behind many of your calculations. This results in your conclusions being in error. In general, whenever I see someone relying on their own calculations instead of published calculations I figure their conclusions are incorrect. I see very little peer reviewed data in your posts.
For example, many published studies describe how to get 100% renewable energy. See this description of Connelly et al 2021 for a starter. I note that you have no problem with "baseload" power sources that require emergency back up power every day to provide peak power but you are concerned that renewable energy might have problems providing peak power. Why is it OK for "baseload" sources to require back up but not renewables? Most of the pumped hydro storage in the USA was built to store power from nuclear power plants at night to use for peak power during the day. Plans like Connelly et al describe how to provide 100% renewable energy. You are wrong to suggest it cannnot be done. Providing 80% renewable energy using existing fossil gas peaker plants as storage is easy and cheaper than fossil power.
Your anaylsis of EV cars seems to me to be completely off. Even if the grid is 100% coal there are benefits from EV. You do not consider that baseload coal power plants are about 40-45% efficient at generating electricity form the heat of the coal. Gas combined cycle plants are over 60% efficient. EV cars are about 90% efficient in using electricity. By contrast, internal combustion cars are only about 20% efficient at using the energy in the oil they burn. When you consider the comparable emissions of carbon dioxide, an EV with electricity from a 100% coal electrical system releases comparable carbon to internal combustion engines. Since the electricity for Evan is over 50% from wind, his EV releases much less CO2 than a comparable ICE car.
According to Our World in Data China gets about 30% of its electricity from renewable sources. It seems to me that when you consider the efficiency of EV cars compared to internal combustion cars the EV's release less CO2 than ICE. Since almost all coal systems use gas for peak power the release of CO2 is even less from EV cars than ICE cars. My brother has solar panels on his roof that recharge his EV car. How much CO2 does his car release?
This peer reviewed paper says that the best thing to do for the next ten years is to build out renewable energy sources as fast as possible and switch to EV's at the same time. If we wait on EV's until we have more renewable energy we will not be able to switch fast enough from ICE's. Your argument that we should wait for more renewable energy to be built is completely incorrect. Please cite a peer reviewed paper that suppports your wild claims. I think your calculations are incorrect as described above.
I note that the people engaging in this conversation are citing their own calculations and not peer reviewed documents. I see many claims that I think have been demonstrated as false in the peer reviewed papers I have read. It seems to me that many of the claims made here are simly fossil propaganda against renewable energy. I want to remind posters that this is supposed to be a science based site. You must support your claims with peer reviewed data.
The poor are building out renewable energy in many locations. Why build a coal generator when renewable energy is much cheaper? Why build out central facilities wheen distributed generation (like PV) is much cheaper? You guys need to read the literature and give up on the fossil fuel propaganda.
- The Climate Shell Game
prove we are smart at 08:58 AM on 24 March, 2022Australia plays the climate shell game very well.. "This is little more than a wealth transfer. People can think of this as welfare payments for the undeserving". www.msn.com/en-au/news/australia/insider-blows-whistle-on-australias-greenhouse-gas-reduction-schemes/ar-AAVpXoK?ocid=ACERDHP17&li=AAgfYrC
I stopped feeling guilty about buying my only 4k oled smart tv 3 wks ago after reading this...www.miragenews.com/ranked-how-many-properties-do-australian-545566/
Thanks Evan for simplifying to some of the bottom lines. Many years ago I stumbled onto Skeptical Science which began my AGW learning, now of course commonly called climate change. Yes, the overshoot problem with 80 million people extra every year on a finite earth isn't helping.
I try to use many different media sources to reduce bias but with a lot of my friends many are not so caring. Thanks Jan@18 for hitting the nail for me. When I pulled my head out of the ground to educate myself, it was a fruitful exercise but lately it seems the doomer in me is growing stronger. Is that why so many wilfully delude themselves-I think in this media world people need to see the high status/leaders showing integrity and sacrifice( because it's needed now)- just don't hold your breath..
- The Climate Shell Game
Eric (skeptic) at 05:18 AM on 23 March, 2022Evan, the cause of the acceleration is important. It's not the usual suspects using more energy, it's billions of people who use very little energy using more energy. Two million children die each year from indoor air pollution. http://www.sciencedirect.com/science/article/pii/S003592030800271X. That's because 2.5 billion people use indoor fires for cooking and heating. Governments of all types will do what China did, first giving people stoves and then coal-fired electricity.
What do we do about that since that is the cause of the acceleration? We look at China's R&D as I pointed out in my opening comment, with the largest investment in solar hydrocarbon fuel research in the world. The benefits will be carbon neutral heat and cooking on demand. Fossil electricity is available today so they are doing that today. They will ramp up renewables as your fig 4 shows. The past lag is due to high price and the current lag is due to lack of emergy storage.
I hope I have explained why the curves in fig 4 have those shapes. Perhaps you can counter that argument and/or explain why lower prices and energy storage won't change the outcome by particular dates.
- Addressing the Climate Crisis:
Evolution orRevolution1
One Planet Only Forever at 04:19 AM on 15 March, 2022Here is my response to what swampfoxh wrote @74 (in the context of other responses and all the other comments on this thought provoking OP).
Regarding animal agriculture, I support corrections of all food production, distribution, and consumption aligned with the understanding that harmful unsustainable ways of food production need to be ended. It is especially important to correct the developed types of production and consumption that have already caused phosphorous and nitrogen impacts to exceed safe planetary boundaries (see Planetary Boundaries). It is also important to limit waste and ensure that all people receive at least basic decent nutrition, preferably from maximized local food production (refer to the compendium of climate impact related solutions presented in Project Drawdown).
Upon reflection it appears that serious important questions are raised by the way that swampfoxh chose to try to focus attention on the matter Rights (in spite of the content of my first comment on this topic @3, and all subsequent comments).
The (sort of) quick response is:
Fossil fuelled development can produce perceptions of prosperity and superiority. And the competitive for pursuit of higher status (admiring and aspiring to be like the highest status) can develop harmful misunderstandings in attempts to develop and prolong harmful activity. Undeserved status would be lost by a correction of what has developed and a correction of the direction of development (away from fossil fuel use).
A correction to limit the harm of climate change impacts will cause loss of developed status. The more rapid the correction, the more significant the losses will be. And it now appears, based on Figure 2, that significant losses will have to happen in the remaining lifetime of many people who fought to delay the correction. Their fight against change, their fight against correction of harmful developed misunderstandings, has created the need for more rapid correction. That has motivated increased resistance to learning in people who would prefer to have the losses happen to Others, especially the future generations who have no influence today. They make excuses that the future will always be better for everyone. And they make related demands that they not suffer any loss of their status relative to others due to required corrections, claiming things like ‘everybody’s perception of prosperity needs to constantly improve fro the current developed starting point, like a marathon racer who wants to start 20 miles into the race, because that is where they are when the race starts.
Rights are an ethical matter that gets harmfully compromised by political game players. The harmful socioeconomic game players who have significant political influence can become the least ethical people, using the power of misleading marketing to promote and prolong harmful misunderstanding.
Poverty in the midst of Plenty is the result of systems that create cases of people who do not deserve the circumstances they experience. Many of the lower status do not deserve their lower status. And many of the higher status do not deserve their higher status.
A different response is:
It is a misunderstanding to believe that people who were less able to develop the more harmful, less sustainable, fossil fuelled ways of living (mistakenly perceived to be more advanced or superior) have ‘missed the bus’. It is also unacceptable to declare that the people enjoying the ride on the ‘harm-full bus’ must not have their level of enjoyment limited or governed externally by others. It is not right to declare that the ones on the ‘Harm-Full Bus’ have the right to be more harmful than Others. And it is not right to declare than others cannot develop to harmfully joy-ride like the ones already on the ‘Harm-Full Bus’.
And helpful people should not have to try to undo or repair the harm done by people on the ‘harm-full bus’. However, until the Harm-Full Party Bus is safely kept from harmfully compromising leadership actions, all possible helpful hands are required to build the power to limit the harm done - no more bystanders or people ‘just focused on the science’, because those type of people are part of the harm problem by not being as helpful as they could be.
Competitors who are willing to try to benefit from something harmful that others may not notice as harmful (like sports cheaters) or try to benefit from a harmful misunderstanding (including unethical rules or unethical enforcement of rules) can mistakenly develop the belief that ‘everyone is like they are’. That can create a mind-set that can be easily tempted to spiral down into more harmful misunderstanding.
Less fortunate people have more excuse for being less aware of how to avoid being harmful to others. More fortunate people have less excuse. And the legitimacy of the highest status, like the wealthiest 10%, should be evaluated based on the understanding that they all have ‘little excuse for maintaining harmful misunderstandings’.
Disclosure: I have lived for decades in Alberta, a major region of origin of harmful fossil fuelled misunderstanding. I have tried to be less harmful, engineering was a good fit for that, and more helpful to others (a diversity of volunteer activities are part of that). My abilities, combined with those focuses, appear to have enabled me to rise into the top 10% of income earners in Alberta. I may have been able to achieved a higher status, but I was not interested in compromising my ethical perspective in pursuit of that.
A detailed response regarding my perspective on the issue follows:
Constant learning from a constantly improving ethical perspective is an important part of the pursuit of increased awareness and improved understanding of how to be less harmful and more helpful to others. And that expanded ethical perspective includes consideration for all other life, humans do not stand apart from nature, now and into the future, constantly learning to correct, and make amends for, developed harmful misunderstandings and related actions.
Everyone learns and develops their motives and perspective from the environment they are born into and grow up in. A lack of diversity of experience, including a lack of natural experiences, can develop a harmfully limited perspective. And that developed limited perspective can resist learning how harmful the things that are perceived to be beneficial actually are. Too much focus inside a man-made socioeconomic-political environment of competition for survival and superiority relative to others can develop intensely held harmful misunderstandings.
Ethical fairness of what is being evaluated is determined by considering the system and its results from versions of the following perspective: The system is fair and just if I end up experiencing any of the diversity of individual circumstances that the system could potentially produce (consider the history of European colonial conquest from that perspective, and extend that thinking into the future).
That evaluation justifiably determines that systems that produce poverty in the midst of plenty need correction. It also establishes the understanding that a person who acts in ways that harm others does not deserve credit for helping ‘a different sub-set of others’. A person who ‘helps some people’ in ways that ‘harm other people’ is harmful. And that individual-based understanding can be extended to groups of people. A group or nation is not Collectively Good if some of its members are helpful pursuers of being less harmful while other members of the group or nation pursue benefit in harmful ways.
A fundamental ethical point is understanding that each person born should not have ‘advantages or special rights and privileges’ due to where and when they are born or who their parents and ancestors are. That understanding is often attempted to be denied by the promotion of harmful misunderstandings regarding ‘perceptions of status’ (like believing that a ‘special sub-set of the population’ deserve to be the first and only ones on a bus). A related point is that a person who has attained higher status relative to others by benefiting from harmful actions does not ‘deserve the ability to be harmful because they can afford it or can legally win attempts to penalize them for the harm they benefit from’. Harmful laws and harmful application of laws have been developed, proving that all Rule of Law is not Ethical Law and Order. Harmful laws and enforcement are often developed to defend and excuse harmful people who have become wealthier or more powerful through harmful means.
That context leads to ethical questions of how fair and just it is for someone to declare that:
- They were the first to benefit from a harmful unsustainable activity and therefore must not be corrected, but others who have not developed to live that way must not be allowed to develop to be like that.
- They have developed to be the most harmful pursuer of personal interest and must not be corrected, but others who have not developed to live that way must not be allowed to develop to be like that.
- Because they were born into a group that had developed perceptions of higher status relative to others through actions that are now understood to be harmful and that were/are excused and defended by harmful misunderstandings, they must not be corrected, but others who have not developed to live that way must not be allowed to develop to be like them.
Applying that thinking to climate change impacts, what swampfoxh states @74 can be understood to be arguing for the right to continue to be more harmful than Others are allowed to be.
Applying a different perspective, what swampfoxh argues @74 is no reason for nations like China or India to forego their development. There is lots of coal and oil to burn. It is clearly inexcusable for people in nations with a history of benefiting from harmful actions to demand that they have the exclusive Right to maintain their harmfully obtained benefits, insisting that others who have been less harmful and have less developed ways of living must not develop to be like them.
I will use Canada (representing the Western developed nations), the nation I was born in about 60 years ago and continue to live in, as the example to reinforce the point. The following compares per person emissions from 1960 (World Bank data) between Canada - USA and the BRIC nations. The average atmospheric CO2 levels are provided in brackets to indicate harm already done primarily by western nations (with 280 ppm as the understood level before those impacts:
Yr (ppm) Canada - USA: Brazil – Russia – India - China
1960 (317) 10.8 - 16.0: 0.65 12.1 0.27 1.2
1970 (326) 16.0 - 21.1: 1.0 18.1 0.35 0.94
1980 (339) 18.1 - 20.8: 1.6 25.1 0.45 1.5
1990 (354) 15.1 - 19.4: 1.3 14.6 0.64 1.9
2000 (369) 16.8 - 20.5: 1.8 10.2 0.89 2.6
2010 (389) 15.7 - 17.4: 2.0 11.1 1.4 6.3
2018 (410) 15.5 - 15.2: 2.0 11.1 1.8 7.4 latest World Bank values
2020 (412) Canada 16.8 (= 637 Mt / 38 million): China approx 10 (like Canada was in 1960)
There is ample coal and oil for China and India to develop to match the pattern of high emissions per person for 60 years. What is their motivation to not do that? Why wouldn’t they follow the examples set by the more developed nations? The argument by swampfoxh @74 would deservedly be laughed away.
And, revisiting my comments about how averaging things can obscure what needs to be seen, why wouldn’t every region of China and India develop to match what the region of Alberta/Saskatchewan in Canada has currently developed to be? The combined population of Alberta and Saskatchewan is 5.6 million (4.4 + 1.2) with emissions impact rates of 60 tonnes per person (potentially increasing if the rate of extraction and export of fossil fuels, especially Western Canada Select - diluted bitumen - is increased). It is important to note that that high rate of impact does not count the additional harm done outside of Canada to process the exported product into final products for burning. What is exported, WCS, is heavy sour crude. Upgrading it to the quality of other globally traded oil products before export would result in more emissions in Canada (that understanding indicates that the federal government shares the blame with the provincial governments for exporting more harmful products to make Canada’s numbers look better).
I am fairly proud of a lot of actions taken by Canada's leadership on matters of corrections of harmful developed misunderstandings, but not regarding climate change.
- Addressing the Climate Crisis:
Evolution orRevolution1
One Planet Only Forever at 08:25 AM on 11 March, 2022nigelj,
I responded to the folowing in the context of the topic and comments.
"You appear to be promoting some form of perpetual and sustainable "green growth". I used to believe in this, but theres a growing body of expert opinion that it is neither possible or desirable. In addition cutting consumption of high income people is going to reduce growth by pulling demand out of the system. Adopting traditional farming would actually slow growth because its lower yield than industrial farming.
These things along with zero economic growth, or low growth, are not bad things - provided they dont happen too quickly. The system needs time to adjust. Human civilisation is getting old and is about to slow down. This may be a hard truth to accept.
This is all different thing to crazy agendas to rapidly cut resource consumption by massive levels."
That was twisting, significantly misunderstanding, my comments. So I replied accordingly. And I will maintain the understanding that 50 years ago there was potentially time to let the system adapt. But the evidence indicates that the system is powerfully uninterested in changing, and certainly won't change rapidly enough. That system has now developed the need for a much more rapid and painful correction, as illustrated by Figure 2, or massive damage will be done to future generations as many people today continue to enjoy what they believe to be success.
Agreed that many traditional agriculture systems are less productive per hectare in the short-term. But they have a longer future. Industrial agriculture is depleting the ability of lands to be productive, all while being more profitable than the longer lasting less harmful alternatives.
Reviewing the "Land Sinks" set of solutions evaluated and compiled in Project Drawdown is a way to learn about instances where modern industrial agriculture is not as good as pre-modern ways. And it can be appreciated that Project Drawdown is focused on changes and new developments that, in combination, address the required limiting of climate change impacts. There are, of course, many other aspects of developed modern industrial agricultural practices that need to be changed, to be more like the pre-industrial ways, to get Phosphorous and Nitrogen impacts back below safe Planetary Boundaries.
The summary page of the Land Sink set of solutions in Project Drawdown includes the following statement:
"Shift Agriculture Practices
What and how we grow, graze, or harvest can be a means to cultivate biomass and regenerate soil carbon. An array of “regenerative agriculture” methods are being rediscovered and developed worldwide, and show promising results. The integration of trees into farming through agroforestry practices is particularly powerful. All solutions that sustainably raise yields on existing farmland can also reduce the pressure to clear other areas."
And the most beneficial of the food related "Solutions" presented in Project Drawdown are (along with their overall standing among the 82 solutions evaluated in Drawdown Scenario 2 which is roughly in-line with achieving 1.5˚C temperature rise by 2100 - and Scenario 1 which is roughly in line with 2˚C temperature rise by 2100):
Reduce food waste (#3 in Scenario 2 - #1 in Scenario 1)
Plant rich diets (#4 - #3)
Tropical forest restoration (6 - 5)
Silvopasture (11 - 11)
Tree plantations (on degraded land) (13 - 13)
Perenial staple crops (14 - 19)
Managed grazing (16 - 17)
Tree intercropping (17 - 20)
Regenerative annual cropping (20 - 21)
Multistrata agroforestry (22 - 25)
Abandoned farmland restoration (23 - 23)
And there are more agriculture related items on the list. But always keep in mind that the Planetary Boundaries evaluation has identified that Phosphorous and Nitrogen impacts, largely unrelated to climate change impacts, are already significantly exceeding Safe Planetary Boundary limits due primarily to modern industrial agriculture.
I suggest multistrata agroforestry and indigenous people's forest tenure and tree intercropping as examples of traditional methods that are superior to industrial methods, from the perspective of being able to be continued long-term. Tree intercropping is described as something that was "Plowed under during the twentieth century to make room for industrialized methods of farming, tree intercropping is one of dozens of techniques that can create an agricultural renaissance—a transformation of food-growing practices that bring people, regeneration, and abundance back to the land."
But there are many other examples where more labour intensive methods, and ways that are potentially less productive per hectare in the short-term, are superior because they result in a lasting system that ultimately produces a larger total amount of food from the land that the industrial practices that deplete land quality and produce other harmful impacts while they 'appear to be superior - for a little while - because they are more profitable for investors who pursue maximizing their short-term return from every investment they make'.
- UN report: The world’s farms stretched to ‘a breaking point’
nigelj at 14:35 PM on 26 January, 2022Swampfox @3 &4
"I didn't say the science of Regen is faulty."
Hmmm. You said "Just the requirement to move cows from place to place on a rotational schedule requires another ranchhand for about every 50-100 head, plus miles of fence maintenance, water drops, etc. I find the "science" faulty and little more than another USDA attempt to salvage industrial animal agriculture"
I thought by this you meant regenerative agriculture, but perhaps you just mean rotational grazing? I think you lacked a little bit of clarity and its still not clear how you feel the science is faulty.
Regarding your statement " I said, almost nobody will do it (regenerative agriculture)." Fair point. I live in New Zealand and Regenerative farming is also a small minority of farmers. However we are starting to see some growing interest over the last five years and more farmers getting on board. However personally I doubt it will really scale up without some sort of government incentives. I know some countries pay farmers to use regenerative farming to conserve soil carbon. Australia I think.
And I do see the same objections to to regenerative agriculture that you list.
Its the same sort of issue with organic farming. Its still a minority of farmers in New Zealand, and it costs more to farm that way. But at least with organic farming theres a customer base prepared to pay the higher prices and certification schemes helps identify genuine organic food. In New Zealand we have no such certification scheme for regenerative agriculture. But again I doubt organic farming would take over without some sort of government incentives or rules.
Personally I think our civilisation will have to change from industrial farming to some form of regenerative / organic farming sooner or later, but I don't subscribe to doctrinaire versions of these things, and I don't oppose every single facet of industrial agriculture. We may have to combine systems. We may keep some limited level of industrial fertilisers to maintain adequate yields and get enough farmers interested. Just my opinion of course. However the impact of industrial pesticides on insect populations is very concerning. We must find a solution to this and fast.
Thank's for the offer to visit and review your work, but I regretfully wont take it up simply because I live in New Zealand on the other side of the world, and I probably don't have nearly enough farming and biological expertise to review your study. But I wish you all the best with your research. You should probably get in touch with Red Baron (Scott Strough) who posts comments on this website.
- From the eMail Bag: the Beer-Lambert Law and CO2 Concentrations
Bob Loblaw at 12:08 PM on 12 January, 2022The original emailer has sent in a follow-up to the Skeptical Science contact page, asking about black-body radiation and differences between emissions at 255K and 288K. A temperature of 255K is the commonly-cited radiative temperature at which the earth-atmosphere system emits IR radiation to space, while 288K is the commonly-cited global mean temperature for the earth's surface. The difference is a measure of the role of the atmosphere - the greenhouse effect - and this difference is predicted to continue to rise as atmospheric greenhouse gases continue to increase.
The blog post focuses on atmospheric absorption, not emission, but atmospheric absorption by CO2 is a key factor in the greenhouse effect. So, how might that temperature difference - 288K at the surface, 255K at high altitude - affect this process?
A few of the comments to the post touch on aspects of IR emission, and in figure 2 and comment #10 I mentioned Planck's Law, which governs radiation emission. Figure 2 was intended to show the difference between solar (5800K) and terrestrial (255K) sources of radiation, but does not touch on differences for the range of temperatures within the earth-atmosphere system. The recent follow-up email asked to see Planck curves for 255K and 288K (and to see them on a linear scale), so here is that graph:

The horizontal axis is wavelength in μm, and the vertical axis is energy in W/m2/μm.
There are three obvious features:
- At the hotter temperature, the area under the curve is much larger. This area represents the total energy emitted. Hotter sources emit more energy overall.
- At the hotter temperature, the peak happens at a slightly shorter wavelength. Hotter sources shift a larger proportion of their emissions to shorter wavelengths.
- The 288K curve always lies above the 255K curve, so even at a specific wavelength, the hotter source emits more radiation than the cooler source.
The "hotter source" explains why I used a logarithm scale in figure 2. The sun emits a lot more energy than the earth. There is also one more "feature" to figure 2: I scaled the solar output so that instead of giving the intensity at the surface of the sun, where it is emitted, I scaled it down to the value appropriate at the earth's orbit around the sun. That was the only way to get the two lines to graph anywhere close to each other.
So, if we look back at our discussion of the Beer-Lambert Law, what difference does the source temperature have on the absorption of IR radiation? (The original email had mentioned 15 μm, which we see is a little to the right of the peak in the above graph.)
Well, it turns out that the temperature of the source has absolutely no effect whatsoever on the absorption according to the Beer-Lambert Law.
- In the blog post, note that the equations for the Beer-Lambert Law do not have temperature in them.
- You can add a subscript to the Beer-Lambert Law to indicate wavelength, as the absorption coefficent is highly-dependent on wavelength, but it does not matter what temperature the source was at that emitted the radiation.
- It also does not matter what the temperature is at the location the absorbing is happening.
Why is this? Well, there are several factors:
- The Beer-Lambert Law just tells us the probability that a single photon will be absorbed.
- Each individual photon is either absorbed, or not. Do, or do not. There is no try.
- If the photon is absorbed, all the energy goes into the molecule that does the absorbing (and is then transferred to heat all gases through molecular collision).
- If the photon is not absorbed, then the photon will continue along its way, and be transmitted through the atmosphere.
- An absorption coefficient of 0.01 means that there is a 1% chance that a single photon will be absorbed. It does not mean that each photon loses 1% of its energy - it means that 1% of all the photons lose 100% of their energy and the oher 99% lose none.
And all 15 μm photons are the same.
- They travel at the same speed, and they contain the same amount of energy.
- They do not contain more energy if they were emitted from a source at 288K than if they were emitted from a source at 255K.
- The source at 288K that is emitting more total energy at 15 μm is not emitting higher-energy 15 μm photons, it is just emitting more of them.
- The difference between the two curves in the graph above is just that a 288K source emits more photons at all wavelengths, compared to the 255K source. The 288K source can do this because it has more energy (it's hotter!) that can be transformed into radiation.
When CO2 absorbs a 15 μm photon in the atmosphere, it has no way of knowing if that photon was emtited from the surface at 288K, a kilometre away at 270K, or a metre away at 255K. It is just another 15 μm photon carrying the same amount of energy that every other 15 μm photon carries. And that amount of energy just happens to fit nicely into the different energy states that CO2 likes, so it is easy for CO2 to absorb it.
So, the CO2 will absorb the photon, and that heat is added to the local atmosphere, and it does not matter if the location where it is absorbed is warmer or colder than where the photon was emitted.
- We're coming out of the Little Ice Age
Eclectic at 00:29 AM on 19 December, 2021Atom @75 , when you look at the general atmospheric CO2 level, as demonstrated at Mauna Loa Hawaii, you see a large annual fluctuation cycle. The fluctuation is so large, that it dwarfs the quite small & brief reduction in fossil fuel combustion that occurred during the early phase of the Covid-19 pandemic. The pandemic-related signal is lost among the regular annual cycle events.
Certainly, for us humans the psychological & financial impact of the pandemic appears very large - but the total output of our CO2 emissions was only minimally altered.
Interesting is John Hartz's linked article @74. As I understand it, the mainstream view is that the causation of the LIA [Little Ice Age] was a combination of increased volcanic eruption of global-dimming aerosols, plus some episodes of reduced solar output. The new suggestion of oceanic changes (in the AMOC of the North Atlantic) being a major contributor to the LIA, seems a bit of a stretch when considering simultaneous cooling of the extensive Pacific & Southern oceans. But perhaps the authors Lapointe et alia can supply plausible quantification?
- We're coming out of the Little Ice Age
John Hartz at 02:26 AM on 18 December, 2021Suggested supplemental reading:
Scientists discover ‘surprising’ cause of Europe’s little ice age in late medieval era
Change in ocean currents – similar to phenomena seen today – likely cause behind substantial cooling, US scientists say.
by Harry Cockburn, Climate, The independent (UK), Dec 16, 2021
https://www.independent.co.uk/climate-change/news/little-ice-age-ocean-currents-b1976776.html
- It's albedo
blaisct at 05:08 AM on 15 December, 2021Once again thanks for your comment (MA Rodger and the editor) and the additional papers on the subject. I will try to do better with the links.
The earlier data I was referring to was earthshine 10 years and CERES 10 years which showed that the data for the earths albedo was very noisy and flat. The flat part was what was expected for anthropogenic greenhouse gas , AGH, global warming. My initial understanding of AGH radiative forcing was that AGHs absorbed radiation (got hot) and that the higher the AGH concentration (at constant radiation) the more heat it could hold back thus the temperature would increase but the energy in vs out of the zone where this occurred would be the same (albedo would be flat). My understanding has been expanded to include: AGHs hotter temperature will reduce humidity and thus reduce cloud cover, expose more earth surface to the sun thus reduce earths albedo; therefor, albedo vs time for AGHs may not be flat.
The new (new to me) data I sited Earthshine 20 years showed a decrease albedo from both earthshine and CERES data – my only interest is this report was the agreement with earthshine an CERES data. The editor’s link CERES 20 years 1 and another link CERES 20 years 2 provided a lot more CERES data with different analyses. These three papers are the first time I have seen data showing a decrease in albedo (increase in TOA radiation) vs time. If all climate change was due to AGHs this graph would be flat. Using the CERES 20 years 2 graph for TOA radiation out. (of the three links I chose this one because it has the In Situ data (earth surface temperature)) one can see the good correlation between In Situ data and CERES data

Figure 1
“Comparison of overlapping one-year estimates at 6-month intervals of net top-of-the-atmosphere annual energy flux from the Clouds and the Earth's Radiant Energy System Energy Balanced and Filled Ed4.1 product (solid red line) and an in situ observational estimate of uptake of energy by Earth climate system (solid blue line). Dashed lines correspond to least squares linear regression fits to the data.”
. If there was any AGH global warming mixed In with the TOA (red) data it would have a slope lower than the In Situ data. The report CERES 20 years 1 did look for the AGH flat line signal and found it in the “Clear Sky” LW (long wave) data but nowhere else (1 of four graphs).
Two of these reports put a lot of emphasis on clouds decrease (new to me). (Decrease in cloud cover increased surface exposure to suns radiation and heats the earth more.) The report CERES 20 years 2 also found correlation to Water vapor, trace gases, surface albedo, as well as clouds. Both of these reports express doubts on the current understanding of climate change and make recommendation to further understand what is causing cloud cover to change.
While this new data is interesting and worth following up on it is still very noisy (low R^2) and another 20 years would be better.
I recognize that AGH global warming would promote other forcing including reduce clouds, reduced ice, reduced snow cover all exposing more surface to direct rays of the sun. Other man-made albedo changes can do the same thing. Here are two examples that may relate to the new papers.
Let’s start with the “heat island effect”, UHI. While the global warming from UHI’s lower albedo is small it does have observable effect on cloud formation, CERES 20 years 2.

“Figure 3
Attribution of Clouds and the Earth's Radiant Energy System net top-of-atmosphere flux trends for 2002/09–2020/03. Shown are trends due to changes in (a) clouds, (b) surface, (c) temperature, (d) combined contributions from trace gases and solar irradiance (labeled as “Other”), (e) water vapor, and (f) aerosols. Positive trends correspond to heat gain and negative to loss. Stippled areas fall outside the 5%–95% confidence interval. Numbers in parentheses correspond to global trends and 5%–95% confidence intervals in W m−2 decade−1.”
When air rises from a UHI it is hotter than the incoming air without a source of moisture to saturate it; so, it leaves as dryer air. This air generally rises and moves to the east. Look at figure 3 (a) and see the lower cloud formation change off the coast of east USA, Tokyo, and downwind Europe. With time (1880-2021) the UHI does not get hotter but it gets bigger thus the volume of low moisture air gets bigger. I am not going to argue the significances of the albedo part of UHI other than to recognize it is lower than 1 W/m^2 but not zero. What UHI is not given credit for is what happens downwind to this hotter low humidity air. Does it cool the ocean, reduce the snow line, melt ice, or reduce the cloud cover down wind, since this hot dry air should rise the clouds should be the first target. I can also see a chain of events: Hot low moisture air (from AGHs, UHIs, or other land changes) rises and go downwind, reduces cloud cover, over water the sun heats the ocean, the hotter ocean currents circulate to the poles, and melt some ice.
I’ll leave the quantification of this observable (figure 3 (a)) new (to me) correlation to others. A new UHI contribution to GW will be the albedo effect + the lower cloud effect + any other.
Second, is land use changes such as forest to crop or pasture land or grass land to crop land. Albedo decrease in grass land to crop land change is documented in Grass to Crops. Forest to crop land change increase in albedo is documented in Forest to Crops. Over 205 years the paper Global albedo study calculates that all the pluses and minuses add up to little change in albedo from land use changes. It is assumed (by me) that decreased albedo of a parcel of land means an increase in temperature and vs/vs. The study Amazonia Forest to Crops shows that increasing albedo does not always mean cooler temps. This report shows that when rain forest was replaced with crop land that the temperature increased, the rain decreased, and the cloud cover decreased. The Figure 3 (e) above shows bright red spot for “water vapor” (I assume that is change to lower humidity) in Amazonia. This is not an uncommon effect from replacing forest with crop or pasture land. The report Forest study observes that forests vs crop/pasture conversion gets warmer as the conversion gets south of 35’N latitude.
This unintuitive (to me) observation that an increase in albedo does not always result in a decrease in temperature can be explained by moisture. The resulting temperature depends on a constant enthalpy (total heat in the air= gases + moisture). Enthalpy is usually determined by the albedo (higher albedo lower enthalpy vs/vs); therefore, land exposed to the same albedo (enthalpy) can have a wide range of temperatures depending on the moisture (relative humidity) of the albedo (enthalpy). This relationship has been captured in a psychrometric chart,
(Sorry for the poor quality of this chart)
Example of a rain forest conversion to crop land: Start out with a rain forest at 25’C (bottom scale) go straight up to 90% humidity curve; this is our hot humid rain forest. If we convert this rain forest to crop land with a higher albedo, we move to a lower enthalpy line (anyone will do). The constant enthalpy line run diagonal (upper left to lower right). If the moisture is maintained at 90% the temperature will drop as expected for the higher albedo. Following the same enthalpy line (same albedo) go to a lower humidity curve that may result (and does in Amazonia) and one will see the temperature will increase (even to above the starting rainforest temperature at very low humidity).
A concern is how NASA and the IPCC pair surface temperature data with relative humidity and albedo. The three all connected in enthalpy. A misunderstanding of climate change could occur if Amazonian (rain forest to crop land) high albedo, high temperature, lower humidity type data was included in correlations with Canadian (forest to crop land) lower albedo, cooler temperatures, high humidity, type data. Does anyone know if this has been looked at? The report CERES 20 years 1 has looked at ocean enthalpy correlations. I have not seen any land enthalpy data. - 2021 SkS Weekly Climate Change & Global Warming News Roundup #49
swampfoxh at 04:45 AM on 9 December, 2021I noticed that, so far, no one on this thread has commented on the present number of domestic bovines (1.544 billion, world-wide) that, lined up, nose to tail, would wrap the planet at the equator...(along with humans)... another hundred times.
Is industrial animal agriculture off the table of discussion and I'm just not aware that contributors to this site consider this topic of little concern? I am a participant in a peer review of a new study on animal agriculture's impact on the climate. It is, frankly, a shocking piece of work. The peer reviewed references supporting the study are thirty-five pages long. Essentially, industrial animal agriculture and its products are shown to be responsible for 34% of GGEs and another average 33% of at least eight crucial environmental problems: desertification, deforestation, europhication/contamination of fresh and salt waters, wild animal and plant habitat loss, species extinction, risky land use conversions, a number of human health maladies (beyond heart, artery and genetic malformation), outsized fresh water use... and refrigeration/freezer energy usage/transport, storage, waste disposal and spoilage.
Curiously, the outlawing of industrial animal agriculture would be the shortest route to a significantly measurable reversal of adverse climate change, because conversion to a plant based diet could be made simultaneous to the elimination of animal agriculture...making the transition essentially painless, (some may say: tasteless).
We expect the study to be published in mid-spring 2022. Until then, is this topic worth an in-depth discussion on this site?
- 2021 SkS Weekly Climate Change & Global Warming News Roundup #49
michael sweet at 23:37 PM on 5 December, 2021The Guardian has an article that says the International Energy Agency, IEA, projects that 95% of new electricity generating capacity worldwide from today to 2026 will be renewable energy.
Renewable energy is being built out because it is now cheaper than fossil fuels almost everywhere. This winter coal, gas and oil have increased greatly in price while renewable energy has only increased a little. Hopefully businesses will increase installation of renewable energy to save money. It will help with the climate issue. Every kilowatt generated by renewables is less generated by fossil fuels.
Another article stated that one of the primary bottlenecks for wind energy was obtaining permits to build. Governments can speed up the permitting process to increase renewable energy.
- It's the sun
cph at 22:01 PM on 9 November, 2021HK@1292 - "BTW, if clouds and snow/ice changed by themselves and not as a feedback to warming caused by GHGs, we wouldn't get a cooling stratosphere..."
--- I did not understand your last sentence. I am of the opinion that, for example, a changed cloud albedo cannot be explained by a rise in temperature alone. Changes and anomalies in global mean cloud cover can also be caused by fewer (sulfate) aerosols or expanding deserts (dry regions become drier).
https://www.carbonbrief.org/satellite-data-reveals-impact-of-warming-on-global-water-cycle

Evaporation increases by + 2.3 mm / year, which is not fully compensated for by increased precipitation of + 1 mm / year. A decreasing runoff through the rivers of -1.01 mm / year and a falling groundwater level of -0.75 mm / year quantify the drainage of the continents. This drainage (through drained bogs, wetlands, groundwater, aquifers, canalization of rivers and a constantly growing sealing of urban areas) is just as man-made as the CO² emissions, rising temperatures and the resulting higher evaporation. Too little H²O in desert regions and the earth's atmosphere, which in summer extend through droughts up to the Arctic Circle, are a temperature driver. Too much CO² is just as warming as too little H²O. Less evapotranspiration -> less cloud albedo -> higher incoming radiation energy and record temperatures on the earth's surface -> even faster drying out with even higher temperatures - imho, similar to the ice-snow albedo, form a vicious circle.
The authors estimate a "statistically significant" increase in evapotranspiration of around 10% above the long-term mean (corresponds to a temperature increase over land areas of ~ + 1.44 ° C). During the same period, precipitation only increased by 3% and global river runoff decreased by 6%.
---
What is noticeable here is a simultaneous decrease in relative humidity and cloudiness, which certainly correlates with a general increase in the number of hours of sunshine.

")
- SkS Analogy 25 - Emissions vs Accumulation
cph at 07:39 AM on 7 November, 2021michael sweet@15
"Where do you plan to obtain 1630 km3 of water for your wild scheme?"
-— Of course, it is initially only about the theoretical possibility of global evaporating such an enormous amount of water(1639km³) in a 9.2 million km² of desert - in response to Jim Eager's@13 claim - which I doubt: JE: - "it has to do with the fact that you can not directly increase the amount of water vapour in the atmosphere..."
-— But if you want to bring additional water into the Nile and the Sahara, there are still options that have not yet been practiced. To do this, you have to travel to the source of the Nile - Lake Victoria (68,000 km²). Cover a 10% of the lake area with photovoltaics to supply the megacities on the shores of the lake with renewable energy.
The surface of the lake evaporates about 1.5m³ per m² per year - so that the PV means that about 10km³ of water per year remain in the also somewhat cooler lake and generate additional GWh of electricity in the dams on the long path of the Nile, but also enable additional agriculture. You can multiply this amount on the many other lakes and dams of the Nile, but 1639km³ for the Sahara alone is naturally utopian. BTW ~1639km³ of water is needed by plants to sequester ~10Gt of CO²/year.
MS: - "Farmers already evaporate as much water as they can. Little excess water remains anywhere in the world."
-— Farmers evaporate as much water as is available to them. In many regions, however, this becomes less and less due to pumped-out groundwater in summer - and the land temperatures that are ~1.5 ° C higher inevitably require ~10% more evaporation and water.
Desertification and water scarcity is not a joke for many region with arid, semi-arid and continental climate- to intensify the water cycle over these land areas is a good idea. Water and rain retention a way to counteract the decreasing mean global relativ humidity over land areas. Even if the water vapor content of the atmosphere stays more or less the same - increased latent heat flux to the atmosphere = less sensible heat and cooling at the surface where we live. - To meet America’s Paris pledge, climate policy Avengers must assemble
Nick Palmer at 21:55 PM on 25 September, 2021The point of a fee and dividend system is NOT to raise any revenues, but to make products and processes which produce high levels of greenhouse gas emissions more expensive to buy than the cleaner greener alternatives. That is what the fee should be set to achieve - nothing else. The dividend part is what would make the fee acceptable to the voting millions.
The concept can get corrupted by left wingers who want to see it as a 'back door' way of taxing the rich, but dividend'ing ALL revenues back to the public, equally divided up per capita, has numerous advantages, not least that it would require virtually no complex administration, but primarily that it would cushion the less well off against the initial price rises that would follow the introduction of such a fee. Low income people and the 'poor', at least those who are not high producers of greenhouse gases, would receive the equivalent of a 'citizen's income' thus welfare expenditure could be reined back a little.
The amount going back to 'the rich' as a percentage of the total revenue raised would, in actuality, be quite small because - duhhr - there are far fewer 'rich' than poor. With no discrimination based political ideology it would make the fee and dividend far more likely to be voted for by everybody, not just the left. It would also doubly reward those rich who already endeavour to live a low carbon lifestyle - yes! they do exist and so do the poor who choose a high carbon lifestyle too...
Everybody getting back the same dividend should blunt any political objections based on the idea that government just wants to tax people to raise revenues, and the insinuations that the reasons given for raises are just fig leaves covering up the real intent.
The fee should put 'the market' back on track, after 200 years+ of derailment, by acting as what economists call a price signal protecting 'the commons'. Humankind's treatment of 'the commons' as a 'free' resource to be used and abused is just about the sole reason for pollution, over exploitation of natural resources, bio-diversity loss etc. Price in the cost of using the commons and get the accountants to put those costs onto the financial bottom line of corporations and the world would transform itself at lightning speed without any need for heavy handed government or no need to restrict peoples' 'freedoms with authoritarian regulations.
Get the great mass of the public willingly 'voting with their wallets' for the newly cheaper (and more profitable) green products and services and, more importantly, rejecting the newly more expensive 'carbon heavy' alternatives, and the job will get done by the 'invisible hand' of the market astonishingly quickly, effectively and efficiently whilst also partially addressing excessive income inequality and providing a 'food, shelter and warmth' safety net for the very poorest and most deprived.
This would set off an extraordinarily powerful change in consumer behaviour almost overnight and would render quite a lot, possibly all, of the 'trillion dollar green initiatives' unnecessary. - It's albedo
Bob Loblaw at 12:52 PM on 9 September, 2021Coolmaster:
Little of your most recent comment has passed moderation. In what little remains, you double-down on your claim of a strong cooling effect for clouds. Let's examine some actual science.
Note that in comment 70, although I said that the diagrams you provided in comment 69 were "a useful expansion", I also noted that "summary diagrams are summary diagrams - not detailed models."
First, you claimed in #71 that 1% increase in evaporation will lead to a 1% increase in clouds, and you have repeatedly claimed that increasing cloud has a cooling effect. You also said "I look forward to your criticism and assessment", so let's see if you really mean that.
We will start with the consequences of an increase in evaporation, and we'll limit it to the land surface you have talked about (although it doesn't really make any difference to what I will present). What happens when we manipulate surface conditions to increase evaporation?
- Atmospheric water vapour will increase above that surface.
- The atmosphere will probably move that water vapour away from the surface, either vertically (convective mixing) or horizontally (advection due to wind)..
- If conditions are suitable, that extra water vapour may rise to the point where it condenses to form cloud, but this is not always the case. If it does form cloud, the location may be local, but it is more likely to be a long way away.
- As a consequence of increasing evporation, the location where the evaporation occurs will also see less thermal energy transfer to the atmosphere, so temperatures are also affected. As a result, we see changes in both temperature and humidity, and these changes will be carried downwind.
- Downwind, the changes in temperature and humidity will affect the energy fluxes in those other locations - possibly suppressing evaporation (because the overlying air is now cooler and more humid).
Now, if the additional water vapour forms cloud, we have to ask "what kind of cloud?". That depends on where and how the lifting of the air occurred which led to cooling and cloud formation. Cloud types vary a lot. Wikipedia has a nice discussion, and gives us this nice diagram:
")
So, will this "extra" humidity cause more cloud? Maybe. Maybe not. Maybe it will lead to a different cloud type. Maybe it wll lead to a similar cloud type, but at a different altitude. All of this will affect how radiation fluxes will be affected.
Coolmaster's argument then depends on claims that cloud cover will increase, and that the diagrams he has provided show the radiatove flux changes. Let us consider some of the possible radiative changes.
- A change in horizontal extent - but no change in any other cloud characteristics - will affect the ratios between clear sky and cloudy sky. This is easy to estimate.
- We may not have the same cloud type, though. Different cloud types have different radiative properties. High clouds tend to be thin, transparent, and let a lot of solar radiation through. They also may not behave as blackbodies for IR radiation.
- Low clouds are much less transparent. For IR radiation, two properties are important: cloud top temperature controls the IR emitted upward, while cloud base temperature controls the downward flux. Change the vertical temperature profile, or change the bottom or top heights of the clouds, and you change the IR radiation fluxes. This is not determined by cloud area.
None of these details are covered in the diagrams or discussion presented by coolmaster. I will repeat what I said before: summary diagrams are summary diagrams - not detailed models.
Can we find models that do include thse sorts of effects? Yes. I will dig back into two early climate change papers that were key developments in their day. They covered basics that more recent papers do not repeat, so they provide useful diagrams.
The first is Manabe and Strickler, 1964, JAS 21(4), Thermal Equilibrium of the Atmosphere with a Convective Adjustment.
Their figure 7a shows model results that cover different cloud assumptions:

Note that cloud type and height both have significant effects on the modelled radiative equilibrium. (Follow the link to the paper if you need more context.)
The 1964 paper was followed by another in 1967: Manabe and Wetherald, 1967, JAS 24(3) Thermal Equilibrium of the Atmosphere with a Given Distribution of Relative Humidity
They give two figures of interest: 20 and 21:

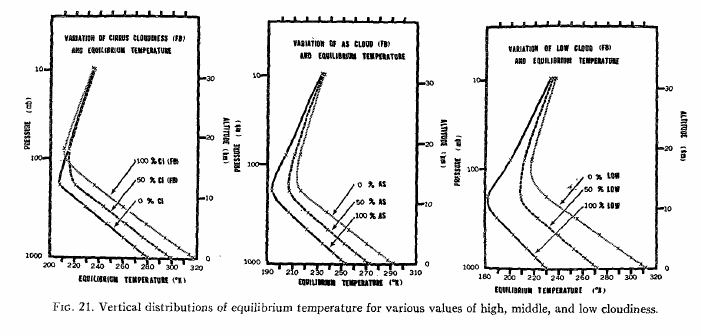
Again, follow the link to the paper for context (and perhaps larger views of the graphs).
These two figures show responses to changes in cloud amounts, for several different cloud types in their model.
- In figure 20, low and middle cloud have negative slopes (temperature as a function of cloud amount), while high cloud has a positive slope. Increasing high cloud has a warming effect.
- In figure 21, we see three diagrams of equilibrium temperature, for the same three cloud types. Each diagram shows the results for three different cloud amounts (0, 50, and 100%). The diagram on the left is for high cloud, and we see warmer tropospheric temperatures for higher cloud amounts. This is the opposite for middle and low cloud, where increasing cloud amount causes cooling.
So, we can see that climate science has know for over 60 years that different cloud types and heights have significant differences in their role in radiation transfer. The papers I have cited used a one-dimensional radiative-convective model, which is simple by modern standards. Current three-dimensional general circulation models incorporate even more vertical cloud processes, and add the horizontal dimensions that include the horizontal transport of water vapour I mentioned at the start of this comment. They generate cloud internally, based on physics, rather than assuming specific distributions - but the key message is the same:
Cloud amount, cloud type, cloud height, horizontal distribution - all are important in properly assessing the radiative effect of clouds.
Coolmaster's diagrams are nice pictures that help illustrate a few aspects of the complexity of clouds and atmospheric radiation transfer, but they are totally unsuited to the sort of predictive analysis he is trying to perform.
- It's albedo
coolmaster at 02:03 AM on 6 September, 2021@ MA Rodger
"500,000 cu km of annual global precipitation"
Humans can only influence evaporation over the oceans indirectly (via climate change) by higher temperatures and stronger, drier winds. The amount of precipitation over the sea is therefor also irrelevant because it cannot be held back there.
Over land, the average rainfall is only 100,000-120,000km³ - approx. 100xSLR. An intensification of the water cycle by at least 1% will also increase cloud formation over land by ~ 1%.
A share of ~ 8% of the SLR consists of the water that the continents lose every year. Wetlands are drained, glaciers, permafrost areas, groundwater and aquifers are juiced. This promotes the spread of deserts, which are generally characterized by the fact that there are few clouds, little precipitation, little plantgrow(CO² absorption) and little rH. A third of the land area (~ 50 million km²) is already desert and it is spreading rapidly.
After the last Pacific Northwest heat wave at the latest, it should be common knowledge that drought acts as a temperature driver.
The year-round retained amount of 1335km³ is mainly used & transpired in spring and summer after it has been stored in soil moisture and groundwater. Assuming that it is largely transpired through plant growth, an additional 4.9-9.8 Gt of CO² are extracted from the atmosphere every year.
This climate protection strategy may seem Spanish to one or the other - and that is exactly what it has been - for centuries. Equipped with sufficient global water cooling over land, the earth's temperature will fall - not rise !
SLR & global warming will remain a problem as long as neurotic, uncreative CO2 budget-oriented people determine the public's climate protection strategies.
This is also intended as a criticism and is addressed to the Intergovernmental Panel on Climate Change and climate science in general.
- The number of lives that clean energy could save, by U.S. state
Jds at 04:50 AM on 21 July, 2021Data graphs... Interesting... Fact sheets, do tell. Article by who? Really. Source links to a group that links it's source information back to itself.
C02 is not a poison until it reaches highly concentrated levels. Rarely happens.
.04% of our atmosphere is c02. .0016% of that .04% is manmade. Multiply the two figures together to get the % of the atmosphere which is manmade c02. That's .000064. If you added .000064% pink panther fiberglass to your outhouse your butt would still be cold in the winter.
Studies reveal!!! What studies? Oh, Yale. University. Must be smart kids there these days. Reading books. Looking at thermometers.
Been researching C02 detectors myself lately. Basic description for the most detailed I shall provide now.
Too housing contains filter mechanism. Bounces Electrons (little buggers) back and forth between electrode plates. Electrolytes (salt water? Potassium? Gatorade?) change c02 to o2 through oxidation (rust) and reduces (evaporates)... get ready far this... oxygen into water. O into H2O. Yup... water into wine as well I suppose. The electrodes are biochemically sensitive to these changes.
I'll have to look this convuluted one up again for further details. It didn't mention any silicone chips nor as usually typical the almighty laser.
Fancy thermometer at best. Get yours free shipping from Walmart for like $30.
You can't even find anyone who wants to admit being the inventor of these snake oil charms nor will you find any original patents. Yet hundreds of mostly fly by night companies sell them for prices up into the thousands.
Shows parts per million.
NASA has these million dollar detectors that shoot lasers from far above to hit the earth surface and I suppose eventually be picked up by some big Gatorade coated hunk of metal which detects out of each of the million parts that exist in the atmosphere... 400 are C02. Further calculations determine that we cased half of this.
Here is an interesting argument. It has been millions of years since the global temperature and C02 levels have been this high and man wasn't even around back then which proves man is the current cause!!! Most unintelligent argument to date. Who caused the high rates back then if we were not around? Wooly mammoth? Hairy hippos? It's like saying your daughter's boyfriend must not have worn a condom the last time they had sex because your great grandmother was pregnant at one time.
Please think before you make pointless arguments.
We humans if all in one spot on a globe shoulder to shoulder would not even be much of a pin point. Combine all of our biggest cities into one megalopolis... a small freckle on the on the face of ma Gaia.
Mother earth has made home for countless creatures... if we were to just add the ones we have yet to discover to the internet... google would overheat and break down from an overload. And yet we still search for even one or to life forms elsewhere.
Mother earth has survived subzero trips to the shore and hot lava baths. She is covered in worm poo and skunk diddle.
And you worry she will die from second hand smoke which has been circulating since the dawn of her birth.
Your numbers are baseless. Your charts disconnected. Your facts biased. Your proofs conjectured. Your projections assumed. Your own researched will lead you down rabbit holes that will have you as well ask questions to determine validity. Give it time and you find... fancy thermometers. People pointing lasers at silicone chips. Digital readings.
There are no valid reputable respectable people in the realm of all of our highest minds who can validate and properly explain the how function of your fancy thermometers. They just assume like you did that the producers knew what they were doing by way of high intelligence and education and not one in the line of them would ever attempt to decide or hoodwink. Nobody dares to question fancy thermometer for fear they will look unintelligent themselves.
And you can take my statements directly to any of our scientists. Then bring those kids to me. I would like to see their heads sink in sullen shame as we review all of the information available in the world about fancy thermometer... and here them admit to it's nonsense.
Nice charts. Splendid graphs.
Pretty fancy thermometers.
Now prove to me that our c02 without one shred of any doubt 100% caused the average number of tsunamis per year to go from 2 to 3.
Show me just one autopsy report stating cause of death was... air pollution.
Show me the beaches where brilliant scientists are dutifully lined up measuring constant instant by instant changing ocean depths and receding shorelines.
Show me that the number of facilities which extract atmospheric data from the air are evenly distributed across the world and not primarily clumped into rural areas. The ratio difference of such facilities between rural and non grows every year in favor of the rural. That in itself makes for apparant temperature anomalies.
Show me where climate summits, committees, activist gatherings and fancy thermometer operators ever saved or even improved the life of even one person. Common sense of a child would tell you if they spent one tenth of the time exploring ways to prepare ourselves for natural disasters that are unavoidable regardless of our activities (you do know such things exist?) they would save many lives. Just one tenth of your focus shifted toward a more fruitful activiy... it is not much to ask.
Show me empirical evidence and precision studies prove that a two degree raise in global temp makes an unstable earth when global temperates rise and fall many multiples of degrees higher and lower within seasons (Siberia holds 100° record differential), months, weeks, days, hours... any increment of time. Regionally two degree shifts happen within seconds... why can you not make a connection to calamity in these instances? Why do you refuse to admit 2° shifts over a century might be a small % normal. bet if I told the right activist that scientists predict an unpredicted ten degree shift in average global temperature within the hour... those activist would fall in panic, run out the back door with their fancy thermometers pass out from the frantic exhaustion of getting their ownselves heated over a common occurrence.
Show me the credentials of each and every root source of every last statistic you have blind faith in. I would like to know if fancy thermometer makers might not be pushing a few numbers. Bet your bank account some are.
Show me how C02 is killing anything currently. Start looking for actual single file individual case examples in the anals of all our history of even one person who passed out from too much carbon dioxide... I'll give you the rest of your life to produce such papers... good luck. Before you can do that I will prove c02 allows for more life to flourish.
Show me a year that has not had both record high and low temperatures. Of course we must remember readings are not evenly dispersed yet and the lasers attached to satellites are yet to be a cover all.
Show me again the ice age many of the scientists from the 70's were warning us about... where is it? Guess that concept was beginning to sell less copies so they had to change the format or big guv who has an interest in people who have a concern the main public is following will stop funding them... seriously I want you to reread that last statement a few times... let it sink in. Think about the implications and how very real they might we'll be.
Show me causation, not correlation. The person did not get a sun tan on a hot day because a coconut dropped on their head that day.
And really a bunch of the information I may come up with is questionable as well. Who knows what's right? They give us estimates, rounded figures, apple orange comparisons. Coming up with pictures of prehistoric creatures bases on fragments of a single jawbone... then tell us approximately how millions of years since jawbone beast roamed earth... somewhere within this multimillion year range... and the temperature at that time was... and their favorite food was... and they squatted when they pooed fluffy spinich like clumps. Really. They know these facts due to the data represented by their Walmart C02 detectors.
Suckers are not born every minute. They develop through passages of time by way of emotional stimulations. They are targeted. Their opinions are advocated, supported and fed so to break down their defenses. Once trust is gained... (after all, fancy thermometer man has my same concerns therefore his concerns are for me personally as well)... they strike.
And you buy... in full... pun intended (aren't most all?).
And I buy as well... in part.
I wish not to find you reGret the weather... the Thunder... the iceBerg. Us grown ups are patiently waiting for your heroes... your people of the year... fan favorites... to grow up yourselves and drop the hatred and blame. Please stop pointing to the minute spinach stains on the teeth of others when immense festering cavities are being ignored.
8% of human c02 production counted is through breathing. So you can't get us to net zero anyway unless you well... kill us. A % of our CO2 production which makes up part of the statistical reports you adhere to... are from farm animals... eating, pooing, breathing... existing. Us meat eaters are trying to be rid of them as well for your satisfaction but only so much can fit on the plate.
Getting to NetZero is impossible. Waste of time anyway.
Proving that the .00005% is the only factor in 2° rise in the last century is harder than proving the chickens furting in a tornado caused more property damage.
Please be useful.
Activism is well intentioned griping. Would you like reward for it? I don't ever think I found any activist of any cause who enriched our environment beyond a sprinkling... especially the griping or as as I like to call the negative activist. Even the great MLK who was a positive activist is predominantly known by his most endearing followers by just four words... "I had a dream" sad how the majority of the world only knows this much of the man. The four words can be attributed to anything. Further research will educate a follower his dream was basically that some day all races will get along... not to insult but many have said same message with less recognition. It was a world wide sprinkling recognized best because of his ability to sell the product of his speech with the decor of his character. Charisma was the salesman. Same for the young swedish girl with face twisting sputtering gripe furiously. If said in a calm sensible tone she would have been ignored. So I see the point of bringing out the personality to sell the product. A 90 yo business owner/salesman friend told me to be successful you must sell the sizzle not the steak...
I will not abide to that when it comes to you and this subject you invested in. Instead I simply ask you...
where's the beef?
- It's not bad
Eclectic at 19:07 PM on 16 July, 2021TVC15 @390 :-
Permit me some general waffle : my comment is that you should be half'n'half ~ half optimist, half pessimist. The global situation is going to get bad but not catastrophic. Yes, we are going to blow straight past the 1.5 degree mark in global surface temperature rise since pre-industrial. The rise already (over 170 years) is about 1.1 degrees, and this makes a mockery of any contrarian who opines that the CO2-doubling Climate Sensitivity is less than roughly 2.0 degrees (and seems most likely to be in the 2.5 to 3.0 degree range at equilibrium ~ which also fits with non-historic data e.g. the paleo data).
With extraordinarily good management, we might conceivably halt the rise by 2.0 degrees . . . but our political track record so far is poor.
It is not just the politics, but technological advances which are still required. Sure : cheaper solar & wind technologies are coming, but we really should have started seriously developing these at least 10 years before we actually did. (But the past cannot be changed.)
The 2050 date for "carbon neutral" will require more than the present-day solar & wind, even at half of today's prices. Energy storage is absolutely necessary ~ and I am looking to bulk storage of electrolytic hydrogen. Hydrogen to provide electricity via fuel cells (at small scale) or steam-driven turbines at large scale (possibly combined-cycle?).
The second leg to stand on, is a hugely-increased supply of liquid hydrocarbon [octane / kerosene / diesel types] produced from non-fossil feedstocks, by means of catalytic / enzymatic / fermentational technology. In brief, we need to produce these hydrocarbons at a scale little short of present-day fossil fuel consumption. For a great amount of our energy usage, these hydrocarbons are necessary ~ and I suspect it will take many decades after 2050 , before we could replace such hydrocarbon fuels.
Extinction of a very large slice of animal/plant species . . . is arguable. Extinction of the human race ~ certainly impossible. The casualty rate may be high in the future ~ but extinction, no way. Mass migration of "climate refugees" will increase as sea level rise and heat waves occur, and there will be major social disruption. "Interesting Times" , as the old Chinese saying goes.
- Climate's changed before
Bob Loblaw at 11:17 AM on 13 July, 2021TVC15.
Your interlocutor seems to be using a combination of "Climate has changed before" (this thread) and "we're coming out of an ice age", which is an odd twist on "we're going into an ice age". Maybe he's confused with "we're coming out of the Little Ice Age".
There is a post here at SkS that talks about sea level over the past 150,000 years. It includes the following graph of sea level, covering the last glaclal/interglacial cycle:

I do not see anything on that graph to support his claim that sea level is normally 4 to 14m higher than now during interglacials. The peaks of that graph may be a touch higher, but there sure isn't a steady period of higher sea levels in the last interglacial. I suspect his claim is completely bogus, but you could always try to get him to provide his source of data.
On very long time periods, ocean basin size/shape changes have dramatic effects on relative sea level. On short time scales (glacial/interglacial cycles), local sea level in areas subject to the weight of ice have serous effects due to isostatic depression and rebound.
Of course, the answer to "why should this interglacial be different?" is "because we're adding CO2 to higher levels than seen in hundreds of thousands of years, and we're looking at rising temperatures and conditions not seen in past interglacials".
- The cool, lush Pacific Northwest roasts in Death Valley-like temperatures
Bob Loblaw at 04:37 AM on 3 July, 2021I just found this nice little video on the Lytton fire and weaher conditions on CBC's web page:
- The New Climate War by Michael E. Mann - our reviews
Nick Palmer at 09:33 AM on 23 June, 2021Just in case you lot are still resisting the idea that the politics relating to climate science have become extremely polarised - in my view to the point where ideologues of both the left and right think it justified to exaggerate/minimise the scientific truths/uncertainties to sway the democratically voting public one way or the other - here's a video blog by alt-right hero and part of the original Climategate team who publicised the emails, James Delingpole basically saying that 'the left' have infiltrated and corrupted the science for the purpose of using political deception to seize power for themselves.
https://www.youtube.com/watch?v=866yHuh1RYM
Deconstruct or follow up Delingpoles' rhetoric elsewhere and you will find a helluva lot of intelligent articulate people who believe that the public's environmental consciences are being exploited by closet socialist forces to deceive them, using 'fear porn', into voting for policies which they otherwise wouldn't consider voting for, in a dark strategy to bring in some form of latter day Marxism. They insinuate this has got its tentacles into climate science which they assert has led to the reality of the science, as presented to the public, being twisted by them for political ends. It's absolutely not just Greenpeace, as I already said, who've 'gone red' to the point where it has 'noble cause' corrupted their presentations of environmental matters and, crucially, the narrow choice of solutions they favour - those which would enable and bring on that 'great reset' of civilisation that they want to see. It's much, much bigger than that.
I think we are seeing a resurgence and a recrystallisation of those who got convinced by Utopianist politics of the left and free market thinkers of the right taught at University - Marxist-Leninism, Ayn Rand, Adam Smith etc. Most of those students eventually 'grew up' and mellowed in time, leaving only a small cadre of incorrigible extremists but who are now, as the situation is becoming increasingly polarised politically, revisiting their former ideologies. In essence 'woking' up. I submit that the real battle we are seeing played out in the arena of climate matters is not between science and denialism of science - those are only the proxies used to manipulate the public. The true battle is between the increasingly polarised and increasingly extreme and deceitful proponents of the various far left and right ideologies and their re-energised followers.
It is now almost an article of faith, so accepted has it become, amongst many top climate scientists and commentators, that 'denialism' is really NOT motivated by stupidity or a greedy desire to keep on making as much money as possible but is rather a strong resistance to the solutions that they fear are just 'chess moves' to bring about the great Red 'reset' they think the 'opposition' are secretly motivated by.
Here's an excellent article by famous climate scientist Katharine Hayhoe identifying those who are 'solutions averse' as being a major factor in denialism. It touches on the 'watermelon' aspect. You can turn a blind eye to what I am saying if you want, but in that case you should also attack Hayhoe too - but don't expect many to applaud you...
https://theecologist.org/2019/may/20/moving-past-climate-denial
Also try this: https://www.thecut.com/2014/11/solution-aversion-can-explain-climate-skeptics.html
https://today.duke.edu/2014/11/solutionaversion
I think some people who fight climate science denialism still have the naive idea that just enlessly quoting the science to them, and Skepticalscience's F.L.I.C.C logical fallacies, will make denialists fall apart. I too used to think that if one would just keep hammering away, eventually they would give up. Anyone who tries this will find that it actually does not work well at all. Take on some of the smarter ones and you will rapidly find that you are, at least in the eyes of the watching/reading/listening public, who are the only audience it's worthwhile spending any time trying to correct, outgunned scientifically and rhetorically. That's why I don't these days much use the actual nitty-gritty science as a club with which to demolish them because the smarter ones will always have a superficially plausible, to the audience at least, comeback which looks convincing TO THE AUDIENCE. Arguing the science accurately can often lose the argument, as many scientists found when they attempted to debate such notorious, yet rhetorically brilliant sceptic/deniers such as Lord Monckton.
I haven't finished trying to clarify things for you all but right back at the beginning, in post#18, I fairly covered what I was trying to suggest is a more realistic interpretation of the truth than the activist's simplistic 'Evil Exxon Knew' propaganda one. In short, most of you seem to believe, and are arguing as if, the science was rock solid back then and that it said any global warming would certainly lead to bad things. This is utterly wrong, and to argue as if it was true is just deceitful. As I have said, and many significant figures in the field will confirm, I've been fighting denialism for a very long time so when denialists present some paper or piece of text extracted from a longer document as 'proof' of something, I always try and read the original, usually finding out that they have twisted the meaning, cherry picked inappropriate sentences or failed to understand it and thereby jumped to fallacious conclusions - similarly I read the letters and extracts that Greenpeace used and, frankly, either they were trying deliberately to mislead or they didn't understand the language properly and jumped to their prejudiced conclusions and then made all the insinuations that we are familiar with and that nobody else seems be questioning much, if at all. The idea that Exxon always knew that anthropogenic climate change was real (which they, of course, did) AND that they always knew that the results of that would be really bad and so they conspired to cover that bad future up is false and is the basis of the wilful misreading and deceitful interpretation of the cherry picked phrases, excerpts and documents that has created a vastly worse than deserved public perception of how the fossil fuel corporations acted. Always remember that, at least ideally, people (and corporations) should be presumed innocent until proven beyond reasonable doubt to be guilty. Greenpeace/Oreskes polemics are not such proof. Their insinuations of the guilt of Big Oil is just a mirror image of how the Climategate hackers insinuated guilt into the words of the top climate scientists.
Here's a clip from my post#18
NAP: "When activists try to bad mouth Exxon et al they speak from a 'post facto' appreciation of the science, as if today's relatively strong climate science existed back when the documents highlighted in 'Exxon knew' were created. Let me explain what I think is another interpretation other than Greenpeace/Oreskes'/Supran's narratives suggesting 'Exxon knew' that climate change was going to be bad because their scientists told them so as far back as the 70s and 80s. Let me first present Stephen Schneider's famous quote from 1988 (the whole quote, not the edited one used by denialists).
S.S. "On the one hand, as scientists we are ethically bound to the scientific method, in effect promising to tell the truth, the whole truth, and nothing but – which means that we must include all doubts, the caveats, the ifs, ands and buts. On the other hand, we are not just scientists but human beings as well. And like most people we’d like to see the world a better place, which in this context translates into our working to reduce the risk of potentially disastrous climate change. To do that we need to get some broad based support, to capture the public’s imagination. That, of course, means getting loads of media coverage. So we have to offer up scary scenarios, make simplified, dramatic statements, and make little mention of any doubts we might have. This “double ethical bind” we frequently find ourselves in cannot be solved by any formula. Each of us has to decide what the right balance is between being effective and being honest. I hope that means being both.""
Stephen Schneider, as a climate scientist, was about 'as good as it gets' and he said that in 1988. Bear in mind that a lot of the initial framing to prejudice readers that 'Exxon knew' used was based on documents from considerably longer ago, so what are the activists who eagerly allowed themselves to be swept up in it until no-one questioned it turning a blind eye to? It's that the computer models of the time were extremely crude because computer technology back then was just not powerful enough to divide Earth up into enough finite element 'blocks' of small enough size to make model projections of much validity, in particular projections of how much, how fast and how bad or how good... Our ideas of the feedback effects of clouds and aerosols back then was extremely rudimentary and there were widely differing scientific opinions as to the magnitude or even the direction of the feedback. The scientific voices we see in Exxon Knew tend to be those who were suggesting there was lot more certainty of outcome than there actually was. That their version has been eventually shown to be mostly correct by a further 40 years of science in no way means they were right to espouse such certainty back then - just lucky. As I pointed out before, even as late as the very recent CMIP6 models, we are still refining this aspect - and still finding surprises. To insinuate that the science has always been as fairly rock solid as it today is just a wilful rewriting of history. Try reading Spencer Weart's comprehensive history of the development of climate science for a more objective view of the way things developed...
ExxonMobil spokesperson Allan Jeffers told Scientific American in 2015. “The thing that shocks me the most is that we’ve been saying this for years, that we have been involved in climate research. These guys (Inside Climate News) go down and pull some documents that we made available publicly in the archives and portray them as some kind of bombshell whistle-blower exposé because of the loaded language and the selective use of materials.”
Look at the phrases and excerpts that were used in both Greenpeace's 'Exxon Knew' and 'Inside Climate News's' exposés. You will find they actually are very cherry picked and relatively few in number considering the huge volumes of company documents that were analysed. Does that remind you of anything else? Because it should. The Climategate hackers trawled through mountains of emails - over ten years worth - to cherry pick apparently juicy phrases and ended up with just a few headline phrases, a sample of which follow. Now, like most of us now know, there are almost certainly innocent and valid explanations of each of these phrases, and independent investigations in due course vindicated the scientists. Reading them, and some of the other somewhat less apparently salacious extracts that got less publicity, and comparing them with the 'presented as a smoking gun' extracts from Greenpeace/Oreskes/Supran etc I have to say, on the face of it, the Climategate cherry picks look more evidential of serious misdeeds than the 'Exxon Knew' excerpts. Except we are confident that the Climategate hackers badly misrepresented the emails by insinuating shady motives where none were. Why should we not consider that those nominally on the side of the science did not do the same? Surely readers here are not so naive aas to believe that everyone on 'our side' is pure as the driven snow and all those on the 'other side' are evil black hats?
Here's a 'top eight'
1) Phil Jones "“I’ve just completed Mike’s [Mann] Nature trick of adding in the real temps to each series for the last 20 years (i.e. from 1981 onwards) and from 1961 for Keith’s [Briffa] to hide the decline.”
2) “Well, I have my own article on where the heck is global warming…. The fact is that we can’t account for the lack of warming at the moment and it is a travesty that we can’t.” [Kevin Trenberth, 2009]
3) “I know there is pressure to present a nice tidy story as regards ‘apparent unprecedented warming in a thousand years or more in the proxy data’ but in reality the situation is not quite so simple." Keth Briffa
4) Mike [Mann], can you delete any e-mails you may have had with Keith [Trenberth] re AR4? Keith will do likewise…. Can you also e-mail Gene and get him to do the same? I don’t have his e-mail address…. We will be getting Caspar to do likewise.” [Phil Jones, May 29, 2008]
5) “Also we have applied a completely artificial adjustment to the data after 1960, so they look closer to observed temperatures than the tree-ring data actually were….” [Tim Osborn, Climatic Research Unit, December 20, 2006]
6) “I can’t see either of these papers being in the next IPCC report. Kevin [Trenberth] and I will keep them out somehow, even if we have to redefine what the peer-review literature is!” [Phil Jones, July 8, 2004]
7) “You might want to check with the IPCC Bureau. I’ve been told that IPCC is above national FOI Acts. One way to cover yourself and all those working in AR5 [the upcoming IPCC Fifth Assessment Report] would be to delete all e-mails at the end of the process. Hard to do, as not everybody will remember it.” [Phil Jones, May 12, 2009]
8) “If you look at the attached plot you will see that the land also shows the 1940s warming blip (as I’m sure you know). So, if we could reduce the ocean blip by, say 0.15 deg C, then this would be significant for the global mean—but we’d still have to explain the land blip….” [Tom Wigley, University Corporation for Atmospheric Research, to Phil Jones, September 28, 2008]
Please at least consider the possibility that Greenpeace, who have been deceiving the public about the toxicity and carcinogenicity of this, that and the other for decades (ask me how if you want to see how blatant their deceit or delusion is... showing this is actually very quick and easy to do) were, in a very similar way, and motivated by their underlying ideology, deliberately (or delusionally) misrepresenting innocent phrases to blacken names excessively too.
- The New Climate War by Michael E. Mann - our reviews
RedBaron at 14:25 PM on 20 June, 2021@77 One Planet Only Forever,
Thanks for the kind words and yes a socioeconomic "Square deal" (to borrow a phrase from Teddy Roosevelt) does indeed need addressed, simply to make sure bad actors don't ruin all the hard work we do. Holistic management considers systems with complex social, ecological and economic factors; management considers and plans in the whole, rather than each as separate. This applies at every level of management from the land manager himself to every level of government from local, regional, national, and even international. 100% with you there. We probably use different terminology, but the principles are overlapping for sure.
@ 78 michael sweet,
Great post. I would like to discuss a few things about it though.
1)It is important to know the study results claim they were measuring sequestered carbon, not fixed carbon. The fixed carbon numbers are much larger, but not stable. Decay of fixed carbon (biomass) will release CO2 as it is cycled in the labile carbon cycle. Stable carbon is sequestered into geological timeframes, even if eroded that carbon will generally turn up in sedimentary deposits rather than being released back into the atmosphere. It's an important destinction for climate scientists to understand. Only a fraction of fixed carbon gets sequestered long enough be considered sequestered in the soil, and that % has everything to do with the methodology and biology. Did you use the term "fixed" purposely? Do you think there is a flaw in their methods? Or was this an oversite on your part?
2) You mentioned hydrology, a subject obviously very important to agriculture. However, there is a nuance you might not know about. I don't believe I have ever posted this study here because the focus here is primarily CO2e. (I have posted it many other places as water is obviously critical to the land manager)
Effect of grazing on soil-water content in semiarid rangelands of southeast Idaho
Notice please that comparing different methods of grazing and even total rest (no grazing at all besides the odd insect or rodent), regenerative grazing has the highest soil water content! This is a function of water infiltration and holding capacity against the evaporation and transpiration rate. Soil biology and various types of carbon content have everything to do with this result. It explains the biophysical reason for the counter-intuitive results of even arid and semiarid grasslands still being capable of sequestering significant rates of CO2e. The biological community in the soil is in fact purposely using carbon compounds retrieved from symbiotic relationships with plants and animals to more effectively use the little water that does come annually. This results in the very counter-intuitive high rate that healthy semiarid grasslands actually sequester . Healthy arid and semiarid grasslands have far more soil carbon sequestration than even tropical rainforests! (although tropical rainforsts fix far more carbon into biomass) It is in fact their evolutionary fitness strategy that gave them the advantage over other vegetation and soil microbiology community types in dryer areas. There are limits to this of course, but surprisingly low amounts of rainfall are needed, once full ecosystem function is achieved.
On the other hand I do agree with your final statement. I actually do need to make more realistic estimates of carbon sequestration for widespread support. I am in fact trying to get some more good data on that as part of my Red Baron Project. I actually don't post everything about the project plans here, but be sure I am very aware of the need for better data and am working on finding creative ways to get that data.
- The New Climate War by Michael E. Mann - our reviews
Nick Palmer at 06:31 AM on 16 June, 2021I think you lot are trying to hard to prop up a very long standing meme, originated by Greenpeace and subsequently promoted by, IMHO, political forces not related to pure climate science. I've never said that Big Oil should have done what they did, just that their motivation to do it may not have been that which was attributed to them by that meme. FWIW, I think the true culpability of Big Fossil Fuel is not for resembling the activist meme of them being shadowy psychopaths intent on destroying the world for profit but rather for being like the punk in Dirty Harry who, when neither of them knew for certain whether there were any bullets left in the Magnum, recklessly took a chance and paid the price.
If you've ever seen that analogy used in the climate wars, I originated it. My argument to denialists back then was that, by analogy, 'denier punks' had a right to risk their own lives by believing that there were no climate change bullets left, or that possible low climate sensitivity meant that any bullet would be nearly a blank, but that they had a much greater responsibility to not take any view which would put everyobdy else in the world at risk if they were wrong. I had long discussions about this general concept with Greg 'What's the worst that could happen' Craven whose approach of risk analysis I still think is far superior at getting through to the majority of the public rather than the 'This is what the science says', 'Oh no it isn't', 'Yes it is', shouting match that the public arena is.
I came to my ideas from a lot of experience over several decades debunking 'ordinary' denialism, but I also found it quite often necessary to debunk alarmists too, who went much further than the peer reviewed science actually said. Alarmism gives deniers a lot of amunition to smear the actual science, in the minds of the public, by proxy. A lot of current denialism consists of holding up the silliest statements of extremists to ridicule, rather than attacking the science directly, but unfortunately that rebounds badly on the actual science in the public's view who have little way of knowing which of the very confident sounding sides are accurate or legit.
Long before John Cook started off the whole Denial 101 F.L.I.C.C initiative, I had been made well aware of the multiple deceptive rhetorical 'tricks' used by ordinary denialists to deny the peer reviewed science. I also became aware that the vast majority actually completely believed their position, whether it was the 'almost mainstream' luke-warmer position or the weirder 'against the second law of thermodynamics' pseudoscience types. What I did notice was that, say, in the comments of WUWT, virtually none of the former ever criticised the latter. It was only a very, very few, such as Mosher, who took on the real loonies. I also came to see that the reverse was also the case in environmentalist literature. Apart from a few such as myself, who has always tried to root out any mistakes, delusion or deceptions wherever they may be found, activist alarmism in publicly available media seemed to get a 'free pass' from those who normally argued the science, such as skepsci types. For what it's worth, I find it much harder to deal with activists, rather than with the more moderate 'denialists' as activist ideology isn't really based on a rational bullet-proof knowledge of the science, but rather on persuasive memes and Hans Eysenck's 'hobgoblins' to scare the public. I couldn't help noticing that BOTH sides used the same techniques of misdirection, cherry picking etc although, back then, it tended to be the more extreme - the incorrigibles of the denialist side - who did the lion's share of it. In the last few years, as the political aspects of the climate arena have suddenly popped out of the closet far more than ever before, and the sides have become ever more partisan, I'd say 'what lies beneath' the surface of people on all sides debating climate policy is surfacing.
I used to sit on my former Government's Energy panel, which was set up to deal with energy policy relating to climate science and the energy transitions required and I became pretty well connected with some significant movers and shakers in the climate science arena, both scientists, civil servants and media folk. For what it's worth, the panel also had representatives on it from gas and oil 'fossil fuel' corporations, plus the area electricity supplier. That's another reason why I'm virtually certain that the Greenpeace/Oreskes meme, that even some smart people seem to have swallowed hook, line and sinker, is a fair distance from the truth. The meme has a lot of the smell of simplified 'hobgoblins to sway the public' about it, rather than it being a completely accurate piece of historical reportage...
Anyway, it's been interesting to see the, in my view somewhat biased, kick-back from long term Skepsci followers. I think what I might do in due course is approach John Cook to see if we can arrange a Zoom meeting. He and Stephan Lewandowsky are right at the forefront of the 'psychological' approach to deconstructing denialist attitudes and methods. Maybe they'll be more welcoming of a new hypothesis than others... - The New Climate War by Michael E. Mann - our reviews
One Planet Only Forever at 04:01 AM on 11 June, 2021Nick Palmer @18 and 23,
I have the following perspective to add to the responses provided by Philippe and Nigel.
Be careful. You may be presenting a defence similar to claims that atrocious things, like slavery and racism, unjustly prolonged by previous generations were done "at a time when people did not know better".
Reading evidence based presentations like "A People's History of the United States", by Howard Zinn, exposes that what people today often fail to understand is that better understanding did exist but failed to be "Beneficial to the wealthy and powerful" and as a result it failed to be "Popular".
Also, claims of the Boon to humanity from fossil fuel use is misleading. There is very little lasting benefit for humanity from this burst of harmful unsustainable human activity. Many technological developments did not occur because of the use of fossil fuels. In fact, a focus on benefiting from fossil fuel use significantly distracted effort from other potentially less harmful and more sustainable developments. And the easy access to power has allowed far more harm to be done by humans than the harmful climate change impacts. Any perceptions of advancement that depends on cheaper higher artificial energy use is destined to fail to continue in the future. The perception so ending poverty are a particularly galling case. Any part of that perception that relies on fossil fuel use or comparably cheap energy use has no future. Sustainable development limits the need for artificial energy and requires all the artificially generated energy to be obtained sustainably, which include not using up non-renewable resources and requires no lasting accumulating harm to be done by the energy production, distribution or use.
In spite of global wealth rising far faster than global population there continues to be horrid inequity and injustice. Getting richer and more powerful clearly does not mean getting better. Note that at the time of slavery there was a very long period of time where the unacceptability of slavery was understood, but popularity of profit and other benefits traumatically prolonged the activity. And the worst part of the end of slavery in Europe was that in the end the rich people decided that their peers who were wealthier because of slavery would be financially compensated when the forced end of slavery happened, with no compensation give to those who had been enslaved and were now disadvantaged by the socioeconomic-political system and on their own.
I strongly urge everyone to be better informed about what is harmful and what is sustainably helpful.
- Read "The Age of Sustainable Development", by Jeffrey D. Sacks, or take the MOOC of the same name. It is not new. It is the result of continued pursuit of increased awareness of the harm being done by human development.
- Read the first global recognition of the harmful unsustainability of human actions that was recognized globally as early as 1972 at the Stockholm Conference.
Claiming "Exxon didn't know better" fails to admit that they were not "responsibly thoughtfully doing what the most responsible and thoughtful people were aware of and doing at the time".
The “Fog of misleading marketing compromised democracy, consumerism and capitalism” is like the Fog of War, a lousy excuse for horrible things being done.
Exxon had been on a more helpful leadership track in the 1970s. But something changed in the 1980s (Reagan/Thatcherism was a significant result of that change). And Exxon's approach to climate science appears to have changed at that time as well. The timing of Reagan/Thatcherism looks like a reaction to the growing awareness and understanding of harmful human developments that needed to be corrected, a fearful aggressive misleading marketing response to the increasing awareness and improving understanding that things needed to change and government action was required to make it happen. It was a reaction to the realization that the Free Competition for superiority in systems like Capitalism causes problems it resists correcting (popular and profitable things are hard to correct). And that realization meant that some wealthy powerful people would not maintain their developed sense of status. And the required corrections and potential for wealthy people to be losers would be in many industries like chemical and food companies, not just fossil fuels.
More than a decade ago, the understanding developed that a rapidly increasing Price on Carbon along with other Government actions to curtail fossil fuel use, including actions to encourage renewable energy system implementation and development of improved renewable energy systems.
The questions become things like:
- Was Exxon's messaging leading the promotion of that helpful understanding?
- Or was Exxon pushing misleading marketing like claiming that corrective action to limit harm should not happen until there was "More certainty" regarding the need for the corrections? That is the way the current system has developed so harmfully and so harmfully resists correction.
- Did Exxon promote a significant and rapidly increasing Price on Carbon along with other Government actions to more rapidly end the use of fossil fuels? Or did they promote the idea that a fixed certain "Price on Carbon" could be determined by an economic evaluation comparing benefits that would have to be given up today to reduce the harm done to future generations, with the future harm discounted (see my comment @17)?
- Did Exxon executives do what the law of the USA regarding Publicly Traded corporations requires them to do - “whatever they can get away with to maximize shareholder wealth”? Exxon could have been sued by shareholders if they acted to educate about the need to reduce fossil fuel use. That is an example of the harmful flaws that have developed in the Freer competition for superiority that so many wealthy people, and people who want to be like that, will excuse and defend.
Raising awareness and improving understanding regarding harmful activity and how to limit harm done should not be done by misleading marketing. But misleading marketing that achieves that objective is helpful in spite of perceptions of harm done. Without “Dramatic attention getting” the issue would be something people are less aware of and less understanding of. As for “getting more people to support the actions” ... Leadership compromising awareness and understanding and delaying required corrections in order to appeal to more people is Harmful Unsustainable Leadership. The sooner that type of Leadership fails to be influential the better the future for humanity will be.
Perceptions of success and progress based on unsustainable activity, especially harmful activity, are delusions no matter how popular or profitable they are at the time. And undeserving wealthy powerful people have been masters of harmful delusion, misleading marketing, throughout history. That is what needs to change. And that means a deserved loss of status for many high status people rather than “excuses, appeasement and delays trying to maintain undeserved perceptions of superiority” that compromise what is understood to be required to limit harm done so that humanity can have a sustainable improving future on this one amazing planet that may be the only planet that humans can be certain of being able to sustainably live on for many millions of years into the future.
The unjustified lack of leadership through the past few decades by the wealthiest and most powerful on the transition to rapidly ending the accumulating harm done by fossil fuel use is a travesty. The wealthy and powerful cannot claim they were “unaware”. They also have little ability to claim uncertainty about the magnitude of impact. The fact that fossil fuel use was unsustainable needed no research. Burning up non-renewable resource has no potential in the future of humanity. It was only ever a temporary ability for some to benefit in ways others never would be able to. Even now people try to argue that the less developed portion of the human population should not be allowed to use fossil fuel energy at the level that the Supposedly more Advanced, higher status, portion of the population still do (30 years after clear indications of the need to end fossil fuel use). And using Bob Loblaw’s concern “what if I am wrong?”, the 1.0C of warming already experienced is producing harmful climate changes impacting many people, especially the poorest. And that warming is less than the low end of the 1.5C to 4.5C warming due to a doubling of CO2.
- A critical review of Steven Koonin’s ‘Unsettled’
Eclectic at 15:24 PM on 4 June, 2021Citizenschallenge @7 / @8 ,
Pardon my poorly-pertinent reply, for I am presently somewhat at leisure to doodle and tap on my keyboard.
IMO most people are busy getting on with their immediate problems, and are giving scant attention to this early stage of the climate train-wreck. The passenger carriages are swaying and bumping a bit more than usual, it's true . . . but we've had various rough patches in the past, haven't we? And most of the wheels haven't come off (yet).
Despite the decades of well-executed denialist propaganda, there is now more talk by the Press & politicians about the need to take action on climate. The talk has increased . . . the action, not so much. But at least the ship has left the quayside, and is picking up speed (though only reaching 3 knots so far).
I am a regular reader of the extremists' blog WattsUpWithThat. Entertaining if you have a strong stomach, and it's (just) occasionally informative. The articles tend towards the Sour Grapes attitude, and the comment section is a marvellous menagerie of wingnuts and weally vewy cwoss Elmer Fudd [what an apt surname!] characters, overlapping with flat-earther "no-such-thing-as-GreenHouse-Effect" crazies.
WUWT is only the tip of the iceberg - and I am very uncertain about the size of the underlying berg. But I have noticed - increasingly over recent years, and especially since mid-November 2020 - that the denizens of WUWT are showing a slightly-desperate belligerence, and they sense that the infidel hordes have encircled the citadel of True Science (inhabited by the denizens). And that the infidel/liberal-Press army is battering at the gates.
The denizens feel (almost) confident the siege will soon be broken by the arrival of colossal electricity prices and the arrival of the oft-foretold onset of Giant Global Cooling. But it seems the denizens can't entirely shake off a nagging feeling of dread.
Let's hope the WUWT denizens will be justified in their worries. And let's hope that Koonin achieves little more than preaching to the choir. Likewise with the multi-year crapola on the extremist fringe of YouTube. I suspect that the majority of non-partisan voters pay little attention to both the good and the bad on YouTube.
- Arctic sea ice loss is matched by Antarctic sea ice gain
Eclectic at 15:31 PM on 3 June, 2021Joe @23 , best if you give much more detail about what you mean.
The Norse settlement history of Greenland is a complex multi-layered course of events. Temperature played little part (the medieval warming was only about 0.3 degreesC above the background).
Social and geo-political changes were the main determinants of the settlement's ultimate failure. All interesting. But the late stage sea-ice increase [and we don't really know if it was particularly big] would likely have been a very minor "straw" on the camel's back, compared with all the other disincentives that the Greenland Norse settlements were facing.
- Dr. Ben Santer: Climate Denialism Has No Place at Lawrence Livermore National Laboratory
MA Rodger at 22:33 PM on 31 May, 2021We are now a few days after Koovin's seminar at the LLNL but I don't see a word of the grand message presented by Koonin. Presumably it is as embarassing as his silly book.
Trying to find some coverage of the seminar, I did spot Koonin's pathetic attempt at de-debunking, that is debunking the WSJ Mills' article [LINK-paywalled] that debunked his silly book. Koonin's efforts at de-debunking simply demonstrates the level of utter nonsense you can expect from an obfuscatiing denialist troll like Koonin.
Just holding up the first of the nine items Koonin attempts to de-debunk shows the purile standard. This first item involves the following untruthful quote from Koonin's book which needs little comment to debunk.
"Greenland’s ice sheet isn’t shrinking any more rapidly today than it was eighty years ago."
Cutting through the nonsense presented by Koonin's de-debunk, the troll defends his grand assertion using Fig 1d of Frederickse et al (2020) 'The causes of sea-level rise since 1900' which shows the 30-year average rate of SLR attributed to Greenland by the study 1910-2010. Koonin tells us:-
"The “fact check” [by Mills] does not refute the statement quoted, which is about the rate of sea level rise 80 years ago."
...
"The 2019 paper by Frederikse et al. clearly shows that Greenland’s contribution to sea level rise around 1940 was about three times higher than it was in the last decades of the 20th century."
Yet, if it is about SLR and not Greenland, then the relevant evidence from Frederickse et al is shown in Fig 1c not Fig 1d. And Fig 1c shows average rate of SLR in 2010 was 33% greater than at any time "eighty years ago" and that "today" it is likely higher again. Greenland is not the sole contributor to the acceleration in SLR (thus a cherry-pick) while Koonin's use of "the last decades of the 20th century" to represnt "today" is no more than disigenuous trolling.
...
And in the intrests of correctness (the troll Koonin may have been saving his best until last), the ninth and last of his de-debunking atttempts to defend the Koonin quote:-
"...while global atmospheric CO2 levels are obviously higher now than two centuries ago, they’re not at any record planetary high — they’re at a low that has only been seen once before in the past 500 million years."
The context of this quote which compares today with "the past 500 million years" is not given. It appears Koonin bases his "only seen once before" comment on CO2 relative to today's 400ppm being lower 300 million years ago. And presmably his grand book does not provide a justification for this comparison. So, as was discussed in the debunking by an actual geoscientist, 300 million years ago the sun was much weaker, this perhaps 1.5% weaker 300 million years ago, so [0.025 x 250Wm^-2 =] 3.75Wm^-2 or the equivalent to a doubling of CO2. Koonin ignores such argument agaist him and instead concentrates on refuting the potential for future CO2 levels reaching 1000ppm.
- Greens: Divided on ‘clean’ energy? Or closer than they appear?
One Planet Only Forever at 06:07 AM on 23 May, 2021Nick Palmer @3,
I agree that Political Games should not decide what social or economic options Win. And the issue is far more extensive than the Climate Change aspects that sites like SkS focus on addressing.
This comment goes beyond the scope of SkS and Climate Science. But it is important for more people to be aware that there is more going on that also needs to be addressed.
Leadership providing a “... free'ish but lightly as possible regulated markets with social and environmental safety nets ...” would have been great if it had continued to be globally pursued and improved since the 1970s when the harmful reality of economic pursuit of More was becoming more clearly understood. The lack of helpful effective global leadership, especially the tragic Reagan-Thatcher “less Government assistance and less restriction so there is more opportunity for the Rich to get Richer because that helps everyone”, has produced the current developed reality where continuing to compromise what is understood to be required to limit harm done, the centrist compromised view, will significantly harm the future of humanity.
What is needed, and has always been needed, is for All Leadership (social, political and business), and an increasing portion of the population, to uncompromisingly pursue increased awareness and improved understanding of what is really going on and the diversity of ways (conservative and liberal, right and left, socialist and capitalist) to limit harm done, ideally excluding all harmful activity from competitions for popularity and profit. And it would be nice if unsustainable activity like burning up non-renewable resources, was also kept from competing for popularity and profit even if the harm done is not yet understood in detail (that would have meant restrictions on fossil fuel use even before climate science developed better understanding), because everything humans do needs to be Sustainable if perceptions of improvement of civilization are to be sustainable.
Recommended reading:
- Human Development Report 2020 which is the latest annual report regarding Human Sustainable Development.
- Jeffrey D. Sach's "The Age of Sustainable Development" or take the MOOC of the same name. The book (and MOOC) present the evidence-based understanding of the Sustainable Development Goals and are updated by the HDR 2020.
- Review the Sustainable Development Goals to see that the Green New Deal is aligned with what all Leadership should be pursuing (in spite of the developed popularity and profitability of not limiting the harm done by human competition).
- Also, look at the 1972 Stockholm Conference that was a clear start to global leadership collectively raising awareness of the harm done by insufficiently restricted competition for superiority.
- Finally, check out “The Planetary Boundaries” evaluation by the Stockholm University - Stockholm Resilience Centre that is a key part of all of the above.
The awareness and understanding from that reading and learning makes it undeniable that a lot of what humans have developed is harmful and unsustainable. In particular, systemic pressure for "more to exploit to obtain more benefit – always needing More" is expanding impacts beyond the real limits for humanity on this planet. And expanding beyond this planet’s limits, expanding to the Moon or Mars or mining asteroids, before figuring out how to sustainably live on this planet is not a sustainable solution.
Based on the planetary boundaries evaluation the expansion pressures have already clearly exceeded the planetary boundaries for Nitrogen, Phosphorous, and Genetic Diversity. And pressures for maintaining undeserved unsustainable perceptions of status (expectations based on the developed high consumption, wasteful, harmful impact ways of living) will undeniably result in impacts clearly exceeding the Climate Change boundary of human civilization sustainability. A Moderate centrist compromising response is no longer an option, but will be pushed for by those who have only cared to benefit as much as possible by delaying the reduction of harm done as much as they can get away with for as long as possible – Now they claim to like the Moderates but they still hope to win more extreme delays – more harm done.
Reducing harm done includes reducing the diversity of injustice and inequity that develops when people compete for popularity and profit in games where results are based on impressions. People freer to believe what they want and do as they please produce more harmful results because getting away with behaving and excusing being more harmful is a competitive advantage.
Any perceived advancement or improvement that is the result of activity that is unsustainable is understandably unsustainable and a little unfair to have a limited portion of humanity benefit (only the least fortunate should benefit that way, but even that needs to be understood to be unsustainable), and is also understandably undeserved if the activity is harmful (harmful activity is undeniably unsustainable). That applies equally to perceptions of status for those who are more fortunate and perceptions that the less fortunate have been helped develop an improved life.
The failure of the systems that produced the problems to effectively correct things, and the ways the systems develop resistance to correction, requires corrective systemic change, including Government intervention and action, to limit the harm done. Thirty years ago the climate change impact corrections would have been modest and the total harm done would have been serious and unfair but not tragic. Today the harm done and required corrections are tragic and dramatic. Without significant government intervention to limit the harm done, the required corrective actions in 10 more years is almost certain to be catastrophic corrections to the incorrectly over-developed human activity and perceptions of advancement. And the accumulated harm done by then is very likely to be also be catastrophic. And the current system will make the less fortunate suffer the most. And that is not Hyperbole.
But I agree that Government action should be limited to blocking the pursuit of unsustainable harmful activity, not choosing winners, just identifying harmful pursuers of benefit, blocking their harmful tactics, and penalizing them to make amends for harm done. Ultimately, to be sustainable, energy systems will have to be 100% renewable. And reducing energy consumption is undeniably a significant part of the solution. Reducing energy demand will reduce the amount of harm done by energy generation while the harmful unsustainable energy generation is sustainably replaced. That means that any new new energy system that gets built, like nuclear or “fossil fuel with CCS”, would be shut down as early as possible by rapidly developing the sustainable renewable systems built to replace them even if the renewable options are more expensive. And reduced per-person energy demand, particularly by the wealthiest, will more rapidly end the need for harmful unsustainable energy generation. Of course, the Be Harmless limit also applies to renewable energy systems – no Green Washing.
Lack of interest in investigating to discover and stop harmful unsustainable activity is a serious problem. Grandfathering (systemic gender bias is also a problem) harmful activity and protecting any wealth that was obtained from harmful activity is also a problem. Those aspects of the developed systems need to be diligently ended and kept from re-emerging in the competition for superiority which will always be part of human interaction. It would be great for that competition to be striving to be superior by being Less Harmful and More Helpful to Others and the Environment everyone shares.
A lot of changes of the Global Status Quo are required to develop a robust diversity of humanity in a diversity of sustainable socioeconomic political systems that are constantly adapting to be improved sustainable parts of the robust diverse environmental reality that humanity requires for sustainable survival on this one amazing planet. That required result will not be developed without thoughtful, unselfish, Government Interventions in the “games of competition for superiority”.
Wealth should be deserved by not being Harmful, and by being Helpful to Others without expecting a return benefit. That is part of the understanding behind the Sustainable Development Goals. Claims that some Help is delivered by the Harmful acquisition of wealth need to be challenged. Harm done is not justified by benefits obtained. A harmful version of Utilitarian beliefs excuses harmful actions because “someone benefits”. It is one of the most harmful beliefs ever developed. It leads to misunderstandings like the claims that the harmful unsustainable economic development that has occurred has reduced poverty. Any perceptions developed by unsustainable harmful activity are not sustainable.
People perceived as "shooting themselves in the foot" may be far more helpful and less harmful than people who do not see that the socioeconomic political system they have developed a liking for produces harmful unsustainable "impacts on the environment of the only planet that humanity is sure to be able to survive and thrive on” and ruins societies with injustice and inequity.
Social and environmental harm that is the result of human competition makes developed perceptions unsustainable. Popularity and profitability can be lousy measures of Merit and Worth when harmful unsustainable beliefs and actions are allowed to survive and thrive.
- SkS Analogy 22 - Energy SeaSaw
One Planet Only Forever at 12:42 PM on 11 May, 2021Evan, I try to learn as I try to help other people understand what is happening. I appreciate your attention to my comments, and your feedback.
I have a few more suggestions for your consideration starting with the last point you made in your comment @16 (potentially only my comments “Regarding 10 years of temperature data being a sufficiently long time to provide a degree of technical rigour” affect what you have presented in your See-Saw item).
I find it helps to expose people to the fuller record of basic data like CO2 levels and Global Average Surface Temperature. That can help them see how unusual or unnatural the recent values are and that CO2 and Temperature are related. That is why I recommend looking at the history of Temperature and CO2 data:
- back to 1880 for the surface temperature which shows that one of the biggest See-Saws was a warm bump in the 1940s that many “global warming - climate change” doubters mistakenly believe was Globally warmer than now because it was very warm in parts of the USA (And some people experienced that or knew someone who was alive back then similar to your “Winter recollections”).
- back to 1979 for the satellite data (to see that, though satellite temperatures are not the surface temperature, the pattern of temperature is similar)
- and back 800,000 years for CO2 levels, like the animation by NOAA that allows the details of recent decades to be seen along with the final full length record. It shows that:
- several 100 to 120 ppm changes happened in the previous ice-ages
- the high level of CO2 of 300 ppm was only reached once in all that time, until recently
- for the past 4000 years the CO2 level has been between 270 and 280 ppm.
- CO2 levels are now at 420 ppm, 140 above the pre-industrial level of 280 ppm, and continues to increase, and indeed an increase of 100 ppm since 1960.
The higher recent rates of warming do indeed over-whelm the impressions of the See-Saw. However, the magnitude of the warming is more important. Even if the decade rate was only 0.10 degrees C, eventually the warming would be clear in spite of the larger swings of the See-Saw.
Regarding how people will perceive a message
There is a diversity of awareness, understanding and perspective. Not everyone will see things the way you intend.
You asked: “Many people feel a difference in winters now than during their childhood (1970's or earlier). Can you tell how old I am? :-)”
What I can tell is how far North you likely live. You are likely part of the small portion of humanity who live north of, or near to, 60 degrees N latitude. The arctic regions have warmed faster than the rest of the global surface. People may legitimately recollect that Northern winters were different decades ago. But global average warming since the 1960s is far less than 1 degree C with non-arctic areas warming less than the average (and there is more warming at night than the daytime. So, people in non-arctic areas may not recall a difference. I was born before 1970 and have lived between 50 an 55 degrees N. In spite of my bias of being aware of the warming and climate change that has occurred, I cannot claim a clear recollection that winters were significantly different when I was younger. So there are likely many people who do not have a legitimate recollection that winters were different decades ago.
Regarding 10 years of temperature data being a sufficiently long time to provide a degree of technical rigour
I do agree you may want to reconsider what you say about the adequacy of a 10 year set of temperature data.
As KR suggests, unless the data has had significant variable influences like ENSO and volcanic impacts scrubbed out of the data, which raises questions about how those impacts are “scrubbed out”, temperature data sets longer than 20 years may be needed to avoid unintended interpretations.
I spent a little time learning about “decades of temperature data using the SkS Temperature Trend Calculator. I looked at the Trend values for sets of 10 years in the GISTEMPv4 and UAHv6.0 TLT data starting in 1979 (everyone can do this to verify the results):
- The Satellite data set shows a negative trend for the decades starting in 1987, 1998, 2000, 2001, 2002, 2003, and 2004.
- There are also many decades where the Positive Trend is less than 1/10th of the 2 sigma range of variability starting in 1980, 1986, 1997, 1999, and 2005 (decades with almost no clear warming, like the set starting with 1997 being 0.015 +- 0.445 degrees C per decade meaning a value range from -0.430 to +0.460, or 2005 being 0.005 +- 0.376 meaning -0.371 to +0.381).
- In the Surface Temperature data set only the decade starting in 1987 had a negative trend. There were no decades with a positive trend that was less than 1/10 of 2 sigma.
This may explain why the likes of Dr. Roy Spencer focus on their satellite data manipulations and try to claim the superiority of that data over surface temperature data. That run of values from 1997 through 2005 was a long period of being able to claim that the warming had appeared to have ended even though CO2 levels continued to increase (the UAHv6 data set trend for the 19 year period of 1997 to 2015 is negative. In the UAHv5.6 data set the longest negative Trend was for the 11 years 1998 – 2009, and in the RSSv4 TLT data set the longest negative trend is the decade starting with 2003). So shorter sets of data, rather than the fuller story, can be the “Friend” of the likes of Dr. Roy Spencer (and updated manipulations of the data can also be “Friendlier to the likes of Dr. Roy Spencer.).
A final point about presenting decade averages
I do like the presentation of the averages of the 70s, 80s, 90, 2000s, 2010s when a graph cannot be shown. And I agree that such a presentation is not improved by adding earlier decades. But I also consider a “moving average” presentation to be better, but it needs to be Graphed (referring to the SkS Temperature Trend Calculator works). The moving average values can’t be described in words the way the decade averages can be. However, the discrete decade averages are a 120 month "moving average" with the data points being every 10 years (on a graph the decade averages would be points in the middle of each decade). As you can see from the investigation I summarized above, any set of 10 years of data can be a Decade average. And when those averages are done for each new month of data the series of points will look like a line (note that Dr. Roy Spencer presents a 13 month moving average because that makes it easier to present the data points. They go on the middle point of the data set – no need to set the graphic up to present a 12 month average between the middle two months of a 12 item data set).
- 2021 SkS Weekly Climate Change & Global Warming News Roundup #19
Eclectic at 00:29 AM on 11 May, 2021Nigel :- Koonin's attitude to mainstream climate science is not a new development. If you go back 7 years and read the transcript of his verbal contribution to the 2014 American Physical Society climate statement review, you will find he took a rather aggressive/persistent attack on the mainstream position. Clearly it was not a skeptical, but a prejudiced attitude he took with his carping.
Nigel, I am sourly amused by the repeated crocodile tears of denialists claiming that we (the West) should first supply coal-fired generators to bring electricity to the suffering poor of Africa. Thus raising their economic well-being . . . and only after that has been accomplished, would we be justified in pursuing our own renewable energy goals.
The poor of this world have have been suffering for many decades, with precious little help from the denialists. When even a 10% diversion of our global armaments expenditure could have made a colossal difference in helping the poor. But this hasn't been done ~ nor even suggested by the same denialists. Apparently we must not consider donating solar panels to African villagers for charging their (increasingly widespread & useful) cellphones etcetera ~ but we must first go to donating centralized coal-fired generation of electricity.
- Is Nuclear Energy the Answer?
michael sweet at 22:13 PM on 30 April, 2021John ONeill,
The terrapower plant storage may be useful for short time use but for seasonal storage it will not supply anything.
Fortunately, we do not need to rely on your personel observations to determine whether nuclear plants or renewable energy lead to lower carbon emissions. This study: Differences in carbon emissions reduction
between countries pursuing renewable electricity
versus nuclear power Sovacool et al 2020 studied just that. The complete abstract states:
"Two of the most widely emphasized contenders for carbon emissions reduction in the electricity sector are nuclear power and
renewable energy. While scenarios regularly question the potential impacts of adoption of various technology mixes in the
future, it is less clear which technology has been associated with greater historical emission reductions. Here, we use multiple
regression analyses on global datasets of national carbon emissions and renewable and nuclear electricity production across
123 countries over 25 years to examine systematically patterns in how countries variously using nuclear power and renewables contrastingly show higher or lower carbon emissions. We find that larger-scale national nuclear attachments do not tend
to associate with significantly lower carbon emissions while renewables do. We also find a negative association between the
scales of national nuclear and renewables attachments. This suggests nuclear and renewables attachments tend to crowd each
other out" my emphasis
Countries that build nuclear as a group do not reduce carbon emissions. Countries that build out renewables do.
You look at France, Sweden and Ontario, Canada. Engineer Poet on Real Climate also likes those two countries and that state. Perhaps looking at Uruguay 100% renewable mostly wind.
North east Brazil 95% renewable, mostly wind. And
Bornholm, Denmark 100% renewable, no hydro.
These examples are from your source. All have renewable energy systems. You are just not looking. It appears your claim at 236 that "I obsessively scan for examples of it" is false. It took me less than 5 minutes to find these examples. I note that your links all say "wind=false and solar=false". Perhaps you are using the incorrect search terms.
Sweden closed 2 of their 8 remaining nuclear reactors in the last 18 months. During 2020 their remaining reactors only ran 60% of the time. They are rapidly bulding out wind and have no plans to build more nuclear. The nuclear plants cannot compete on the local grid with hydro and wind. Although they do not currently have plans to shut down the nuclear plants (they spent a lot of money refurbishing them 5-10 years ago), the handwriting is on the wall that when planned new wind is installed there will be no economic way to use the nuclear plants. Hydro will provide more than enough backup when the wind does not blow.
France is planning to shutter 14 nuclear plants in the near future (they also closed two last year) and install renewables. Ontario's nuclear plants are old and they are installing wind.
I noticed you forgot links to descriptions to the Russian nuclear reactors. According to Wikipedia, the BN600 has had 27 sodium leaks resullting in 14 fires. As much as 1000 kilos of sodium leaked. Apparently, in recent years they have leaks under control. Construction for the BN800 was started in 1983 and completed in 2016. source The BN 600 runs only 70% of the time because of required maintenance. Both reactors have three complicated triple part cooling systems to isolate the radioactive sodium coolant from water since sodium is flammable in water. These reactors cost even more to build than normal reactors. They will never be economic. No more are planned worldwide.
Renewables have only been the cheapest energy for a few years. Comparing directly to nuclear, a 60 year old, mature technology, is stupid. After 60 years nuclear generates less than 5% of world energy. Little is being built. In 2020 more than 80% of new electrical capacity added world wide was renewable. Because renewables are now cheapest, they are the most installed. For much of the non-renewable energy installed in 2020, construction was started when renewables were more expensive. In the future renewables will dominate all new construction.
More than 100 comments found. Only the most recent 100 have been displayed.
More than 100 comments found. Only the most recent 100 have been displayed.


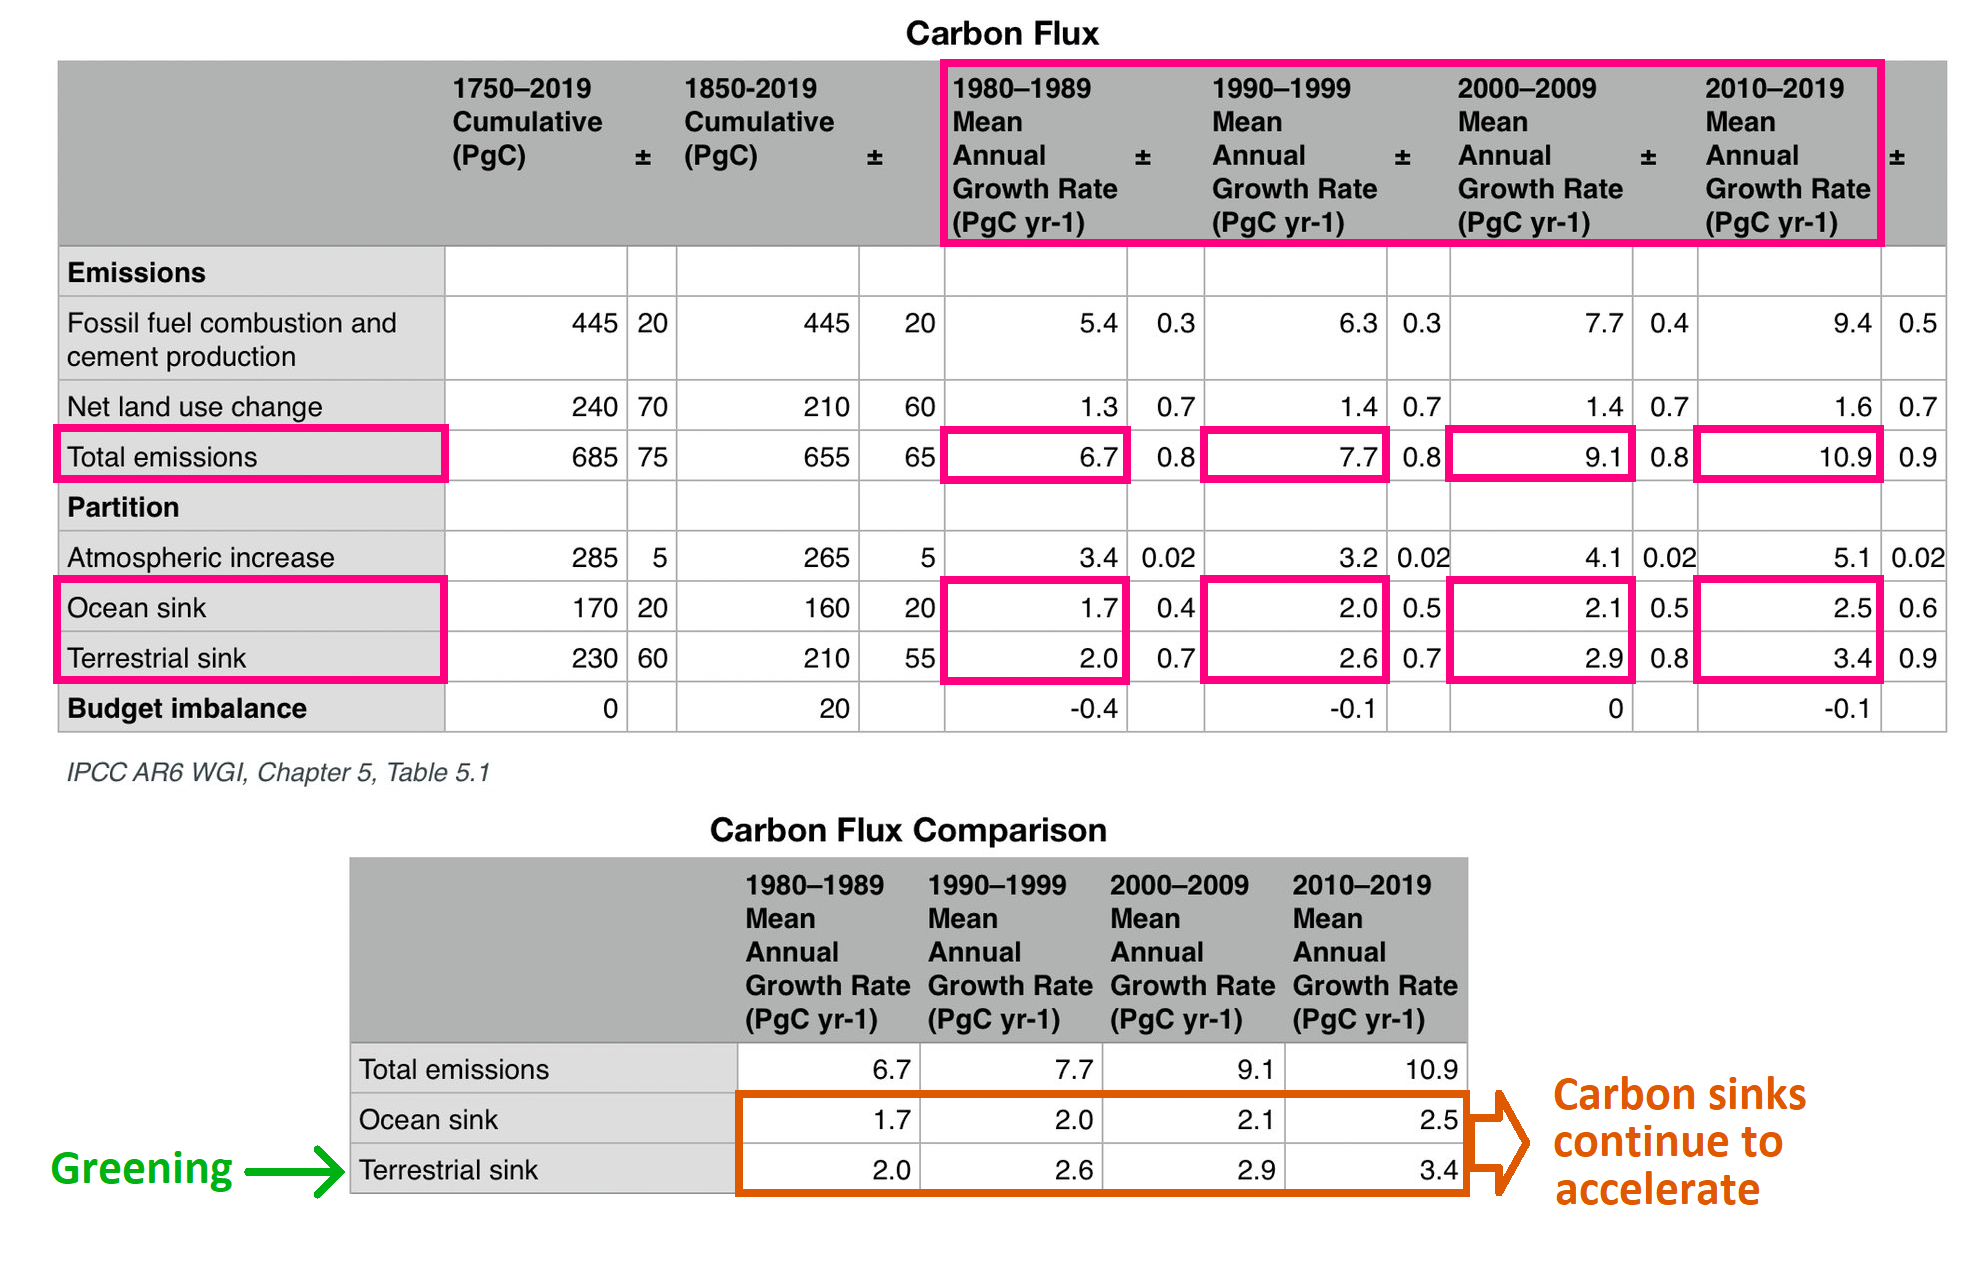
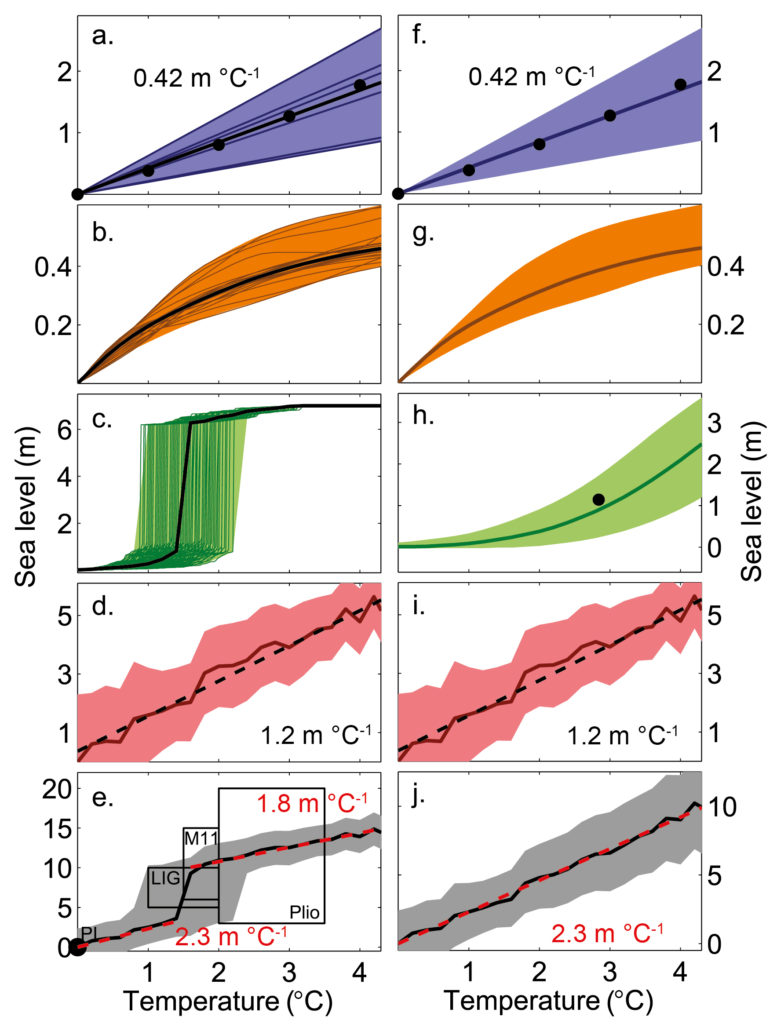
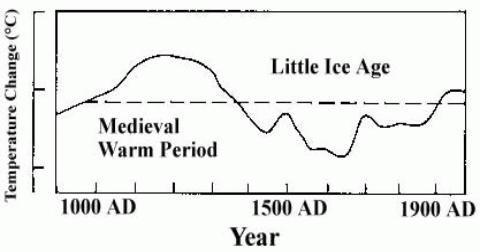
THE ESCALATOR

(free to republish)