


 Arguments
Software
Resources
Comments
The Consensus Project
Translations
About
Support
Arguments
Software
Resources
Comments
The Consensus Project
Translations
About
Support
![]()
![]()
![]()
![]()
![]()
![]()
![]()
![]()
![]()
![]()


![]()


Latest Posts
- Skeptical Science New Research for Week #28 2025
- Trump just gave a huge gift to China’s economy
- Fact brief - Is global warming just due to El Niño?
- The great acceleration debate
- 2025 SkS Weekly Climate Change & Global Warming News Roundup #27
- Skeptical Science New Research for Week #27 2025
- Take advantage of these tax credits before Congress kills them
- Fact brief - Are human CO2 emissions driving current global warming?
- What do the latest WMO temperature projections imply for 1.5C?
- 2025 SkS Weekly Climate Change & Global Warming News Roundup #26
- Skeptical Science New Research for Week #26 2025
- You did it! Yale's 2025 extreme weather coverage is funded
- Rebutting 33 False Claims About Solar, Wind, and Electric Vehicles - Recap
- Climate Adam - Silencing Science: Trump's War on Our Climate
- 2025 SkS Weekly Climate Change & Global Warming News Roundup #25
- Fact brief - Is modern warming just a rebound from the Little Ice Age?
- Show your Stripes Day on June 21 2025
- Skeptical Science New Research for Week #25 2025
- The role of aerosol declines in recent warming
- Sabin 33 #33 - What is the effect of hot or cold weather on EVs?
- 10 ways that Trump’s tax bill would undermine his energy promises
- 2025 SkS Weekly Climate Change & Global Warming News Roundup #24
- Fact brief - Was 1934 the hottest year in the global record?
- Skeptical Science New Research for Week #24 2025
- Climate Adam: Is China Finally Changing Its Climate Ways?
- Sabin 33 #32 - Is range restriction a problem for EVs?
- The Trump EPA tried to bury some good news
- 2025 SkS Weekly Climate Change & Global Warming News Roundup #23
- Fact brief - Are CO2 measurements reliable?
- Skeptical Science New Research for Week #23 2025
Comment Search Results
Search for dalton minimum
Comments matching the search dalton minimum:
- Ben Santer on Seth Meyer’s Late Show – How Climate Deniers Lie
Wake at 03:57 AM on 16 March, 2017This is not a case of whether the climate has been getting warmer. Why would you put it in such a manner?
Climate is nothing more than a long term averaging of weather patterns and it has obviously gotten warmer since the Maunder Minimum and then the Dalton Minimum.
The questions lie in whether CO2 has any connections to this and whether this has anything other than a passing relationship with man.
If you observe earthobservatory.nasa.gov/Features/Paleoclimatology_Evidence/ you will see that the Milankovitch Cycles suggest that we should be in a warmer part of their cycles. This suggests that we are having more solar energy being injected into the northern hemisphere at this time. And land area reacts differently with this energy than oceans do.
So whether man has anything to do with the warming climate is what the question is and that is not answered. Calling those who suggest this "deniers" in the same sort of personal insults that the "deniers" are forbidden to do on this site.
- CO2 lags temperature
Adri Norse Fire at 23:41 PM on 17 February, 2017MA Rodger
What I meant was that I am using scientific data in the sense that my arguments are exclusively in scientific terms, regardless of whether my claims are true or not.Rob Honeycutt/scaddenp
Why do you say that I am not using scientific data? Do not scientific documentaries and scientific journals make scientific knowledge public? Is that knowledge invalid? So everything the public knows is a lie ... including global warming, right?
When I said that the current temperature was below about 1.5 ° I relied on a documentary where a gentleman, I think he was Norwegian who was in the Antarctic and claimed that the ice cores of his own research proved that the temperature was 1.5 ° higher to the present during the Medieval Warm Period. But also, it is known that historically the peoples of contemporaries of that time recorded that in Greenland agriculture was possible, among other things, etc. I think it is out of place to think that everything is part of a subtle conspiracy, of wich I am part, of course.
Tom Curtis
Thank you.
Okay, this is the kind of thing I said that misinterpretations were likely to occur. I have not said that the current increase in CO2 comes from volcanoes. And you're right, I thought it was a question I asked John Hartz, it's my fault. Sorry. Again you are right, I have no problem accepting that the recent increase in CO2 is due to human industrial activity, although there are other scientists who deny that conclusion with their own data, since from the beginning I said CO2 does not cause the current global warming by greenhouse effect or by feedback. I just do not see it likely. Sources I read some time ago claimed that water vapor is the main greenhouse gas and that it is responsible for two-thirds of the natural greenhouse effect. As you say very well it is a stable process, but the Earth makes all kinds of movements and we do not really know how much impact the orbital changes have on the greenhouse effect and Milankovich attributed the intervals of glacial periods and warm periods to the orbital changes. Which is no small thing in terms of climate.
Sorry for putting that graphic, I knew it was just a very nice graphic. I have taken note.
Well, as I said above the Antarctic data show also, that the temperature was higher than the current approximately 1.5 degrees during the Medieval Warm Period.
"All of this may be a side issue, but I am unsure as to what point you are trying to make with two charts of CO2 concentration over the last 800,000 years, or the chart of CO2 concentration over the Holocene." Why the current Temperature is 1.5 ° lower than the medieval warm period? " It is not. See chart above.'' Yes it was, why do you think it was called the Medieval Warm Period? Let's look at some recent research:
Working with a 2.5-foot-long core of peat in Penido Vello (Galicia, Spain) Martinez-Cortizas et al. (1999), a Mercury deposit record was extracted that extended until 4000 years ago. The work revealed that warm periods were characterized by a low accumulation of mercury. They also standardized the variables extracted and related them to the temperatures of the last 30 years. The work revealed that the medieval warm period in the northwest of Spain was 1.5 ° C warmer than the current one and that the average temperature of the warm Roman period was in no less than 2 ° C. Even a period of 80 years in the Middle Ages with average temperatures 3 ° higher than the current ones.
Desprat et al. (2003) studied the climatic variability of the last three millennia through the sediments of the Vigo estuary, clearly recognizing three warm periods and three cold periods, without seeming to be a relation between the variability and the increase of carbon dioxide. The authors concluded that the solar radiative balance and the ocean circulation seem to be the main mechanisms that force these cyclical variations in the Peninsula.
Pla and Catalan (2005) analyzing sediments of chrysophytes in more than 100 lakes of the Pyrenees reproduced a record of winter and spring temperatures during the Holocene. Warm and cold oscillations were recognized for these oscillations over the past few millennia. From the Medieval period it is deduced that the temperatures were then 0.25 ° higher than the current ones.
Here a chart: http://www.biocab.org/Holocene-Delta_T_and_Delta_CO2.jpg And as I liked the dissection you did to the other here is more: http://www.biocab.org/Boreholes_Reconstruction.jpg http://3.bp.blogspot.com/_H07QGNhZQzA/S_gGpyDlDQI/AAAAAAAAAHw/ADQvLwN-9U0/s1600/temperaturas+%C3%BAltimos+2000+a%C3%B1os.jpg http://www.biocab.org/Holocene_Delta_T_and_Delta_CO2_Full.jpg
''Of course, in your version it is labelled Northern Hemisphere temperatures, not global temperatures. The point still stands, however. A Greenland ice core no more shows Northern Hemisphere temperatures by itself than does a thermometer in Moscow show temperatures in Tucson, Arizona.'' The question then remains valid, but to avoid falling into the little trick of geography I will rephrase: Why the current temperature of Spain is lower (0,25º - 1,5º) than the Spain's Medieval Warm Period, if the current concentrations of atmospheric CO2 in Spain is higher without any doubt?
(Can we extend the geographical scope to the Mediterranean and even Europe? I do not know; http://science.sciencemag.org/content/291/5508/1497 , http://science.sciencemag.org/content/342/6158/617)
--And someone asked me why I'm so skeptical or something--
Well, it is not very difficult to be a skeptic of anything since we have been able to see everything from the millionaire Red Cross scam in Haiti after the earthquake to hear the Greenpeace co-founder say that this organization has become a corrupt gang and then you see scandals with emails and what some IPCC scientists say, and so on. When I saw the Al Gore's documentary I believed it and when I saw the documentary of The Great Scam of Climate Change, I also believed it. So we must be very careful not to be deceived by the official tone, as some have pointed out: http://joannenova.com.au/2010/10/is-the-western-climate-establishment-corrupt-part-4-past-temperatures/
MA Rodger
It's funny that you mention sidelong to the ''Little Ice Age revivalists'' because according to NASA members, this very century we can face a solar minimum such as the Maunder Minimum or the Dalton Minimum and presumably a new Little Ice Age. Here's a link: http://www.forbes.com/sites/peterferrara/2013/05/26/to-the-horror-of-global-warming-alarmists-global-cooling-is-here/#5c8c582669bb
- Temp record is unreliable
Tom Curtis at 01:10 AM on 14 October, 2016pink @397, using data from the site which provided the data for your chart, and calculating an 11 year running average of montly sunspot numbers from 1750-2016, 1883 is at about the 20th percentile, and about 70% of the mean sunspot number. Neither of these is consistent with 1883 being a grand solar maximum.
With respect to Laki, I repeat, it occurred prior to the Dalton Minimum. Indeed, 1783 is in the 98th percentile of sunspot numbers, with 1.56 times the mean number of sunspots. Arguably that makes it grand solar maximum, but solar astronomers do not so describe it, presumably due to the brevity of the peak.
Your persistent ascription of voclanic eruptions to minimums when they are more likely to lie in a maximum, and to maximums (ie Laki), when they are quite ordinary years (ie, Krakatoa) shows your theory is not emperically derived. Further, because of the low forcing associated with fluctuations in the solar cycle, only persistent large fluctuations (positive or negative) can plausibly result in increased volcanic activity. Your wanting to ascribe Krakatoa to a maximum suggests you care nothing for that, giving your theory all the hallmarks for a deux ex machina for a "anything but CO2" paradigm. That is, your only evidence for your theory is that you want to believe it to be so to avoid believing that increasing CO2 is likely to have a significant impact on globat temperatures.
- Temp record is unreliable
Tom Curtis at 23:52 PM on 11 October, 2016pink @388 again evades discussion of points that conclusively refute his claims on this site. Instead he launches of with a whole new lot of out of context factoids and a half baked theory of his own. I will continue once more responding to pink's game of "look, squirrel", but do request that the moderators constrain pink to actually responding to the points raised against his claims in this and prior posts, either by raising cogent and germane evidence, or conceeding the point.
1) pink's first new "argument" is to misrepresent a New York Times article of January, 1989. The Times article does indeed say that there were no significant trend temperature over the CONUS from 1895-1987. "No significant trend", is of course, not the same as no trend, or zero trend. It means only that whatever trend exists was not statistically significant. Indeed, the modern NOAA data over the same period shows an Ordinary Least Squares trend of 0.033 +/- 0.0324 C/decade (two standard deviation range). Given that the error margins based on standard deviations do not account for autocorrelation, if autocorrelation was included the trend would not be statistically significant. So, not only did NOAA scientists in 1989 think the 1895-1987 CONUS temperature trend was not significant, their modern counterparts would agree. In contrast, the 1895-2015 OLS trend is 0.076 +/- 0.0234 C/decade. That is clearly statistically significant, and would be so even allowing for autocorrelation. So, pink's outrageiously dated evidence is clearly irrelevant given that the full record disproves the apparent point.
Of course, the article also included caveattes that should have prevented the misuse of it by pink, as already quoted by MA Rodger @390. Indeed, it goes on from the quoted section to mention that the area of the CONUS is too small to be representative of global trends, and to mention that "... average global temperatures have risen by nearly 1 degree Fahrenheit in this century and that the average temperatures in the 1980's are the highest on record". Failing to mention the caveats on the CONUS data, and the global data actually reported in the article is definitely out of context quotation, something which in academic circles is tantamount to fraud.
pink then procedes to contrast the articles results with the modern pronouncements by NOAA (in 2014, 2015, and 2016) that each year has been successively, the hotest on record. He fails to note that the person making those pronouncements was Dr Thomas Karl, one of the authors of the research which he indirectly cites. Given the credence he gives to the research of Dr Karl in 1989, his refusal to accept Dr Karl's research in 2016 is a clear case of special pleading.
2) pink then mentions the satellited data, without mentioning that all TLT satellite series show a statistically significant positive trend from 1978-2016. The curious thing is that there are (at least) four satellite series, of which only the two with the lowest trends are commonly cited. They all use the same data, and all come up with different answers as to what the trend was. That is unsurprising because converting satellited data to a temperature series requires more, and more controversial adjustments of the raw data, than does the analysis of the surface temperature record. Thus it is no surprise that the five official (and about six unofficial) surface temperature records, using distinct but overlapping datasets, and different methods all come up with the same trends, while the various approaches to the satellite data fail to do so. It is with good reason that Dr Carl Mears (the author of one of the satellite data sets) has said, "I consider [surface temperature datasets] to be more reliable than satellite datasets (they certainly agree with each other better than the various satellite datasets do!)." pink, not being aware of the complexities involved, merely prefers that data which appears to best support his/her previously arrived at position.
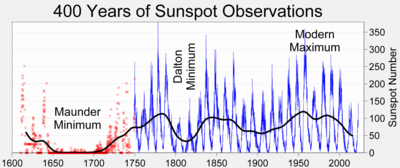
3) pink then invokes Sunspots and Volcanoes (Oh my!). Let me first state that I believe MA Rodger to have misinterpreted the theory. By solar minimums, pink means such extended periods of low solar activity as the Maunder Minimum (c1645-1715), the Dalton Minimum (c1790-1830), and the Modern Maximum (c1950-2000):

Constraining ourselves to volcanic erruptions with a VEI of 6 or above, from 1600 onwards we have:
- Huaynaputina 1600 AD
- Kolumbo, Santorini 1650 AD
- Long Island (Papua New Guinea) 1660 AD
- Grímsvötn (Laki) 1783 AD
- Unknown 1809 AD
- Tambora 1815 AD (VEI 7)
- Krakatoa 1883 AD
- Santa María 1902 AD
- Novarupta 1912 AD
- Mount Pinatubo 1991 AD
(Underlined volcanoes occur durring a named minimum or maximum. Source)
In all, 5 out of 10 eruptions occcur durring a named minimum or maximum. In all, named minimums and maximums occupy 39% of the time from 1600-2015, and durring those named periods, 50% of VEI 6 plus eruptions during that period occurred. In short, there might be a slight statistical link between the volcanic eruptions and the data, but you could not prove it on this data. You certainly could not prove it with pink's data, which counts Laki and Krakatoa as being during named minimums/maximums despite the fact that they clearly are not.
I do not discount a solar minimum/maximum effecting the rate of volcanos. Any factor significantly changing the quantity of ice in glaciers and ice sheets, could by the resulting change in the Earth's rate of rotation, cause stresses in the Earth's crust making eruptions more likely. Of course, that applies to any factor significantly effecting climate, including the strongest recent impact, AGW. But this, of course, is just a possibility - not a proven theory. Even if true, the impact is minor; and as the strong warming through the 1990s, despite the Pinatubo erruption shows; any consequent volcanic effect is likely to cause only temporary slowdowns in the onset of global warming.
Despite this slight possible connection, pink's treatment of the situation is, at best, very bad science fiction.
- Temp record is unreliable
pink at 13:33 PM on 11 October, 2016He's not going against common sense he just created a chart using unadjusted data. NY Times articles like this from 1989:
http://www.nytimes.com/1989/01/26/us/us-data-since-1895-fail-to-show-warming-trend.html?src=pm
[ U.S. Data Since 1895 Fail To Show Warming Trend
After examining climate data extending back nearly 100 years, a team of Government scientists has concluded that there has been no significant change in average temperatures or rainfall in the United States over that entire period. ]and then going to the current time where the NOAA declares every year 'the hottest ever' even though warming is flat on satelite data, and some area's even show recent cooling cooling makes skepticism.
Also I don't know if you guys are aware of this, look at the sunspot chart:
http://facweb.bhc.edu/academics/science/harwoodr/geog101/study/images/sunspots.gif
ALL the big volcano's since the 1600's have occured during solar maximums or solar minimums, with the ones that erupted during solar minimums bigger that the ones during maximums. pinatabo, mtst helens, krakatoa, 1991,1980, 1883 during maximums. Tambora 1815, Laki 1783 dalton and maunder mins. Tambora and Laki were so powerful that they created freezing summers.
So the warming probably isn't 'that' abnormal, it isn't 'that' much-considering the weather and seasons are currently stable, crop production the past few decades has been stellar and food is cheap. There hasn't been a big volcano for a while- a few years from now they probably start going off due to solar minimums.. and the warming is erased. There's no reason to think the greenhouse gas effect is so powerful that it can make warming continue despite such powerful forces.
- It's the sun
MA Rodger at 04:19 AM on 26 July, 2015Tom Dayton @1147/1148.
I think the two previous excursions of Dan Pangburn here @SkS do not provide a clear explanation of Pangburn's proposition, possibly even less clear than Pangburn's explanation linked to by APT @1146.
APT @1146.
The graphs you link to are simple nonsensical curve-fitting with zero basis in physics. The guts of Pangburn's sunspot equation can be much simplified and still produce the same-shaped resulting graph. That simple equation is:-
- T(i+1) = T(i)+0.00002(S(i)-34)
where T is temperature and S is sunspot number for year i.
For the last 75 years, the average sunspot number has been about 75, way above the average 34 used in the equation which is why the graphed temperature soars despite the heavily lagging terms employed. Indeed, it is only during the Manuder Minimum & the Dalton Minimum that the average sunspot number drops below 34 allowing Pangburn's graph to dip downward. Including SSN data to 2014 shows that even weak Sunspot Cycle 24 is averaging above 34 and showing a further increase in temperature.
Heavy lagging is used by Pangburn because the T4 term is far too weak to define an equilibrium temperature. If the ~75 average sunspot number of recent decades persisted, the equation tells us global temperatures would rise by over 60ºC before equilibrium appears. Given the forcing involved will be less than 1Wm-2, this means this equation of Pangburn's is suggesting an Equilibrium Climate Sensitivity ECS > 240ºC, an entirely lunatic value.
- How we discovered the 97% scientific consensus on man-made global warming
Tom Curtis at 13:23 PM on 4 February, 2015Stranger @20, searching The Consensus Project database, I find just two papers with Willi Soon as a coauthor. The first, on polar bears, was rated neutral because it does not include any discussion in the abstract germain to the attribution of recent global warming. The abstract of the second reads as follows:
"The authors investigate how the global monsoon (GM) precipitation responds to the external and anthropogenic forcing in the last millennium by analyzing a pair of control and forced millennium simulations with the ECHAM and the global Hamburg Ocean Primitive Equation (ECHO-G) coupled ocean–atmosphere model. The forced run, which includes the solar, volcanic, and greenhouse gas forcing, captures the major modes of precipitation climatology comparably well when contrasted with those captured by the NCEP reanalysis. The strength of the modeled GM precipitation in the forced run exhibits a significant quasi-bicentennial oscillation. Over the past 1000 yr, the simulated GM precipitation was weak during the Little Ice Age (1450–1850) with the three weakest periods occurring around 1460, 1685, and 1800, which fell in, respectively, the Spörer Minimum, Maunder Minimum, and Dalton Minimum periods of solar activity. Conversely, strong GM was simulated during the model Medieval Warm Period (ca. 1030–1240). Before the industrial period, the natural variations in the total amount of effective solar radiative forcing reinforce the thermal contrasts both between the ocean and continent and between the Northern and Southern Hemispheres resulting in the millennium-scale variation and the quasi-bicentennial oscillation in the GM index. The prominent upward trend in the GM precipitation occurring in the last century and the notable strengthening of the global monsoon in the last 30 yr (1961–90) appear unprecedented and are due possibly in part to the increase of atmospheric carbon dioxide concentration, though the authors’ simulations of the effects from recent warming may be overestimated without considering the negative feedbacks from aerosols. The simulated change of GM in the last 30 yr has a spatial pattern that differs from that during the Medieval Warm Period, suggesting that global warming that arises from the increases of greenhouse gases and the input solar forcing may have different effects on the characteristics of GM precipitation. It is further noted that GM strength has good relational coherence with the temperature difference between the Northern and Southern Hemispheres, and that on centennial time scales the GM strength responds more directly"
The first thing you will notice is that it says nothing to dismiss the attribution of at least 50% of recent global warming to anthropogenic factors. On the contrary, it several times mentions CO2 forcing (an anthropogenic factor) as a relevant forcing, and as a cause of recent warming. Specifically, it is stated:
"The simulated change of GM in the last 30 yr has a spatial pattern that differs from that during the Medieval Warm Period, suggesting that global warming that arises from the increases of greenhouse gases and the input solar forcing may have different effects on the characteristics of GM precipitation"
Given reasonable background information about the relative strengths of anthropogenic and solar forcing, that represents an implicit endorsement that >50% of recent warming was anthropogenic. However, we don't need to dig that far in. The paper uses climate models which are known, given historical forcings, to show humans as responsible >50% of recent warming. Absent an explicit disclaimer indicating that the authors are not using standard historical forcings, that again respresents an implicit endorsement. The paper was in fact rated as Explicitly endorsing but not quantifying, ie, a 2, and that is arguably a mistake. (I would rate it as 3, implicitly endorsing.) It is, however, a mistake that makes zero difference to the headline result of Cook et al.
Now it is possible that Soon and his coauthors did clearly indicate the use of radically a-historical forcings in the depths of the paper. The raters did not get to see the depths of the paper, however. They rated on the abstract and therefore a rating justified by the abstract, though contradicted within the paper merely shows that abstracts often poorly communicate the contents of papers, not that the raters made a mistake. Further, raters clearly rated abstracts, not authors. If Willi Soon is really saying that he (rather than an abstract of one of his papers) was rated as endorsing the consensus, then he either completely misunderstands the study he is criticizing (nothing new there) or completely misrepresents it.
Turning to Craig Idso, he also has to papers rated, one of which was rated as neutral. The second, which was rated as implicitly endorsing the consensus, had the following abstract:
"Since the early 1960s, the declining phase of the atmosphere’s seasonal CO2 cycle has advanced by approximately 7 days in northern temperate latitudes, possibly as a result of increasing temperatures that may be advancing the time of occurrence of what may be called ‘climatological spring.’ However, just as several different phenomena are thought to have been responsible for the concomitant increase in the amplitude of the atmosphere’s seasonal CO2 oscillation, so too may other factors have played a role in bringing about the increasingly earlier spring drawdown of CO2 that has resulted in the advancement of the declining phase of the air’s CO2 cycle. One of these factors may be the ongoing rise in the CO2 content of the air itself; for the aerial fertilization effect of this phenomenon may be significantly enhancing the growth of each new season’s initial flush of vegetation, which would tend to stimulate the early drawdown of atmospheric CO2 and thereby advance the time of occurrence of what could be called ‘biological spring.’ Working with sour orange (Citrus aurantium L.) trees that have been growing out-of-doors in open-top chambers for over 10 years in air of either 400 or 700 ppm CO2, this hypothesis was investigated by periodically measuring the lengths, dry weights and leaf chlorophyll concentrations of new branches that emerged from the trees at the start of the 1998 growing season. The data demonstrate that the hypothesis is viable, and that it might possibly account for 2 of the 7 days by which the spring drawdown of the air’s CO2 concentration has advanced over the past few decades."
Cutting to the chase, the authors are suggesting an alternative explanation to the fact that spring is coming earlier than it did in the past. The standard explanation is that it is warmer earlier. Craig Idso's alternative explanation in terms of the CO2 fertilization effect is found to be a viable hypothesis, that "... might possibly account for 2 of the 7 days by which the spring drawdown of the air’s CO2 concentration has advanced over the past few decades." The might, possibly indicates not only uncertainty, but the upper range of the potential effect. That is, it might account for 28.6% of the botanical effect of an early spring (and zero of the effect on animals). That leaves around 70% still attributable to the traditional explanation, ie, the increased warmth.
To my mind, that is not enough to rate the paper as implicitly endorsing the consensus; though only because the consensus is implicitly defined as relating to attribution on which the abstract says nothing. Therefore this is a case of an abstract that was rated (3), but should have been rated, IMO, (4).
Note again that the ratings are not rating authors, and not rating papers. However, Cook et al did include a rating of papers by the authors. Comparison between it and the abstract ratings showed that by far the most common "error" was rating papers that endorsed the consensus as not endorsing the consensus. Again, if Craig Idso understood Cook et al, he would know that to be the case. He would know that pointing out one or two potential errors without pointing to the overall error statistics as shown be comparison of the abstract and author self ratings is a blatant cherry pick. Indeed, that is probably why he claims the error, but does not draw attention to the results of the author self ratings.
- The 97% v the 3% – just how much global warming are humans causing?
MA Rodger at 22:23 PM on 20 September, 2014
jwalsh @63 & @65.
Being as generous as I can , Figure 3 from Mann et al (2008) here shows perhaps 0.1ºC per century rise for the NH "since 1600 or so", about 7% of the 20th century rise. (Being less generous, note that some of the reconstructions are flat with zero warming.) I'm not sure how much of the warming is attributable to the Maunder Minimum/Dalton Minimum - probably the lion's share. When solar forcing is considered for the post-1950 contribution, it will be small but cooling.
So using Mann et al (2008) to argue for a significant natural contribution to the global surface warming since 1950 (33% to 25% is quoted @63) doesn't make any sense to me.
- The anthropogenic global warming rate: Is it steady for the last 100 years? Part 2.
K.a.r.S.t.e.N at 00:04 AM on 18 May, 2013KK Tung @10:
I am referring to forcing from tropospheric (anthropogenic) and stratospheric (volcanic) aerosols likewise. They have an impact on both, the AMOC and the AMO. Sure, the response of the AMOC to external forcing is slower and hence harder to identify, but neither AMOC nor AMO are independent of it. I agree that the AMO is influenced by the AMOC (how can it not). The exact linkage is still under debate. However, I strongly disagree with your reply to Kevin C in post 8 and your notion that a volcanic impact on the AMO is unlikely. Let me try to convince you.
In your paper, you wrote: “The 20-y small dip in temperature near 1810 coincides with the solar Dalton Minimum, but is probably caused by a negative excursion of the AMO. The rising AMO cycle in the first half of the 19th century produced a warming, despite the eruption of Tambora (1815), the largest in the past four centuries.”
The problem is that we have a strong volcanic eruption in 1809 (unknown tropical eruption; see Cole-Dai et al. 2009 or Arfeuille et al. 2013), followed by the 1815 Tambora eruption (strongest eruption in the last centuries). Hence I have no doubt whatsoever as to what the reason of the negative AMO excursion is. It’s entirely attributable to these two strong eruptions. The surface air temperature over the Atlantic-Arctic boundary in your Fig.3C perfectly matches the timing of these eruptions. If we go on to the 1830s, we see the next dip which perfectly matches with the Babuyan Claro eruption (1831) and the next very strong eruption at Cosiguina in 1835. The dip around 1860 is stronger than one would expect from the amplitude of the corresponding eruption recorded in 1861, only to have a clear signal for the Krakatau eruption in 1883 again. Note that the exact magnitude of the volcanic forcing differs between different estimates. I plotted the older dust veil index (DVI) and the newer ice core index (ICI) from Crowley and Unterman 2012 for the time period 1750-2000 in order to illustrate my point.
Moreover, I consider it very likely that volcanic eruptions do have a measurable effect also on the AMOC. Gleckler et al. 2006 and Stenchikov et al. 2009 demonstrate that a persistent deep ocean signal emerges after strong volcanic eruptions. Therefore, most of the time the climate system is not in an equilibrium state as it takes several centuries to get rid of any remaining signal from volcanic eruptions. As soon as there is a lull in volcanic activity, the climate system warms in order to restore equilibrium. I don’t know how strong this warming signal is, but it definitely plays a role in post-volcanic periods such as that between 1910-1940. I agree with Tom Curtis (post 40), that this period saw some additional warming in the North Atlantic region due to increasing black carbon forcing (while anthropogenic sulfate forcing was barely rising during that very time). The external forcing impact on the AMOC is also widely discussed in the literature, with numerous suggestions as to what mechanisms could be at play. I would like to point at a very recent paper by Menary et al. 2013 or another one by Iwi et al. 2012. It goes without saying that undoubtedly internal AMOC variability exists undoubtedly. The review paper by Kuhlbrodt et al. 2007 gave a good overview.
Similar to what Kevin C did (see post 21), I recently developed my own two-box EBM model which accounts for volcanic eruptions at two time-scales: A fast surface temperature response which more or less coincides with the stratospheric AOD evolution, and a slow response which accounts for the deep-ocean signal as shown for the Tambora and the Pinatubo eruptions in Stenchikov et al. 2009. In addition, instead of using the GISS forcing (which I personally consider not very accurate regarding the tropospheric aerosol forcing) I used the forcing time series for sulfate and black carbon aerosols presented in Skeie et al. 2011. The resulting forcing function (nudged towards NH conditions) for the 1750-2010 period looks like this (I can provide more details upon request):

Not only are the volcanic spikes easy to identify, but also becomes their long-term effect noticeable. I am not claiming that this is the real volcanic fingerprint which we find in the observations, but it indicates where we might have to look for a forced disturbance in the thermohaline circulation, may it be the AMOC or ENSO/PDO. Let’s compare the forcing function with the NH instrumental observations and reconstructions:

Note that the temperature response in Europe as represented by the Berkeley Best data and Baur temperature series (both are comparable with the AMO temperature trends) is not always in phase with the rest of the NH. In fact, there is reason to think that the NAO response to volcanic eruptions is preferably positive. Fischer et al. 2007 have a good discussion on that. Assuming that the NAO and the AMO mutually influence each other, stochastic multi-annual or decadal variations as a result are all but surprising. Even in the absence of NAO-like atmospheric variability, Deser et al. 2010 brilliantly illustrate how white noise from pure random atmospheric heat flux variations turns into (oceanic) red noise. The time scale of the resulting SST fluctuations depends on the ocean mixed-layer height. It is interesting to note that the mixed-layer depth of the North Atlantic is comparably high, particularly in winter, which can easily explain the high standard deviation of its SSTs. The same is true for large portions of the North Pacific.
This brings me to DelSole et al. 2011, which you cited in your response. Likewise, they identified these very regions as most variable. However, I can’t see how the “projection” of the observed temperatures onto this pattern removes the problem of unreliable model forcing. As can be seen from my best-guess forcing assumption for the NH (which includes aerosol indirect effects, which most models omit altogether), the real forcing has likely been considerably more variable than assumed in your analysis as well as in their analysis (which is based in the forcings of the models used). This can also be illustrated by looking at the NH/SH inter-hemispheric temperature trend. Not only does it differ considerably, but also is the NH instrumental record strongly correlated with the anthropogenic sulfur emissions, which is almost certainly not a mystic coincidence.
Many other issues regarding the robustness of your results have been raised in the discussion already. I agree with Tom Curtis (post 11/15) on the magnitude of the AMO signal in the NH temperature variance, which I believe your method terribly deflates, as well as on the consistency and significance of the oscillation in the data (post 15/20), which I believe you have not demonstrated. Conservation of energy is another is another big problem (see e.g. KR in post 14) which you have so far failed to address properly.Finally, let me show you what happens if we extend the forcing time series back in time and keep comparing it with paleo-reconstructions. With a low-pass filter it looks like this:

From a NH point of view, the AMO plays a minor role as far as the temperature evolution is concerned. Not to mention global temperatures. The AMOC is important on longer time scales, typically in response to slow changes in external forcing. On shorter time-scales, AMOC changes can have strong regional impacts. The AMOC shutdown in the context of the 8.2ka event as the prime example for its response to strong fresh water pulses.
- This is Global Warming - A Lesson for Monckton and Co.
catamon at 00:06 AM on 19 December, 2012
Ok, people riddle me this, and please correct me if i am misunderstanding. I have seen it written on no less reliable site that the Lord Monktons himself that:
"The 16-year temperature stasis that has now occurred must be explicitly faced."
and:
"one might argue that the relatively weak warming signal from CO2 has been overlain by three recent natural influences: in late 2001 we entered a ~30-year cooling phase of the ~60-year cycle of the ocean oscillations; the current ~11-year solar cycle displays near-unprecedentedly weak solar activity, implying the possibility of a Dalton or even Maunder minimum in the coming decades; and there has recently been a double-dip La Niña."
So, for arguments sake i'll make a perhaps bold assumption that the above quotes are believable.
That means that with 3 theoretically cooling influences referred to currently in play, we are in a "temperature stasis", not measurably cooling as i would expect.
The question is then, what's keeping us warm if not CO2 and what happens when CO2 levels are higher than now, and there is strong solar activity, and we are in a warming phase of the 60 year cycle of ocean oscillations, and there is an El Nino?? - New research from last week 16/2012
Flakmeister at 23:55 PM on 24 April, 2012
Came across this
http://hinode.nao.ac.jp/news/120419PressRelease/index_e.shtml
I seen commentary to the effec that this might presage a new Dalton-like minimum....
Any insights out there? - Prediction: New Surface Temperature Record in 2013
owl905 at 15:32 PM on 13 March, 2012
From here, Dana1981 has put out a mid-line forecast for 2012. While some of the factors are treated aggressively, Cycle 24's dance with El Nino appears to be conservative. In contract to Dale 21 forecast, Cycle 24 is ready to roll. Hathaway's reduced forecast was partly a reaction to the screaming memee's yelling Dalton Minimum cooling.
Hathaway's revised forecast
But like many of the recent redacts and retracts, Solar Cycle may have a Cycle 23 punch in it - not never, just late.
Spotless quiet days:
Current Stretch: 0 days
2012 total: 0 days (0%)
2011 total: 2 days (<1%)
2010 total: 51 days (14%)
2009 total: 260 days (71%)
(Source http://www.spaceweather.com/)
And the sunspot activity is rising, not sputtering along - March is already beating Hathaways max 2 years ahead of his 'peak':
Sunspot Activity Bar Chart
Some volcanic activity would actually be a bit more good luck (put Tom Hanks and Meg Ryan under house arrest for the duration).
The GHG concentration is primed for a combination with Cycle 24 and an El Nino - not only is warming back on, but the shallow ocean temp trend pushes up, and there's a lottery with the winning region getting a scorch. China hasn't been mauled yet ... they're due.
Whattaworld - hoping for a volcanic surge and a La Nina ... - Measurements show Earth heating up, think tanks & newspapers disagree
lord_sidcup at 00:19 AM on 2 February, 2012
You missed the really fun bit of Rose's article (credit to Carbon Brief). Rose says:
According to a paper issued last week by the Met Office, there is a 92 per cent chance that both Cycle 25 and those taking place in the following decades will be as weak as, or weaker than, the 'Dalton minimum' of 1790 to 1830.
The Met Office press release actually says:
The most likely scenario is that we'll see an overall reduction of the Sun's activity compared to the 20th Century, such that solar outputs drop to the values of the Dalton Minimum (around 1820). The probability of activity dropping as low as the Maunder Minimum - or indeed returning to the high activity of the 20th Century - is about 8%. The findings rely on the assumption that the Sun's past behaviour is a reasonable guide for future solar activity changes.
Do you see? If there is an 8% chance of a new Maunder Minimum, there must be a 92% chance of a new Dalton Minimum. Prof Lockwood actually puts the chance of minimum similar to the Dalton Minimum at 50%. - 9 Months After McLean
Tom Curtis at 11:01 AM on 10 November, 2011
Fred Staples @48 indulges in some serious misrepresentation of the temperature record which requires a serious response.
He begins by characterizing "all available data" as showing "a steady rise from the little ice age, peaking in the forties". The best available data set for that period is the HadCRUT3v temperature index which commences in 1850. (BEST is land only, while GIStemp starts in 1880, making neither suitable.) The plot of HadCRUT3v below (from woodfortres.org)shows the trends from 1850 to 1910, 1910 to 1940, 1940 to 1975, and 1975 to 2010. Trends where plotted to encompass known inflection points, and to ensure that they were at least 30 years long to ensure statistical significance:

Fred correctly describes the period from 1940 to 1975 (actually '79) as a slow fall. Given that, his description of the period between 1850 and 1910 as part of "a steady rise" is not only false, but shows clear bias in interpretation of the data.
This fall in temperature from 1850 to the early twentieth century is a feature of almost all temperature reconstructions over the last 1000 years:

Indeed, most also show a rise in temperature from the end of the Little Ice Age to a peak around 1790 which is as hot as, or hotter than 1850, before a sharp fall for the Dalton Minimum and Mount Tamora Eruption, before a further rise to 1850 (actually closer to 1865 on HadCRUT3v). The temperature record is anything but a gentle rise from the LIA to 1940. Rather, it staggers around like a drunken miner under the influence of known changes in forcings - while post 1975 it rises sharply under the influence of other known changes in forcings, primarily due to changes in Green House Gas concentrations.
Fred's characterization of the period from the LIA to 1940 as "a steady rise" is, of course, an attempt to feed into the fake "skeptic" meme of a "recovery" from the LIA. That idea is nonsense as an explanation, and contradicted by the data.
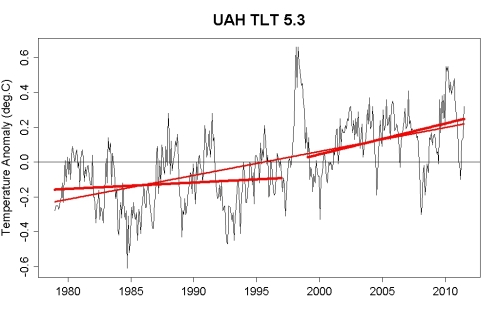
Turning to more recent times, Fred immediately changes his data source. If you look at my first figure, you will see why. Desperate to avoid clear evidence, Fred Cherry Picks the UAH data set, which he characterizes is containing to flat intervals separated by "step change". In other words, having cherry picked his data set, he also needs to cherry pick his intervals. He tries to go down the up elevator.
Tamino has dissected similar nonsense from Bob Tisdale:
(Note, Tamino's second trend is from 1999, whereas Fred cherry picks 2002 as the start date for his second trend. That does not prevent the trend from being towards increased warmth, but it does reduce it.)
Given the extent of Fred's cherry picking, the obvious thing to do is to check alternative sources of data to see whether the low trend from 1979 to 1997 is just a result of short term variations. Fortunately radiosondes have taken temperature series from approximately the same altitude that is measured by the TLT "satellite" channel:
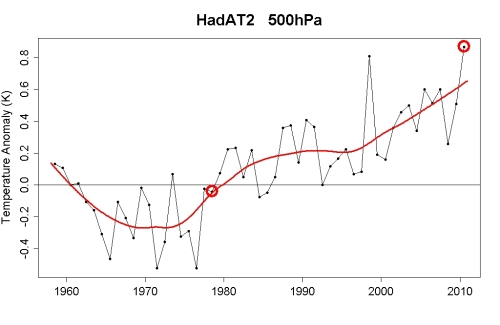
Clearly the rise in temperatures around 1981-3 is just a short term fluctuation, and the long term trend from the mid 1970's to 1997 is rising. In addition to his explicit cherry picking, Fred is highly dependent on the truncated nature of the satellite record to make his case.
Finally, we are frequently told that posting here is a privilege, not a right. Abusing data as Fred does shows his clear intent to abuse that privilege. - Global Surface Temperature: Going Down the Up Escalator, Part 1
Tom Curtis at 16:42 PM on 5 November, 2011
Camburn @23, yes, you are playing tricks.
The first obvious trick you are playing is the appeal to uncertain data to undermine the impact of well known data. The following graph shows the upper and lower bounds of the 95% confidence interval of BEST data, along with trends:

Although these show the trends of the confidence interval rather than the confidence interval of the trend, it is clear that data prior to 1880 is insufficiently exact to distinguish with confidence between zero trend over the course of the 19th century, and a moderate trend (0.14 degrees C per decade), although substantially less than that of the last 40 years.
When the denier habit of using short trends which lack statistical significance (because they are short) is shown for the smoke and mirrors it is, you appeal to long trends which still lack statistical significane because of the uncertainty of the data. It's the same trick, it just had not yet been exposed.
I should note that any long term trend in the 19th century is almost certainly not due to the mythical "recovery from the little ice age", but entirely due to some exceptionally cold years at the start of the 19th century due to the Dalton Minimum and the eruption of Mount Tambora. Indeed, examination of the BEST 20 year average data shows the late 18th century to have been about as warm as the 1850's (with very low confidence).
Your second trick is asserting straight out falsehoods such as "[the] GissTemp as the extrapolation does not match DMI observations". Really?

- Berkeley Earth Surface Temperature Study: “The effect of urban heating on the global trends is nearly negligible”
Tom Curtis at 10:39 AM on 3 November, 2011
Lancelot @29, you specifically ignore the first, and rapid decline from 1800 to 1815. To the extent that that represents a signal in global temperature rather than an artifact of the limited regional coverage, it is likely that that decline comes from an even higher peak prior to 1800. That is because the Dalton Minimum, the presumed cause of the decline, began in 1790, and followed a peak in solar activity (as determined by sunspots) greater than any in the 20th century other than 1950.
Consequently, the presumption of your first post of "a gradual and fairly uniform (if smoothed) global rise from at least 1800* to 1939". The evidence from BEST is of a major temperature excursion early in the record followed by a gradual rise from 1850 to 1910, followed by a rapid rise to 1940, a steady declind to the 1970's, and then a still more rapid rise to the 2000's. - Berkeley Earth Surface Temperature Study: “The effect of urban heating on the global trends is nearly negligible”
lancelot at 07:04 AM on 3 November, 2011
27, 28: Nice to see the full graph at last! Well... I did say 'if smoothed'. Over 60 year periods, if smoothed on that basis the line is gradual (repeat gradual) and fairly (repeat fairly) uniform. I have done that on paper, that is how it looks. The total is a long term rise of about 0.9 deg C over 140 years.
Tom Curtis - I totally agree however with your more detailed analysis. A rise 1800-50. A flat period 1850-1910. Then a sharp rise 1910-40. That actually illustrates my point. If you start the chart at 1850, you see a flat period until the start of the 20th century, then a prominent rise. So it looks as if warming started in 1910. It didn't. It started at least before 1800.
Sphaerica: It is clear (even to a non-climatologist) that volcanic eruptions and solar irradiance variation will cause the visible intermediate ups and downs within the longer time scales. In that context you also referred to the Dalton minimum and 'solar activity', i.e. sunspots. Does that mean that you consider sunspots to be associated with forcing or with climate changes in general? - Berkeley Earth Surface Temperature Study: “The effect of urban heating on the global trends is nearly negligible”
Bob Lacatena at 00:31 AM on 3 November, 2011
26, lancelot,
I think part of your misunderstanding resulted from treating the noise we see in shorter periods (the ups and downs in, say, the 1980-2000 period) the same as valid ups and downs in longer periods. The physical reasons for the ups and downs in the shorter periods are (a) not entirely predictable and (b) not entirely worth predicting, because they refer to very short term events with no lasting effect on climate beyond the affected year or years (ENSO events, volcanic eruptions, minor changes in solar activity, etc.).
Put another way, there are so many factors that overwhelm the signal that in shorter periods you have to average things out and look at longer time periods to detect a trend.
But when looking at a graph such as this one, there really are tangible reasons for the various, intermediate ups and downs (the Dalton Minimum, a long term increase in solar activity, a large series of major volcanic eruptions, anthropogenic aerosols, anthropogenic CO2).
The point is, the rules you apply to interpreting the data (which is being done by most people -- not scientists -- simply by eyeballing graphs) must change depending on the time scale. The fact that two graphs look the same does not mean that you apply the same rules to their interpretation.
The bottom line is that you need 17 to 30 years to determine a climate trend. That rule applies whether the hashmarks on the graph represent 1 year or 20 years. You don't need a number of hashmarks or a percent of a graph to identify a trend in climate... you need whatever span represents 17 to 30 years.
As such, you can't look at a graph of temperatures from 1990 to the present and properly divide it into distinct, separate trends, but you do need to look at a graph such as this one and do so. - Berkeley Earth Surface Temperature Study: “The effect of urban heating on the global trends is nearly negligible”
Tom Curtis at 22:56 PM on 2 November, 2011
lancelot @26, your description of the graph is false:

Where you say the graph rises smoothly, it clearly falls for the first 15 years, probably due to the Dalton Minimum. It rises sharply, then falls sharply before leveling of around 1850. From 1850 to 1910 it oscillates around a mean before rising sharply to 1940.
Not much weight can be given to the early years (pre-1880) of the BEST temperature index. During that period, due to a low number of stations, and poor geographic coverage the calculated error margin is as high as +/- 0.6 degrees, or approximately 30% of the calculated fluctuations. Tamino believes this error is significantly underestimated because BEST ignored auto-correlation. The poor certainty, and in particular the limited geographical coverage is probably responsible for most of the large scale fluctuations relative to latter in the graph.
Despite these flaws, however, it is still necessary to describe the graph as it is, not as we might desire it to be. - Why Wasn't The Hottest Decade Hotter?
R. Gates at 15:41 PM on 15 July, 2011
This study certainly offers a plausible scenario for the slowing of the rise in global temperatures. An important measurement will be the average temperatures of the decade from 2010-2019. There could be a real mixed bag here. Fro example:
How much will the sulfate aerosol emission from China have slowed in the decade?
What if we enter into a Dalton or Maunder type minimum with the sun?
What if we have a series of La Nina years continuing through the decade?
Given this potential "triple whammy" of cooling forces, if somehow 2010-2019 is even hotter as a decade than 2000-2009, this will certainly be quite telling, or even if temperature simply level for the period. If you listen to the AGW skeptics, they are preparing for a Little Ice Age to begin any day now and to last for decades. I think they'll be disappointed, but, considering what it means for continued warming, you almost wish they would be right. - Lessons from Past Climate Predictions: Don Easterbrook
Miriam O'Brien (Sou) at 05:18 AM on 29 June, 2011
In the article you quote Don Easterbrook as saying "the 30-years of global cooling that we experienced from ~1945 to 1977. However, also likely are several other possibilities (1) the much deeper cooling that occurred during the 1880 to ~1915 cool period, (2) the still deeper cooling that took place from about 1790 to 1820 during the Dalton sunspot minimum, and (3) the drastic cooling that occurred from 1650 to 1700 during the Maunder sunspot minimum."
My question is, why did he pick the start period for his ummm 'predictions'? Did he just conveniently skip all the years from 1977 to now? And how successful is his 'model' in hindcasting? How does he explain why it got so hot in recent years - or the overall rise in temperature of the entire past century? If his 'cycles' were merely 'cycles', why is the temperature not yet back to, say, that of 1700? Just when does he expect the whole 'cycle' to complete?
A lot of questions, I know. I don't expect him to answer any of them :D - How would a Solar Grand Minimum affect global warming?
Eric the Red at 12:03 PM on 23 June, 2011
I was not aware that anyone was predicting an ice age.
At this point it is just speculation, although it has been postulated for almost five years now, and the data is leaning closer to such an event. Others have predicted a Dalton-like minimum, similar to the 19th century. From a scientific standpoint, it would be fascinating to observe and measure, if it were to occur. - How would a Solar Grand Minimum affect global warming?
Eric the Red at 01:11 AM on 22 June, 2011
The discussion on RC has linked to some earlier papers whcih described the potential for a solar minimum.
http://www.schulphysik.de/klima/landscheidt/iceage.htm
http://sesfoundation.org/dalton_minimum.pdf - The Day After McLean
NewYorkJ at 04:10 AM on 30 March, 2011
"David Archibald is a Perth, Australia-based scientist operating in the fields of cancer research, oil exploration and climate science. After graduating in science at Queensland University in 1979, Mr Archibald worked in oil exploration in Sydney and then joined the financial industry as a stock analyst. Mr Archibald has been CEO of multiple oil and mineral exploration companies operating in Australia. He has published a number of papers on the solar influence on climate, and is a director of the Lavoisier Society (Lavoisier Group), a group of Australians promoting rational science in public policy."
Australian Climate Science Coalition
Google Scholar reveals those "papers" are mainly E&E and non-peer-reviewed stuff. Here's one:
Solar cycles 24 and 25 and predicted climate response
"Based on solar maxima of approximately 50 for solar cycles 24 and 25, a global temperature decline of 1.5°C is predicted to 2020, equating to the experience of the Dalton Minimum."
Have fun with that one. Would be fun to see this plot on Dana's graph (the vertical axis would need to be nearly doubled for it to fit), perhaps in a different post that examines Archibald's past predictive powers.
I'm trying to figure out where Archibald gets his Dalton Minimum info from. On Wikipedia, the DM page has a similar statement that references "Archibald says" with no link. Pretty sloppy page overall.
Dalton Minimum - Hockey Stick Own Goal
Tom Curtis at 00:12 AM on 1 March, 2011
HR @128, I do mean the Medieval Warm Period. During the Medieval Warm Period, there was an exceptionally low number of volcanoes, particularly at the beginning. Because of the reduced aerosol load that follows, there is significant warming (at least in Husserl's models). A similar, though not as extensive, lack of vulcanism occurred in the early twentieth century, and may partly explain the very warm temperatures in the 1930s and 40s.
Volcanoes are short lived, but their aerosols can remain aloft in significant quantities for several years. As a result, if several volcanoes occur in a decade, it can significantly lower temperatures for that decade. Given that a single large voclanoe can depress temperatures by up to 0.5 degrees for three years or more, even one large event can drag down the average.
In that context, consider the sulfate load in a greenland ice core during the Dalton Minimum:

As you can see, there were two very large volcanoes in that periods, and a continuous sulfate load in the atmosphere. The 1815 volcano (Tambora) is estimated to have generated 14 w/m^2 forcing. Assuming scaling is linear, the background sulfate level would have generated a forcing around -0.5 to -1 w/m^2, or enough for around a 0.5 degree equilibrium decrease in global temperatures after feedbacks. Half a century without volcanoes would remove that negative forcing, and could result (accordingly) in an increase in global meant temperature of up to 0.5 degrees, ie, the equivalent of the MWP. - Monckton Myth #10: Warming in the Pipeline
Marcus at 13:07 PM on 13 February, 2011
Thanks for clarifying that Dana & Muon. I knew I only had part of the story. Any look at CO2 vs solar forcing for the last 120 years shows that CO2 easily swamps solar. Its worth noting that solar forcing grew from almost zero during the Maunder/Dalton Minimum periods up to the highs of the mid-20th century, yet that produced-at best-a +0.6 degree warming over a period of about 200 years. By contrast, we've seen a +0.6 degree warming in just the last 60 years-with +0.5 degrees of that being in the last 30 years-which represents an almost 10 times more rapid warming trend than from Solar "alone" (I say alone, though for the period of 1900-1950 CO2 was almost certainly playing a minor role). IMO, that really does highlight how powerful greenhouse gases are at boosting temperatures-compared to solar forcing alone-something further reinforced by a consideration of how much hotter our planet was 500 million years ago-in *spite* of the sun being significantly cooler than today. - We're heading into cooling
Henry justice at 10:29 AM on 26 January, 2011
The effects of man's CO2 is wildly exaggerated. The global warming since the mid-1970s to 1999 and for the last century is mostly due to reductions in the rate of global ocean deep-water circulation—or Meridional Overturning Circulation—which has occurred. Global temperatures have followed closely the fluctuations in solar output and ocean circulation cycles, not carbon dioxide trends. This circulation is driven by global ocean salinity variations. CO2 changes play no role in these ocean changes. Scientists now report that the doubling of atmospheric carbon dioxide would raise global temperatures a mere 1 degree Celsius. Atmospheric carbon dioxide levels have risen by less than 50 percent since the dawn of the Industrial Revolution. The contribution of CO2 is minute at best.
I don't see abnormal or unnatural global temperature rises as evidenced bu NASA's own data, taking out the corrupting urban stations. No visual upward slant over many previous decades are seen no matter where you click. Just the natural up and down temperature wiggles you would naturally expect. Check it out on this site and see for yourself: What the Stations Say!
http://www.john-daly.com/stations/stations.htm#The South Atlantic
However, what needs watching is whether the sunspots disappear in around 2015 and we tip from a Dalton to a Maunder like minimum. Also, watch for the buildup of summer snow (or decreasing summer melt). We do need to get rid of the brownish haze I see every time I fly in an airplane. That has to cause some dimming. - We're heading into an ice age
Henry justice at 14:02 PM on 30 December, 2010
The historical record indicates that we are now in a repeat Dalton like minimum (called Landscheidt).
This is expected to last through solar cycle 25. However, around 2015 or so, its expected that the solar gauss will fall below 1500. Then the sunspots may wink out completely.
It is further predicted that a new Maunder like minimum will then begin. So, global cooling has, in fact,begun and will last most likely for the next 70 or 80 years.
See this site: http://www.landscheidt.info/?q=node/61
Also, I checked the worlds annual mean temperature charts. Not much of a visual upward slant in temperatures everywhere I looked world wide for the last 50 years. The urban site temps were not used as they are unreliable. So upward and downward wiggles appear all but natural variations. Look for yourself and you be the judge!
See this site:http://www.john-daly.com/stations/stations.html
In Greenland, eight WW2 bombers from the "lost squadron" were found in 1986 under 267 feet of ice. How's that for melting glaciers? I didn't take the rest of the article seriously.
See this site: http://www.2012online.org/2012research/iceage/
For the new little ice age that's emerging now:
see this site:
mail.google.com/mail/hl=en&shva=1#inbox/12d1de941be48ea3 - Global cooling: the new kid on the block
Henry justice at 09:49 AM on 17 December, 2010
This site needs updating in light of the greatly reduced sunspots of Solar Cycle 24. It appears now to be a repeat Dalton minimum with overtones of morphing into a new Maunder minimum if the sunspots flat lines out after 2015. Some believe we are in for several decades of global cooling. Will global cooling or anthropogenic global warming become more pronounced as the years roll forward? - What would happen if the sun fell to Maunder Minimum levels?
Henry justice at 07:01 AM on 14 December, 2010
We are now in a repeat Dalton Minimum. There is a very good chance that afterwards by 2020, a grand Maunder like minimum will begin. Cosmic ray flux will increase and lead to more clouds, further cooling the Earth. Long term solar activity minimums have occurred in the past when the center of mass of the solar system (the Sun and external planets without Jupiter) was outside of the Sun. The trigger for the initiation of sunspots is the falling of celestial bodies (comets, asteroids and others) from the Oort cloud and Koiper belt onto the Sun. The gravitation of fields of the Sun and planets govern the motions of these bodies and direct these celestial bodies to the Sun's surface. When the center of mass of the solar system is outside of the Sun most of these celestial bodies do not fall on the Sun and a long-term solar activity minimum begins. The maximum value of Rz is predicted not to exceed 50.
See ref: New Maunder Minimum in Solar Activity and Cosmic Ray Fluxes in the Nearest Future, Stozhkov and Okhlopkov, 3-6 August, 2010, 22d European Cosmic Ray Symposium, Turku, Findland. - It's cooling
daybyday at 07:11 AM on 26 November, 2010
I'm one of those idiot skeptics.
No matter how hard I try to become alarmed about the warming earth--I simply can't. Yes, it looks like we're warming but it appears I am too dumb to understand the charts behind the charts and know the numbers behind the numbers. Naive me, I just looked up facts and figures a few years ago to see what was happening--yikes--the earth HAD NOT BEEN HEATING up, despite what alarmists said. What was everyone talking about? Then 2005, 2008, and now 2010 show some heat and gives the alarmists tingles up and down their leg...I read the reports from NASA, they wrote, "It now seems pretty certain 2010 will outpace 1998, which currently ties for fourth hottest year in the NASA dataset." So I looked at their chart.
I feel left out becasue it doesn't give me tingles. There is a record high March....uh... your point is? No other months seem remarkable. So one month spikes the charts and the stats and the global warming "trend" is intact. June, July, and August were cooler than the other comparison years.
So in order to try and make this look serious NASA writes: "Continuing the trend from the previous month, NOAA reports that May, the period from March to May, and from January to May all have had the hottest combined global land and ocean surface temperatures since records began in 1880. "
I read the chart from NASA--they have to use the word "combined" and "since 1880" to make the stats look scary. March was the only scary month of this year, if global warming scares you.
Just last week SeaTac recorded the coldest temp ever recorded for this month at the airport. Ohhh-maybe if I combine it with some other cold records I can manipulate the stats to refute NASA?
But i don't take the cooling alarmists that seriously either. Geologist Dr. Don Easterbrook's projected cooling for the next several decades and is based on past PDO patterns for the past century and temperature patterns for the past 500 years. Three possible scenarios are shown: (1) global cooling similar to the global cooling of 1945 to 1977, (2) global cooling similar to the cool period from 1880 to 1915, and (3) global cooling similar to the Dalton Minimum from 1790 to 1820.
At this point, I don't believe any of you--not Dr. Easterbrook--not the bots at the bottom of the sea not NASA and NOAA--
Until Greenland has the green meadows and longer growing season it enjoyed in the 1400's I won't buy into the "warming" craze--and if it happens I will be happy for the planet because those warmer periods bring a cornucopia of plenty to the earth and its people (polar bears survived that period just fine). and if the glaciers return with a vengeance, I will be happy becasue it will make it harder for man to survive and that is how we advance--by overcoming adversity.
On a final note: Dear Esop, you wrote, "Nature is turning all the natural drivers to Max Cool and September was still the warmest by far." Did you look at the charts by NASA? Sept was hotter than 1998, yes, but cooler than 2005 and a number of other years. and this June, July and August were cooler than all the comparison years.
But like I said, I can't understand the secret numbers behind the numbers, and charts behind the charts and I am certainly way too simple to understand the cycles of nature and cooling and warming. I just read history and take the numbers at face value--how dumb is that? - Does Climate Change Really Matter?
Arkadiusz Semczyszak at 21:22 PM on 22 September, 2010
“Big storms and extreme weather require a lot of energy to drive them.”
Nothing could be further from the truth. Great storms require a considerable variation in energy over a small area.
The violent weather phenomena occur in the specified temperature range. Hence warming - only if in a strictly defined temperature range - will increase the number of extreme events. The same cooling.
This explains the theory of fluid mechanics. On the surface hydrophobic water droplets combine (and simultaneously disconnect) rapidly only in the specified temperature range. The increase in temperature causes the droplets merge is declining, growing up (more "lazy") drops consisting of several smaller drops. They join fewer and much milder.
Also, if we treat the global atmospheric circulation as a cybernetic system, we understand that with the increase of the energy supply to such an system, he will be able to run additional feedbacks stabilizing system - number of extreme events as a result of warming MUST be reduced.
Polish scientists (Natural Disasters, 2008.) write: "In the years 1701-1850, ie during the period when the Earth was in the so-called Little Ice Age in the Caribbean basin hurricanes were almost three times higher than in the second half of last century, and from 1851 to 1950 - twice as frequent. [!!!] Total number of tropical cyclones on Earth in the twentieth century, was twice smaller than in the nineteenth century [!!!]"
In periods other former cooling (8-8,3; 5,1-5,7, 4.5 ≈ 2.1, and 2-1,6 thousand years ago) has always followed a significant increase in strength of ENSO - tropical cyclones ...
In the United States during the beginning of Dalton minimum in 1780, the largest ever recorded in the so-called. "Great Hurricane" (much stronger than Hurricane Katrina) killed at least 22,000 people ...
Currently, when the estuaries are much more densely populated ...
Rising temperatures have already by 1.5 ° C will reduce the frequency of high-pressure system (anticyclones), the extension of the troposphere. Compared with the current temperatures, will reduce pressure gradient in the atmosphere, also lose their importance as barriers to the mountains.
Beautifully seen an example of the Sahara. In the summer there are only shallow low-pressure systems, but only in winter powerful, stationary anticyclones (indeed, as in Siberia).
Phenomena in the atmosphere does not occur linearly. Currently, Hadley cell expands. As a result of warming of 3-4 ° C, as always, extend, however, (on N and S) Ferrell cell. Hadley cell may even disappear - like cell zone separating the two areas of high pressure (the same way as - described above - in the summer in the Sahara).
Heat waves in the NH (2003, 2006, 2010) are associated more with violent beginnings of La Nina - cooling of the oceans, fewer algal NPP - cloudiness (CLAW hypothesis).
Global warming and United States landfalling hurricanes, Wang and Lee, 2008.:
“Warmings over the tropical oceans compete with one another, with the tropical Pacific and Indian Oceans increasing wind shear and the tropical North Atlantic decreasing wind shear. Warmings in the tropical Pacific and Indian Oceans win the competition and produce increased wind shear which reduces US landfalling hurricanes.”
The authors also say:
“This paper uses observational data to demonstrate that the attribution of the recent increase in Atlantic hurricane activity to global warming is premature and that global warming may decrease the likelihood of hurricanes making landfall in the United States.”
“The accumulated cyclone energy index, which has been used to measure tropical cyclone activity, is also observed to have a downward trend for global hurricanes over the past two decades when consistent satellite imagery has been available.”
May vary regionally (IV IPCC report and „... the North Atlantic to warm more slowly than other oceans ...” - weakening of the AMOC - cooling of the North Atlantic) and the gradient of "vertical wind shear" may rise.
However, declining globally (with warming) gradient of "vertical wind shear" decides to lower the intensity and frequency of all storms, not just the big. - Robust warming of the global upper ocean
Doug Bostrom at 13:48 PM on 8 June, 2010
PhilC, to my untrained eye Scafetta appears to be throwing things against the wall, hoping something will stick.
Previously Scafetta has said We estimate that the sun contributed as much as 45–50% of the 1900–2000 global warming, and 25–35% of the 1980–2000 global warming. These results, while confirming that anthropogenic-added climate forcing might have progressively played a dominant role in climate change during the last century, also suggest that the solar impact on climate change during the same period is significantly stronger than what some theoretical models have predicted. Problems with this assertion were discussed at Real Climate.
In another paper, Scafetta says We find good correspondence between global temperature and solar induced temperature curves during the pre-industrial period such as the cooling periods occurring during the Maunder Minimum (1645–1715) and the Dalton Minimum (1795–1825). The sun might have contributed approximately 50% of the observed global warming since 1900 This paper was also critiqued at Real Climate
At least those two papers had something in common. Now Scafetta is trying something else entirely? But what about the previous research? Is it inoperative now? Is there something new under the Sun? - Flowers blooming earlier now than any time in last 250 years
Juergen Wanninger at 21:41 PM on 5 May, 2010
Hello Argus,
thanks for your answer. However if you are looking only for short periods, the typical climate oscillations which happened always in the past independant of Co2, will show exaggerated tendences.
But if we look at longer times and only 'normal' periods (not those being famous for their extraordinairy cold climate like Maunder or Dalton) we can suddenly see, that the nature is not as much 'alarmed' like lots of people or our politicians. Each month the press shows new temperature diagrams commented with messages of 'new temperature records'. But my personal daily experience in the last 30 years does not show a 'Michael Mann' - heating. And the above diagram confirms my experience.
Obviously the short warm period between Maunder and Dalton minimum looks having been as warm as today - however there was a much smaller Co2-concentration in the atmosphere at that time.
If wee can confirm the above work by further groups and examinations, what would that mean for the theory of Co2-driven global warming? I think this will mean at least, that the predicted amount of warming due to Co2 is estimated extremely too high! Doubling should give 0.5 degrees, like Lindzen says. And there should be other things beneath Co2 driving our climate! Maybe Svensmark is on the right way? - The significance of past climate change
Marcus at 22:35 PM on 22 April, 2010
Arkadiusz, another point. The little ice age didn't occur quickly. Reconstructions show a 0.8 degree fall in temperature over a period of around 600 years-a rate of -0.013 degrees per decade! By contrast, global warming since the 1970's has been at a rate of +0.16 degrees per decade-ten times faster! Also, the LIA is directly connected to both the Maunder & Dalton minimums-coupled with some volcanic activity, wheras recent warming has no solar connection. - Senator Inhofe's attempt to distract us from the scientific realities of global warming
SLRTX at 07:05 AM on 27 February, 2010
RSVP (#5)
I read some of the paper your link points to. It's a bit long for me to read it all in one sitting.
But on the surface, I did notice several edited charts that left some details out. Some charts run from 2000 to present, I guess to hide how much warming has occurred before that time. A chart on solar irradiance is clipped off at 2000. What happened since then? It's been on a decline. I guess that bit of information was inconvenient for the document's authors.
Here's the link to the document referenced on your page 46:
http://ncwatch.typepad.com/dalton_minimum_returns/files/solar_arch_ny_mar2_08.pdf
The author, David Archibald, proposes the sun is driving our current warming trend, but then also seems to claim the recent minimum in sunspots should herald a cooling trend. Am I missing something?
He also claims that as CO2 increases in the atm, the ability to retain heat goes down. That may be true (I'll leave that to the technical types here to verify), but he seems to miss that as ANY warming occurs, we do pump more moisture in the atm. THAT enhances the warming effects of CO2.
Then he says increased CO2 is good (ah, now we see where he's going with this) for us. Plants love it, so it must be ok. And hey, CO2 levels were higher in the past, so it's just natural, right?
Problem is, the RATE of climate change is outpacing the ability for the rest of the ecosystem to keep up. This is already being observed. So, even if CO2 levels were higher in the past, the RATE of increase/decrease was much, much slower than it is now.
The rate of CO2 increase, with observable negative changes to the ecosystem, is tied to our use of fossil fuels.
Can't change the evidence, only deny or accept it. - Global warming and the El Niño Southern Oscillation
Robbo the Yobbo at 18:30 PM on 11 August, 2009
The climate shifts are from one ocean state to another over a year or three and back again over 50 years. The states amplify global warming in the warm state and mask global warming in the cool state. It is a cyclic state of sea surface temperature in the world's oceans that influences global surface temp rather than an oscillation in atmospheric temp. The states seem to be associated with changes in cloud cover.
Let's accept for the time being that Swanson and Tsonis are correct in assuming that this is 'warming interupted'- 2 or 3 decades of no warming from 1998 - rather than planetary cooling. Swanson and Tsonsis in the graph at realclimate exclude the years of climate shift (1977 and 1998) from the recent trend to get a trend due to greenhouse gases and other factors. You get the same answer if the residual trend is considered for a full cycle between 1946 and 1998 - or even a longer time frame back to 1850.
The residual trend for all other factors is 1/2 of that commonly quoted. Seen in the context of prudent foresight - the issue is merely less urgent and more amenable to technological solutions. I have no particular urge to continue the ocean and atmosphere experiment past the middle of the century at most. 100% decarbonisation by 2050 is, I feel, achievable. My 'ideological bias' is in not believing that government intervention will achieve any sigificant gains and do so at great cost in human life and to the legitimate aspirations of the world's poor. This is, I believe, a measured and reasonable bias.
Not sure what the McLean et al reference is about. Bob Carter sent me a copy of their latest paper. I have discussed the paper with John McLean by email (who has pedantically corrected my interpretation)and used their Figure 4 in an upcoming non-peer reviewed article for the dreaded Energy and Environment.
All that is being claimed is that ENSO has a huge impact on global temperature variation. Fairly obvious but nice to be able to put a number to it. They are not saying anything about a rising trend other than in comment that 'perhaps' ENSO conditons post the 1976/1977 climate shift contributed to recent warming.
I suspect you might mean Lean et al from the British Met Office? Who expect that that solar irradiance will reassert itself at the peak in the next 11 year solar cycle and record surface temps will again occur by 2014? This assumes that solar irradiance is not trending rapidly down from a thousand year high - to a Dalton or perhaps even Maunder Minimum. And I wonder what implications there are for temps later in the 11 year cycle? - Arctic sea ice melt - natural or man-made?
chris at 05:30 AM on 14 June, 2008
You didn’t answer the question, Quietman. You linked to an article by one Richard Mackey (no scientific publications whatsoever on climate/solar-related topics – has he published any science?). This is a poor and unscientific piece of work in which Mackey copies stuff out of press releases [*], makes demonstrably incorrect assertions [**], misrepresents entire scientific fields by selective citation (“cherrypicking”) [***], and pursues a false description of the mainstream scientific view of solar contributions to climate [****] (see bottom of post for examples).
Mackey cites only one relevant (to solar cycles and climate effects) scientific paper of Fairbridge (we can leave out the fine papers on sea levels, and the various book chapters that he cites). This is:
FAIRBRIDGE, R.W. and SHIRLEY, J. H., 1987. Prolonged Minima and the 179-yr cycle of the solar inertial motion. Solar Physics, 110 191-220.
I’ve read this just now. It’s a perfectly fine piece of work, and I’m surprised you feel reluctant or unable to summarize Fairbridge’s hypothesis, or to cite his relevant papers. However it highlights fundamental problems with your description of Fairbridge’s hypothesis as being “the best explanation to date for climate change”. Here’s two:
(i) Fairbridge and Shirley’s (F&S) analysis applies strictly to solar minima. In other words periods of “abnormally” low solar output, as identified by sunspot number for example. So in their Figure 5 they plot their measure of solar output as a function of time, and overlay with shading, periods of low sunspot number (these correspond to the well-known Wolf, Sporer, Dalton minima).
But that’s it. F&S’s analysis has nothing to say about periods of global warming. The sun is either in a “normal” state or it is in one of its periodic minima. Fairbridge’s hypothesis (at least as outlined in F&S) has nothing to say about the very large global warming of the last 30-odd years, let alone the dramatic attenuation of Arctic sea ice since the 1960’s.
That should be the end of the story as far as the subject of this thread is concerned. We know full well that changes in solar outputs have made little contribution to warming of the last 30-odd years, so we can leave Fairbridge’s nice work out of a discussion of causal factors relating to dramatic Arctic sea ice attenuation. However F&S make a prediction for the next minimum and it’s interesting to see how this might work out:
(ii) On their Figure 5 F&S also shade a period corresponding to a prediction (made tentatively) for the next minimum. The next period of abnormally low sunspot numbers starts near 1990 and goes to 2020 (the latest date of their analysis - although they suggest the next minimum will be more prolonged).
We can test at least the early part of this prediction since we have access to the sunspot numbers, e.g. here:
http://en.wikipedia.org/wiki/Sunspot
or:
http://www.spaceweather.com/java/archive.html (etc.)
Clearly we haven’t been in a low sunspot number phase since 1990. In fact sunspot numbers have been very high throughout cycle 22 (peaking near 1991), and high throughout cycle 23 (peaking near 2002). We don’t know what is going to happen very far into the future. However geomagnetic activity seems to be a very good predictor of subsequent sunspot cycle activity, and cycle 24 due to peak near 2013, is predicted to be a high sunspot number cycle:
http://science.nasa.gov/headlines/y2006/21dec_cycle24.htm
although others think it will be weaker:
http://www.lund.irf.se/rwc/cycle24/
Now maybe the sun will enter a period of prolonged reduced output. But so far it hasn't, and the marked recent warming was entirely independent of the analysis/hypothesis of Fairbridge anyway.
--------------------------------------------------------
some deficiencies in Mackey's eulogy of Fairbridge that you linked to in your post #15
[*] I was interested to read what Mackey had to say about sea levels, and this odd non-sciency sentence jumped off the page (see top of second column on page 961), referring to Baker’s work on sea level fluctuations):
[“ BAKER et al (2005) have been collaborating on the project for the past eight years and have published nine papers in scientific journals in relation to it.”]
That seems an odd thing to say in a scientific paper, so had a look to see whether it might be a “second hand” statement. It’s copied out of a press release. Here’s the sentence from the press release:
http://www.une.edu.au/news/archives/000327.html
[“The UNE scientists, Dr Baker, Dr Robert Haworth and Professor Peter Flood - have been collaborating on the project for the past eight years and have published nine scientific papers in international journals.”]
…and examination of the previous paragraph of Mackey’s article shows more of this low grade plagiarism that is characteristic of the lazy or poorly-informed.
[**] The following section from page 961 (bottom of left hand column). I’ll leave the reader to consider whether this has any merit:
[“As SCAFETTA and WEST (2006b) report, increased solar activity warms the oceans, increases the volume of water vapour and carbon dioxide in the atmosphere and reduces the oceans’ uptake of water vapour and carbon dioxide from the air. As a result, some of the atmospheric carbon dioxide that has been attributed to
human activity may have a solar origin. The resultant release of more water vapour and carbon dioxide into the atmosphere may have contributed to the warming that is already the direct result of increased solar output, variations in the sun’s gravitational force and interactions between the two. It is to be hoped that in its next series of publications the IPCC will quantify the proportion of greenhouse gases that have been produced by the sun in this manner.”]
[***] Cherrypicking is rampant throughout Mackey’s article:
Since I was surprised to read of Mackey’s assertions about late Holocene sea level variations:
[“…even within the past thousand years, there have
been several sudden changes in sea levels of up to two metres. The UNE team has discovered that each of these large changes took less than 40 years from beginning to end.”]
I had a read of Richard Bakers paper (very nice too), but also some of the more recent analyses of Holocene sea level changes (e.g. Lewis et al 2008). It turns out that Baker’s work is only one of many studies of late Holocene sea levels, and that in general the evidence for large variations in Holocene sea levels are not well-supported. In fact Sloss et al (2007) indicate that Baker’s very large apparent fluctuations relate to their method (parapharising) of 14C-dating marine organisms found at various heights above present mean sea level, and assuming that defines the sea level height at the time identified by the 14C date, without making corrections for possible changes in tidal ranges, wave climate and so on. Whatever the final story on this, Mackey gives an entirely false representation of the subject by focussing on one piece of work that supports his “thesis”.
S. E. Lewis et al (2008) Mid-late Holocene sea-level variability in eastern Australia; Terra Nova, Vol 20, No. 1, 74–81
C. R. Sloss et al (2007) Holocene sea-level change on the southeast coast of Australia: a review; The Holocene 17; 999-1014.
[****] This can be stated succinctly. Mackey pursues the tired fallacy of pretending that because mainstream science shows no significant role for changes in solar outputs in the very marked warming of the last 30-odd years, that mainstream science (and the IPCC!) are ignoring the sun and downplaying it’s role as an influence on the Earth’s climate. - Do cosmic rays cause clouds?
chris at 21:48 PM on 2 May, 2008
Shawnet,
I decided to have a good read of Harrison and Stephenson this morning, and have come up with as rather long post for which I apologize. I've tried to organize it coherently:
Harrison and Stephenson [Proc. Roy. Soc. A 462, 1221–1233 (2006)] is fine. However I don’t think it provides very good evidence of a CRF contribution to climate. As the authors state “Changes in DF and the frequency of overcast days represent changes in the weather and the atmospheric energy balance.”, and there are a number of considerations that need to be addressed if the effect is to be considered a “climate”-influence, rather than a “weather”-influence.
Here are some:
(i) The first relates to something that we are all aware of. There isn’t any correlation between these processes and the Earth’s temperature evolution during the period in which the CRF has been monitored in detail. After all the CRF was as high in the period 1950-55 as it is now. High CRF should correlate with high low level cloud and low temperatures. However the Earth is clearly a lot warmer now than in the early 1950’s.
Now of course, that’s an unfair comparison, since the CRF varies with the solar cycle, and so one doesn’t expect persistent warming/cooling from an oscillating forcing that has no trend. But that just re-emphasises that the there has been no significant solar contribution (CRF included) to the very marked warming of the last 30-odd years. This has been re-emphasised in two detailed analyses just published by Lockwood/Frolich (see bottom of post [***]).
(ii) Harrison and Stephenson make two points in their paper. If one looks at their Figure 2 and associated text, one sees [point ONE] a very weak correlation between the CRF and the diffuse fraction (DF) (cloudiness – presumably dominated by changes in low-level cloudiness), which [point TWO] breaks down when the CRF is higher than 3600 (x100) per hour. Above this level the DF is independent of the CRF.
Taken at face value, this seems problematic. Examination of Harrison and Stephenson’s Figure 2 indicates that most of the data in their analysis period (1968-1994) lies in this non-responsive region of the CRF/DF “correlation” where the CRF and DF are apparently completely independent (no correlation). If one examines the entire CRF record [http://ulysses.sr.unh.edu/NeutronMonitor/Misc/neutron2.html], that is reinforced. During around 90% of the entire period between the start of the CRF count (1951) to now, the CRF has been higher than 3600 (x100) per hour [if one looks at the climax CRF/sunspot number plot on the page I urled and compares this with the data in the downloadable datasets on that page one can work out that a CRF count of (3600 (x100) per hour corresponds to around the 83% level].Again one might conclude that that’s additional explanation for the complete absence of a detectable CRF (solar) contribution to the marked warming of recent decades.
(iii) This leads to an additional problem (it seems to me), which relates to ascribing CRF climate effects to earlier periods. Although we’re in a solar minimum right now with respect to the solar cycle, the sun is in a relatively “strong” state. If one examines the sunspot data going back to 1600 [e.g. here: http://en.wikipedia.org/wiki/Sunspot], this is apparent. Now if the very strong inverse relationship between CRF and sunspot number (see Climax neutron/sunspot data urled above) was maintained in those periods (no reason to think otherwise), then the CRF was likely generally stronger [greater than 3600 (x100) per hour] during periods like the Maunder and Dalton minima. However taking Harrison and Stephenson’s data at face value, the cloudiness as measured by the DF is completely independent of the CRF at values above 3600 (x100) per hour. Therefore the CRF cannot have played a significant role in the cooling during those periods.
We could deal with that problem by making some ad hoc assumptions. Perhaps the CRF became decoupled from the other solar parameters during periods with “weak” solar output. Perhaps the thresholds for a CRF-cloud correlation was higher then than it has been for the past 40 years (one might imagine that in periods where the air is rather clear of man made aerosols, the threshold for CRF effects on cloud formation become higher…and so on). But there’s no evidence for any of these ad hoc assumptions.
(iv) One may still question whether the apparent correlation between CRF and DF in the CRF range below 3600 (x100) per hour is due to the CRF and not some other solar-related parameter that cycles in step with the CRF. Harrison and Stephenson used Forbush events in an attempt to assign a causal connection. However the useable Forbush events are apparently very rare (31 days in a 50 year period with CRF count reduction greater than 5%), and so the data is not terribly strong; the Forbush events (0.2% of the record) may not be representative of the other 99.8% of the record.
(iv) We come back to the point of whether the CRF-cloud “correlations” are significant with respect to “climate” effects as opposed to “weather” effects. Sloane and Wolfendale’s analysis indicates a lack of detectable temperature effects from the Forbush events. We’ve already seen [see point (i)] that there’s no correlation between the CRF and the Earth’s temperature response since the start of the count, although we recognise that the CRF has been trendless, and so will only be represented in the solar cycle which is difficult to “pick out” in the record since it is smoothed by the inertia in the climate system, and is apparently small with respect to other stochastic variations (El Nino’s, volcanos, La Nina’s), and especially with respect to the strong and persistent trend arising from the enhanced greenhouse effect.
(vi) A couple of other points need to be established if the CRF-cloud correlations have potential “cloud” implications rather than “weather” implications:
(a) Does CRF-mediated cloud formation result in a nett change in the cloudiness over that resulting from other cloud-forming process (currents that mix warm damp air with cold air; all the other atmospheric aerosols; mountains and land masses). I don't think that's been established 'though Harrison and Stephenson's data might support that conclusion?
(b) What about the day/night relationships? According to the CRF-cloud theory, cloud effects act during the day. CRF-mediated cloud formation blocks solar irradiance at the surface cooling the Earth. Notice that the greenhouse-mediated warming acts during both day and night, since the effect results from atmospheric “trapping” of IR radiation emitted from the Earth’s surface that occurs during the day and night. This is consistent with the fact that the warming of recent decades is as large or larger for night-time than day-time periods, and is another inconsistency with any potential CRF contribution to recent warming. One possibility is that any CRF-mediated cloud effects roughly cancel between day and night. For cloud effects to act on climate (Earth’s surface temperature), one expects that they need to be persistent at least for some hours. However enhanced cloud formation during the day (cooling effect) that persist into the night will result in a night time warming effect (decreased radiation of surface warmth) and vice versa.
Overall Harrison and Stephenson is an interesting paper with what looks like fine data. However it doesn’t negate the very strong evidence for a lack of CRF effect on the very marked warming of recent decades, and if we’re concerned about that, we should focus to rather more well-supported causal factors. Secondly, it doesn’t constitute a very significant case for a CRF-climate link, and in fact tends to dis-favour such a link, at least over time periods in the relatively recent past (since 1600) when there is a reasonably good record of solar outputs (as monitored by sunspot numbers).
[***]M. Lockwood & C. Fröhlich (June 2008) Recent oppositely directed trends in solar climate forcings and the global mean surface air temperature. II. Different reconstructions of the total solar irradiance variation and dependence on response time scale Proc. Roy. Soc. 464, 1367-1385.
M. Lockwood (June 2008) “Recent changes in solar outputs and the global mean surface temperature. III. Analysis of contributions to global mean air surface temperature rise” Proc. Roy. Soc. 464, 1387–1404. - Are we heading into a new Little Ice Age?
DWK at 08:50 AM on 1 March, 2008
This is too interesting as we head into March and still virtually no sunspot activity.
This is a certainty, at some time in the relatively near future, assuming the planet is here, there will be a Maunder Minimum a Dalton Minimum a Sporer Minimum and even a Wolf Minimum of sunspot activity. With each of these there was a corresponding drop in temperatures here on our planet. The sun produces virtually all of the energy on this planet, it is the overriding affector of our climate, nomatter what Al Gore and his increasingly wealthy, non-green living cronies say.
When a new minimum occurs and it will occur, this planet will cool. CO2 aside.
And there are superior climatologist who predict just the same, their voice being squashed by the Religious green movement, and yes the green movement is a Religion.
But the creation can take care of itself, and everything under the sun is not new, we will revist a "little ice age" again one day, hopefully knocking down the arrogance of man a notch.
Let me add this is a wonderful site for the science geek.


THE ESCALATOR

(free to republish)