


 Arguments


Trump and the GOP may be trying to kneecap climate research
Posted on 30 November 2016 by dana1981
Last week, Donald Trump’s space policy advisor Bob Walker made headlines by suggesting that the incoming administration might slash Nasa’s climate and earth science research to focus the agency on deep space exploration. This caused great concern in the scientific community, because Nasa does some of the best climate research in the world, and its Earth science program does much more. Walker suggested the earth science research could be shifted to other agencies, but climate scientist Michael Mann explained what would result:
It’s difficult enough for us to build and maintain the platforms that are necessary for measuring how the oceans are changing, how the atmosphere is changing, with the infrastructure that we have when we total up the contributions from all of the agencies ... we [could] lose forever the possibility of the continuous records that we need so that we can monitor this planet.
Walker’s comments set off alarm bells for another reason. Were it simply a matter of transferring Nasa’s climate and earth science programs to other agencies, what would be the point? Such a transfer would be logistically difficult, and if the research funding weren’t cut, it wouldn’t save any taxpayer money. And it’s not as though the branches doing Nasa’s climate research are distracting other branches of the agency from conducting deep space exploration.
The suggestion does however look a lot like a Trojan horse whose true purpose is to cut government-funded climate research, perhaps transferring some of Nasa’s programs and budget to other agencies and simply scrapping the rest.
Bob Walker’s politicized science
In an interview with The Guardian, Walker accused Nasa of “politically correct environmental monitoring” and “politicized science.” Carol Off from CBC’s program As It Happens conducted a follow-up interview with Walker and asked for examples to support his accusations. Walker cited the example of Nasa’s announcement that 2014 was the hottest year on record, claiming:
The fact that they have reported temperature that they said was the highest temperatures...in history...it turned out that they were only 39% sure of that figure. Well that’s a press release, not a scientific kind of statement. I’m interested in scientific integrity. I’m interested not in scientific analysis that goes to a politically correct outcome.
The reason Walker knew that Nasa estimates gave 2014 a 38% (not 39%) chance of being the hottest year on record (Noaa put its odds at 48%) is that Nasa and Noaa included this information in their announcement. There is uncertainty in every scientific measurement. That’s why scientific theories and conclusions aren’t proven; they’re only supported or disproved by the available evidence.
Nasa and Noaa concluded that 2014 was about twice as likely to be the hottest year on record than the second-most likely year (2010). Thus they decided that they could announce that 2014 was likely the hottest year on record, but they also included the uncertainty in that conclusion, as good scientists do. For that, Walker wrongly accused them of “politicizing science.” Coincidentally, 2015 broke the 2014 record, and 2016 is about to shatter the record for hottest year once again.
Bob Walker’s characteristics of climate denial
In the CBC interview, Walker also claimed: “the models that the scientists have used on global warming have been extremely flawed.” In reality, as documented in my book, climate models have been incredibly accurate at predicting global warming. But Walker’s most glaring red flags were raised when he was asked about the 97% expert consensus on human-caused global warming, to which he replied:
I don’t think it’s the vast majority of climatologists who believe that [global warming is happening and man-made] ... among climatologists there is still a debate about the causes of the global warming. And so I think that debate is healthy, and I am entirely concerned about the fact that some of the climatologists that do not buy into the orthodoxy are being prevented from even having their works published.
Walker followed up to the interview with three sources he claimed supported his rejection of the 97% expert climate consensus. In this answer, Walker checked off three of the five characteristics of science denial.
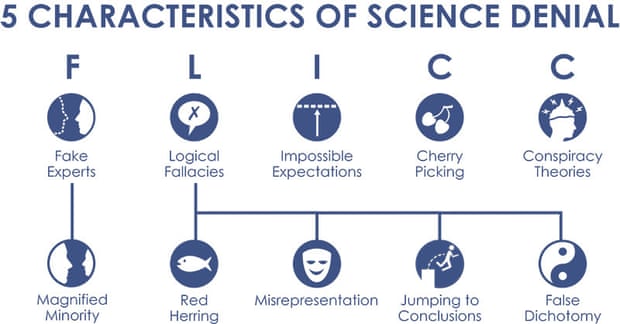
First, he engaged in conspiratorial thinking by accusing the climate science community of blocking contrarian research. In reality, the 3% of climate scientists who dispute the expert consensus on human-caused global warming are able to publish their work in scientific journals. It’s just that the contrarian research tends to be flawed and falls apart under scientific scrutiny, so it doesn’t get much attention outside of certain biased media outlets.
Second, in denying the 97% expert consensus, Walker instead appealed to fake experts. He cited three sources to dispute the consensus, one of which was the National Association of Scholars; but digging deeper, the source was actually a 2011 interview the association did with Fred Singer. Singer is a tobacco and fossil fuel industry-funded scientist, who claimed in the interview:
the number of skeptical qualified scientists has been growing steadily; I would guess it is about 40% now.
In short, one of the sources Walker cited to dispute the 97% expert consensus on human-caused global warming is the unsubstantiated guess of a fossil fuel-funded fake expert. Walker also referenced the Open Source Systems, Science, and Solutions Foundation (OSS), which says:
97% of working climate scientists say the temperature is rising, and human activity is a significant contributing factor.
On the same page OSS does mention that 31,000 scientists signed the Oregon Petition disputing the consensus, but only to debunk this particular myth. Strike two for Walker.
His third source was “The Center for Climate Research,” which most likely refers to a paper published by David Legates, who used to head the University of Delaware’s so-named center. While Legates’ paper was published in a scientific journal, it badly misrepresented the expert consensus on climate change by focusing on the papers that didn’t explicitly quantify how much global warming humans are responsible for. By that logic, there’s no expert consensus on evolution, or the Earth not being flat, or on any scientific question, because in every scientific field most papers don’t focus on answering the most basic, settled questions.
Trump is getting bad advice
The problem is that Walker is getting his climate information from inaccurate, biased sources, and he’s an advisor to the president-elect. It’s possible that the incoming administration won’t follow his dangerous, biased advice. The issue will predominantly be in the hands of Congress in any case, but Republicans in Congress have been trying to slash Nasa’s earth science budget for years. Now they have an ally in the White House.
Additionally, Trump has surrounded himself with advisors and cabinet members who likely don’t view climate research favorably.


Perhaps Bob Walker doesn't realise NASA is involved in not just space research and climate change, but all sorts of remote sensing of earths systems. The things all just sit comfortably and work efficiently together.
Please don't try to fix what isn't broken Mr Walker. The history of humanity is littered with mistakes like that.
If you calculalte the theoretical scientific magnitude of carbon dioxide's effect on the earth's average annual global air temperature and divide this number into the lower troposphere temperature increase for the last 4.75 years the ratio is 35 to 1. If you can't do the calculations yourself I will provide them eventually. In addition you should inform you readers what the first footnote for policy makers says from the IPCC TAR Climate Change 2001: The Scientific Basis. These two facts alone discredit the whole CAGW fraud scheme. If you don't have a 34 to 1 feedback to carbon dioxide forcing explanation what really caused this temperature increase? In addition, since 1979 carbon dioxide never decreased, what explains all of the decreases in the earth's air temperature? This is why the IPCC scientists insisted on the disclaimer that human activity caused climate change and redefined climate change to include natural variability.
[PS] Accusation of fraud and sloganneering. You must substantiate claims. If you want to show science wrong, you first quote the actual claim with source (because you are simply promoting a straw man at the moment), then you provide data/publications to support your alterrnative view. Note in particular: climate is defined as 30 year average since long before IPCC because of large internal variability. No climate scientist from FAR onward has ever claimed that temperatures would keep rising year after year. Even a cursory reading of report would explain why. Leave the rhetoric at the door.
Please note that posting comments here at SkS is a privilege, not a right. This privilege can be rescinded if the posting individual treats adherence to the Comments Policy as optional, rather than the mandatory condition of participating in this online forum.
Please take the time to review the policy and ensure future comments are in full compliance with it. Thanks for your understanding and compliance in this matter.
People need to know who this Bob Walker is. It took a little digging, but it turns out he's the same former Republican Congressman Robert Walker who was closely aligned with Newt Gingrich during his time in Congress. He served on the House Science committee and in a recent opinion article described NASA climate science as “politically correct environmental monitoring."
source: LINK
[RH] Shortened link.
john warner@2 said: "If you don't have a 34 to 1 feedback to carbon dioxide forcing explanation what really caused this temperature increase [in the last 4.75 years]?" I think the switch from a La Nina dominated period to a massive El Nino can explain that. Nobody would use a 4.75 year period for a climate study, 1) too short to study Earth warming. The ocean alone delays sensible warming about 10-20 years, and 2) 4.75 years sounds suspiciously cherry-picked for a time interval.
John Warner @2 you claim your calculations discredit everything the IPCC claims then say you will provide the calculations"eventually". You appear to have let it slip that you havent actually done any calculations. Such is the obviously ridiculous component of your statements, I wonder if your post is satire/ sarcasm?
I'm also not aware of any temperatures decreasing since 1979. All data sets show an increase although some show a slightly slower rate since 1998. However this year is almost over and its clear it will set a huge temperature record.
data.giss.nasa.gov/gistemp/graphs/
Climate deniers may be beyond convincing, but all the more reason to make sure we are consistent in our units (Gt of what? Carbon, CO2, or CO2 equivalents? Total energy accumulation in the earth system, or average air temperature, etc.). And lately all that talk of the North Pole being "hot".
Ubrew12 @ 4, nigelj @ 5, jdeutsch @ 6 thank you for the replies. Enthymeme is an argument where one of the premises is not stated. This is a debating trick to influence the audience. The audience has to supply the missing incorrect premise to get to the speakers false conclusion. This is emotionally gratifying to the audience because this reinforces their belief that they are functioning at the same high intellectual level as some publicly recognized authority. Now the audience has a stake in the lie because their own self esteem is involved. No conscientious CAGW critic disputes that the earth’s air temperature is rising during the last 4.75 years and is at near record high levels. But the incorrect unspoken premise is that science has proven man-made carbon dioxide is the cause. If you have statistically significant evidence for a rigorous scientific explanation that man-made carbon dioxide concentration has had a substantial effect on the earth’s average annual global air temperature show it to me now. If you can’t, I have posted a tutorial at my website. (snip) moraleconomist.wordpress.com/ I can use this argument to systematically expose the lies that the global warming advocates have used to deceive an unwary public. Frank Knight said the only truth he is interested in is what reasonable men can agree upon after a free discussion. If the moderator allows me to paste the tutorial into a comment I will be more than happy to do so.
[PS] More sloganeering gone. "CAGW" is pure rhetoric with no reasonable definition. Tried reading the IPCC WG1? Use the "argument" button to find what you think is your strongest argument and comment on the thread. Offtopic gets deleted. The science position is that long term trend is mostly due to CO2, short term variations (sub decadal) are due to natural variability. If you dont agree that is the scientific consensus then show science report that say otherwise. No more strawmen.
The comments policy on site is designed to allow reasonable discussion of science without political sloganeering or rhetoric. If you are not prepared to abide this comments policy, then this is not the site for you. Read it and abide by it, or go elsewhere. It is not open for discussion.
[RH] Snipped URL. We're not your advertising firm, bubba.
"Knight said the only truth he is interested in is what reasonable men can agree upon after a free discussion." If you are claiming a significant 'climate' conclusion from the last 4.75 years, you're not in the category of 'reasonable men'. 'Free' does not mean 'free' to dispense with fundamental definitions of the phenomena you are discussing. I'm not 'free' to fly off a cliff because I think gravity is a hoax; although I will admit after a 'free discussion' I might convince several 'reasonable men' to join me, by convincing them we'd arrived at 'the truth'.
The scientific explanation of carbon dioxide radiative forcing is easy to understand. With the analytic application of this understanding I can prove that the exaggerated claims of the global warming advocates fail the scrutiny of reason by the weight of their own silliness. The best way to access the IP addresses I am providing is to copy the address and paste it into the Browser IP address row and press enter. Then print the document for future reference. (snip) To return to the Moraleconomist Web Blog click x on the file folder you are viewing.
This is the IP address for the concentration of carbon dioxide in the atmosphere. [mod. - This is not an IP, it's a url.]
ftp://aftp.cmdl.noaa.gov/products/trends/co2/co2_annmean_mlo.txt
In 1979 NASA began using satellites to measure the earth’s average annual global air temperature. [mod. - Not exactly...] For the purpose of evaluating the validity of the global warming hypothesis [mod. - Needs a citation.] I prefer to use this period of the earth's air temperature record. The growth rate of carbon dioxide from 1979 to 2015 is 1.7892ppm per year. [mod. - Needs citation.]
This is the IP address [mod. - URL] for the Intergovernmental Panel on Climate Change, Third Assessment Report, Climate Change 2001: The Scientific Basis, Table of Contents.
http://www.grida.no/publications/other/ipcc_tar/?src=/climate/ipcc_tar/wg1/
Click on chapter 6 and scroll down to table 6.2. From the first equation C/Co, Co is 400.83 in 2015. Extrapolating the current growth rate [mod. - You can't do a straight linear projection.] to 2115 yields C equal to 579.75, (400.83+178.92= 579.75). (579.75/400.83=1.4463738) The natural log of this growth rate is 0.3690595. Multiplying the natural log times 5.35 yields 1.97wpsm. This is the most likely scientific prediction for a 100 year increase in carbon dioxide radiative forcing [mod. - No it's not. Pleaser refer to the Representative Concentration Pathways data for accurate figures.]. Before you thoughtlessly dismiss this go back to the TAR and go to table 6.1 and notice that between 1750 and 1998, 248 years, radiative forcing by carbon dioxide only increased 1.46wpsm. You can verify this with a scientific calculator by calculating the ratio of 365/278, taking the natural log and multiplying by 5.35. You can also calculate the 265 year increase in carbon dioxide radiative forcing, 1.96wpsm, by evaluating the ratio 400.83/278.
This is the IP address [mod. - URL] for NASA’s 2010 Earth Energy Budget based on the 10 year Climate and Earth Radiation System experiment.
http://science-edu.larc.nasa.gov/energy_budget/pdf/Energy_Budget_Litho_10year.pdf
The first thing to note is that there is no greenhouse gas radiative forcing quantity [mod. - Yes there is. Right there on the first page of your URL link.]. It is 17.9wpsm. This is a 33.4wpsm decrease from NASA’s 1998 Solar Energy Budget estimate of 51.3wpam. [mod. - citation needed.] The water vapor component was reduced 75%. [mod. - citation needed.] The well mixed greenhouse gases component was reduced 25%.[mod. - citation needed.] Therefore the most likely prediction is reduced to 1.48wpsm.
Notice also that the surface air temperature radiates 358.2wpsm. Google the Free Stefan-Boltzmann Law Calculator. Enter 1 for e and A. Enter 358.2 for P and x for T. Click calculate. T equals 281.93 degrees Kelvin. Adding 1.48wpsm to 358.2wpsm equals 359.68wpsm. Now enter 359.68 for P and x for T. T equals 282.22 degrees Kelvin. The difference, (282.22-281.93=0.29), is 0.29 degrees Kelvin per century. That is also 0.0029 degrees Kelvin per year.
This is the IP address [mod. - URL.] for Dr. Roy Spencer's Web Site. Click on Latest Global Temp. Anomalies.
http://www.drroyspencer.com/
This is the gold standard of temperature records [mod. - No, it's not.] for analytically evaluating the validity of the global warming hypothesis [mod. - Go chat with Roy, he'll tell you that you're wrong in your hypothesis here]. Notice the range of variability of the monthly data, 1.35 degrees Kelvin. Even more important for our purpose notice the 13 month running average temperature. Between July 2011 and April 2016 [mod. - why 13 months and not 12?.] this temperature went up 0.5 degrees Kelvin. Multiplying 4.75 years times 0.0029 degrees Kelvin per year yields 0.014 degrees Kelvin. The temperature went up 35 times more than the 4.75 years of carbon dioxide growth can explain [mod. - No one claims that CO2 and temperature are expected to operate in lockstep.]. Also notice every time the temperature goes down none of that variations is explained by carbon dioxide because [mod. - because, because, because....] annual average levels of carbon dioxide never go down [mod. - Technically wrong, but again, no one expects that CO2 and temperature will operate in lockstep.]. To credit carbon dioxide with average annual global air temperature changes is silly on its face compared to the other natural forces controlling earth’s air temperature. [mod. - Please quantify these other radiative forcings in relation to GHG forcing.]
From the IPCC Third Assessment Report [mod. - URL.] on Climate Change 2001 1st footnote from page 5 Summary for Policy Makers 1...
http://www.grida.no/publications/other/ipcc_tar/?src=/climate/ipcc_tar/wg1/fnspm.htm#1
"Climate change in IPCC usage refers to any change in climate over time, whether due to natural variability or as a result of human activity. This usage differs from that in the Framework Convention on Climate Change, where climate change refers to a change of climate that is attributed directly or indirectly to human activity that alters the composition of the global atmosphere and that is in addition to natural climate variability observed over comparable time periods.
The TAR could not prove that human activity [mod. - "proof" is a mathematical term and can't be applied to theories] caused global warming and they could not use the more ambiguous phrase, “climate change,” because of the definition adopted by the Framework Convention in 1992 [mod. - You've profoundly misinterpreted the passage you pasted above.]. In order to be semantically correct they had to redefine their definition of “climate change” to include naturally caused variability. Since the IPCC, the world’s leading scientific global warming authority[mod. - Weird claim.], secretly [mod. - Please read the terms of commenting on SkS again.] changed the definition in 2001 the global warming advocates believe they are not lying when they use, “climate change,” to refer to naturally caused climate change but the general public hears the lie that the changes are being caused by human activity. [mod. - Statements like these generally get commenters banned at SkS. You're on thin ice.]
The IP address [mod. - URL.] for the earth’s annual absolute temperature cycle [mod. - Really?.] is:
https://ghrc.nsstc.nasa.gov/amsutemps/amsutemps.pl
Scroll down until you see the colored years. Select near surface temperatures channel 4, degrees Kelvin, and year 2006. Notice that for January the temperature is 258 degrees Kelvin and for July the temperature is 261 degrees Kelvin. When the earth is closest to the sun the earth air is 3 degrees Kelvin colder.
The IP address [mod. - URL.] for Earth Orbit — Wikipedia is:
http://en.wikipedia.org/wiki/Earth%27s_orbit
Notice in the second paragraph under the heading Events in orbit the following sentence. “The changing Earth-Sun distance results in an increase of about 6.9% (footnote 8) in total solar energy reaching the Earth at perihelion relative to aphelion.” Next scroll down to the table labeled Orbital Characteristics. The earth’s aphelion is 94.51 million miles from the sun and the perihelion is 91.40 million miles from the sun. The ratio is 1.034. Because of the inverse square rule the solar radiation power per area at the perihelion is 1.069 times higher than at the aphelion. 1.034 squared equals 1.069. (0.069*340.4wpsm=23.5wpsm) The difference in solar radiative forcing between July and January is +23.5wpsm and the earth’s air is 3 degrees Kelvin colder.
The earth’s air mitigates a 23.5 watts per square meter annual solar radiative forcing cycle [mod. - citation needed.] but according to the global warming advocates theory, it can’t mitigate a 1.48 watts per square meter [mod. - citation needed.] increase in radiative forcing from a 100 year increase in carbon dioxide [mod. - citation needed.]. On January, fifth, the solar radiation on the earth is 353.75 watts per square meter. On July, fifth, the solar radiation is 330.25wpsm. When the sun’s radiation power per area is 23.5wpsm greater the earth’s air temperature is 3 degrees Kelvin colder. The global warming activists don’t care enough about science to realize that there are very powerful natural physical mechanisms that mitigate earth’s air temperature during its elliptical path around the sun [mod. - called the greenhouse effect.]. The annual increase in radiative forcing due to carbon dioxide growth is 1,588 times smaller [mod. - citation needed.] than the amplitude of the annual solar radiation power cycle, (23.5/0.0148=1,588) [mod. - citation needed.] Yet the global warming theory public policy advocates do not feel the necessity to explain why these same powerful natural physical mechanisms can’t also mitigate such a small determinant of the earth’s air temperature. These physical forces of nature are called: cloud albedo, radiating to space as a function of air temperature raised to the fourth power, reduction in conduction as the temperature difference between earth’s surface and surface air gets smaller and ocean sequestration of heat.
Another global warming lie we can expose here is that their public policy advocates say it takes 40 to 100 years for the earth’s air temperature to adjust to a change in radiative forcing due to carbon dioxide growth. But how long does it take to adjust to daily changes in solar radiative forcing. Notice that from NASA.s annual temperature cycle graph that as the earth begins to move away from the sun on January, Fifth, the earth’s air temperature begins to increase within two weeks. This means the earth’s air temperature regulating mechanisms are already increasing radiative forcing faster than the sun's radiative forcing is decreasing.
This is an invitation to a, Frank Knight type, free discussion of reasonable men to discover whatever truth emerges that we can agree upon.
[mod. - (sigh).]
[RH] Skating verrry close to the edge of spam. Again, we're not here so you can advertise your climate denial blog. If we have to hit the spam button it will delete all your past and future posts. IF you are interested in a rational science based conversation on this issue you're going to have to (a) settle down, and (b) stick to the supportable science, and (c) don't spam this site ever again.
john warner@9 said: "Between July 2011 and April 2016... temperature went up 0.5 degrees" That 0.5 C increase is also indicated by the five surface temperature surveys graphed here: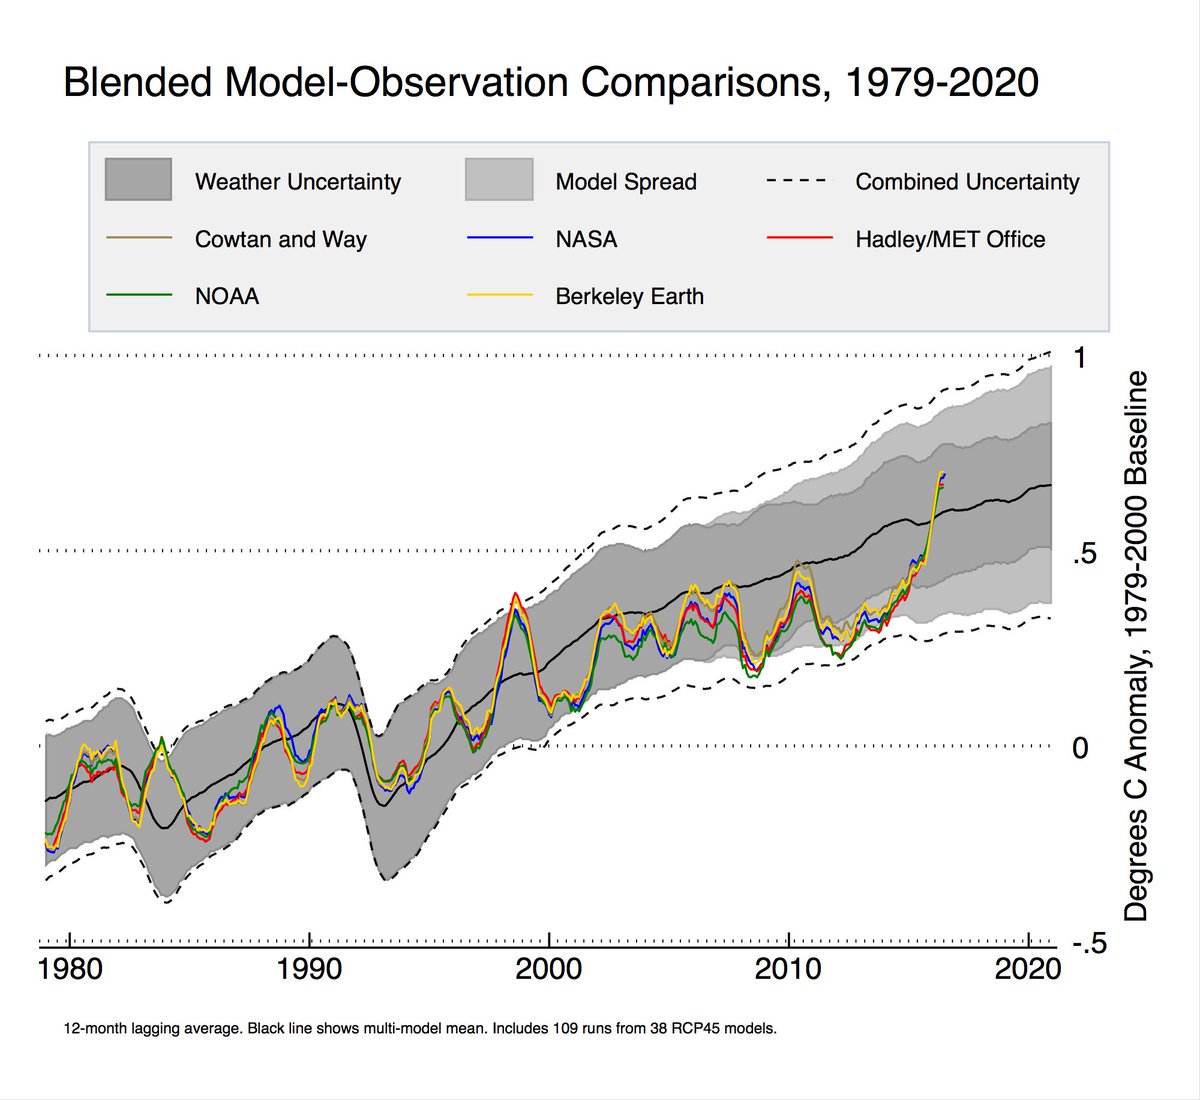
Also shown is the surface temperature from 1979 and the IPCC model predictions as well. The predictions do not match the record for the last 4.75 years, mostly because that's a ridiculously small interval of time upon which to make a climate comparison. But, more fundamentally, its because they can't. They are only models, approximations of nature, not the reality itself. This means we can't expect the models to 'beat' nature. Instead, their task is to beat you, and by 'you' I'm including the wealthiest economic sector in human history, entirely capable of producing its own climate models. But, more personally, you seem to have a well-thought-out analytical structure of how nature works to determine Earth's surface temperature, so why not extend that structure over a longer time period than the trivially inconsequential 4.75 years you've chosen? Work your math to include everything from 1979, and then see if it beats the standard models of climate science. Failing that, just pointing out that the standard models don't match the reality is moot. Those models aren't constructed to beat reality. They are constructed to beat you.
free discussion of reasonable men to discover whatever truth emerges that we can agree upon.
I suggest that a free discussion of reasonable men to discover the truth starts with a presumption that the reasonable men have some respect for each other. Starting with accusations that the other reasonable men are lying will not lead to a free and reasonable discussion.
"This is an invitation to a, Frank Knight type, free discussion of reasonable men to discover whatever truth emerges that we can agree upon."
Reasonable but unqualified men will be of little use. You would need a discussion of reasonable and qualified climate scientists, but haven't we done that already? At least five studies show a consensus that humans are altering the climate.
I also agree with the point that 4 years is too short to determine whats happening with the climate. As Ubrew says la nina and el nino can cause small sudden temperature changes independent of underlying longer term changes. It was a longer term change from the 1970s that got climate scientists seriously concerned that a new factor in the climate had emerged.
I also dont see how John Warner concludes that because solar changes cause a fairly immediate climate response (which is intuitively obvious) that C02 would act at the same rate. An increasing greenhouse effect is like putting on a jumper, you heat up slowly if you can excuse the rough analogy. In fact it has a lot do do with how the ocean responds.
John knows more science than the average person perhaps, but there is an old saying in computing that is relevant called "gigo".
Ubrew 12 @ 10 Thank you for your response to my comment at 2 which I admit was incomplete.To be ontopic I was responding to the dana 1981 post we were commenting under. In paragraph 8 she [mod. - he] injected that 2014,2015, and 2016 were record breaking temperature years in an attempt to expose Bob Walker as a global warming denier. I was only pointing out that it was natural and not man-made forces that were the scienfific explanation for the 4.75 year increase. I did not have the time to document how I calculated the theoretical scientific effect that increases in carbon dioxide has on the air temperature, (0.0029oK)/yr. I presented the documentation in comment 9 the next day. (4.75yr)*(0.0029oK)/yr = (0.013775oK) (0.05oK/0.013775oK) = (36.3) I subtracted 1 for carbon dioxide and left 35 for nature.
The IPCC had a problem with publishing the TAR Climate Change 2001: The Scientific Basis. The Framework Convention in 1992 defined climate change to include only changes as a result of human activity. [mod. - The roles and purposes of the IPCC and the UNFCCC are different. They're respective definitions have no relevance.] I cited footnote 1 to see if Skeptical Science would verify my explanation of what it meant. The, "This is why" beginning to my statement refers to the discrepency in the magnitudes of the man-made and natural causes that I illlustrating in comment 2.. "This is why the IPCC scientists insisted on this disclaimer that human activity caused climate change and redefined climate change to include natural variability." [mod. - Again, wrong. And note that this is a very serious accusation that we do not take lightly here at SkS.] The moderator did not bother to read footnote 1, crossed out my statememt and gave me a Warning. Then she accused me of fraud and sloganneering. Then a mini-lecture that to prove science wrong I had to cite and quote dana 1981's Post. [moderation complaint snipped.] [...] [Accusations of dishonesty snipped]I wasn't trying to prove science was wrong. I was trying to show that dana 1981 was dishonestly disinforming Skeptical Science viewers that 3 consequtive years of record temperatures was scientific proof that human activity was the cause of climate change.. Then a note that you can't make claims of climate change under IPCC rules before you have the average temperature for a period of 30 years. Which reinforces the point I was trying to make. She [mod. - he] concludes with, that no climate scientist after FAR ever claimed temperatures would keep rising year after year. [mod. - No climate scientists has ever claimed that temperature would be warmer year after year] That is the acceptance that natural forces cause the air temperature to change and that the IPCC had to change the definition of climate change. [mod. - Nope. You're naively trying to attribute internal variation with attribution.] Your graph is a good example of how quickly simple facts reveal the defenders of the indefencible.
john warner @ 7 does not make any sense because the moderator deleted the top half. [mod. - For clear stated reasons.] Enthymeme is a debating trick to get a misinformed person to supply a false first premise for an argument to get him to draw the wrong conclusion. I was commenting on dana 1981's post but the moderator said, offtopic gets deleted. [moderation complaint snipped] I self idenitfied as a, "CAGW critic" and said that unlike other deniers I believe the air temperature is increasing. The whole sentence gets deleted because she did not like acronym CAGW. [mod. - False. That's not what was stated to you.] The last part of my deleted statement was. "...the incorrect unspoken premise is that science has proved man-made carbon dioxide is the cause." Now 7 makes sense. Essentially, I said if you have the proof show it to me now. Nobody at Skeptical Science has put up the proof yet. You can read the rest of the comment. The moderator snips the url address, says were not your advertising firm and calls me bubba. [moderation complaint snipped] My son set up Moraleconomist's in 2011. Nobody ever visited the site. No comments. No recommends. I deleted 5 brief posts and published the list of sources on November 28, 2016 for my argument on Skeptical Science. I did not know that I was allowed to submit it as a comment. Apparently my assumption was not too far off. See last Moderator Response. But I did submit my list as comment 9. Further more the moderator agrees with me that sub decadal (2014-2016) is not long enough period to prove climate change. Then she [mod. - he] says [moderation complaint snipped] as an acceptable comment, I can't formulate my own argument or the already discredited denier skeptical science reports (strawmen), but only global warming consensus science reports as evidence against the global warming concensus science. Talk about defining the bounds of an argument to get the conclusion you are assuming.
I am going to open a new comment to respond to the moderator at 9. I only chose 4.7 years to be on topic for dana 1981's Post. My real intent for the scientific reasoning power contained in 9 is to debunk the claim that real science has been used to prove that man-made carbon dioxide causes the earth's air temperature to increase. The Moderator's comments alone provide more than enough instances to inject real science to debunk the anthropogenic global warming theory. I am a teacher, agreeing with is not enough. You have to know why you are agreeing with me. Even before I make the argument, Ubrew12 already sees enough scientific fire power sitting on the battle field to win and he is scolding me for not using it wisely. Ubrew already knows why he agrees with me and if I make a mistake he wiil be the first to point it out.
[moderation complaints snipped]
[RH] You're going to have to try a little harder to focus on specific points on specific science and leave out all the rambling rhetoric. If you can manage that I think you'll find SkS to be a good place to have a substantive discussion.
[PS] You also cannot have a reasonable discussion about truth when you constantly misrepresent what the science actually says and make unsubstatiated accusations about people involved. Read the science at source not some misrepresentation constructed by some denier source. Quote the original sources, provide links to your data and above all take the time to understand what the science says instead of what you would imagine it does. You have yet to provide any evidence that any climate scientist ever asserted that that temperature would rise year on year. To me, this implies that you have never bothered to investigate a modern (post 1970) understanding of climate preferring an imaginary construct that you can disagree with instead.
john warner@13,
Please note that dana1981 is a man. Everyone on this site knows Dana because of his invaluable contributions as science communicator and scientist with growing resume of peer reviewed publications.
If you don't know Dana yet, you can easily get to know him by looking here or his numerous photos. And please avoid the pitfalls of English language & never again refer to him as "she".
john warner @various:
Using the Law Dome combined CO2 data plus the BEST Land Ocean Temperature Index over the period of their overlap (1850-2013), we find a correlation between CO2 forcing (calculated as 5.35 x ln(CO2current/CO2initial)) of 0.900, an R-squared of 0.811, with a linear regression of 0.58 +/- 0.044 C/(W/m^2). This is the scatter plot of the data:
You may object that because of the infilled values in the Law Dome data set, that artificially inflates the correlation. Using just the raw Law Dome data (with no Cape Grim), however, we achieve a correlation of 0.711, and R-squared of 0.505, and a regression of 0.59 +/- 0.164 C/(W/m^2). Using forcings calculated from the Mauna Loa montly values from March 1958 to July 2016, the correlation is 0.854, the R-squared is 0.729, and the linear regression is 0.62 +/- 0.28 C/(W/m^2).
In short, it is a robust feature of the data that the temperature response to CO2 forcing is approximately 0.6 C/(W/m^2). That translates to a Transient Climate Response of approximately 2.2 C per doubling of CO2.
As the Earth's energy imbalance is currently, approximately 0.7 W/m^2. That means we would currently expect a further increase of Global Mean Surface Temperature of up to 0.4 C based on CO2 emissions to date. Taking the Law Dome data, the increase of 1.7 W/m^2 has left 0.7 W/m^2 that has yet to contribute to the Earth's warming, resulting in a temperature increase of 0.87 C to be explained by the remaining 1 W/m^2. That yields a back of the envelope estimate of the Equilibrium Climate Sensitivity of 0.87 C/(W/m^2) or 3.2 C per doubling of CO2 based on CO2 and temperature data alone.
Against this robust evidence, you can only provide evidence from a truncated data set, with no estimates of the uncertainties, and employing an absurd estimate of future increase in CO2 forcing with Business As Usual which assumes a linear rate of increase from non-linear data.
John warner @13, you give the impression you have misunderstood the importance of climate being assessed over a 30 year period.
You have implied that a 30 year period means that [any] climate change can therefore only be assessed retrospectively 3.33 times per century - and that this somehow "reinforces the point" you were trying to make. (Your point, whatever it was, has become lost in a jungle of words and semantic confusions. Best if you concisely restate the point you wish to make!)
In practice, John warner, it is perfectly acceptable to assess climate changes over rolling 30 year periods (i.e. overlapping periods), if you wish to do so. Which may (or may not?) castrate your unexplained point.
Tom Curtis @ 15 I am working on a response. Here are two things to consider in the mean time. Adding ocean and land absorption of heat diminishes the role of carbon dioxide when your consider air, land and oceah heat versus only air heat. You logically increase the role of natural heating forces. Second, if you misspecify the cause effect relationship between Temperature and CO2 growth you get inexpected public policy implications. As you can see I have already done the calculations and the y axis intercept is crucial for interpreting the results.
Since you did not cite the sources I have to gather my own facts. Paste the IP address for NASA’s 2010 Earth Energy Budget into IP address for your Browser. Paste the IP address for the complete satellite temperature record from 1979 to 2016. Scroll down to the bottom of the page. Under Global and in the Trend row notice 0.12. This is the temperature trend. 0.12 degrees Kelvin per decade This is also 0.012 degrees Kelvin per year. Just a bonus note before we proceed. Multiply 0.012 times 37 years. This informs us that conditional mean temperature around which the earth’s average annual global air temperature varies has increased 0.444 degrees Kelvin between 1979 and 2016. My argument is that the earth’s air temperature is increasing but carbon dioxide in the air is not the cause.
You said the increase in the earth’s air temperature is only 1% of the global temperature effect. 0.012 degrees per year is the only defensible metric of the increase in the earth’s air temperature. Dividing 0.012oK/yr by 0.01 yields 1.2oK/yr. Your statement translated into reality is that for a representative one square meter of air at the elevation of one kilometer the average annual global air temperature increases 0.012oK/yr. The air equivalent increase in kinetic energy in the ocean is 1.128oK/yr. And I assume the other 5% is land, 0.06oK/yr. The earth’s surface air radiates at 358.2 watts per square meter. Google the Stefan-Boltzmann Law calculator and enter 1.0 for A and e. How much does the rate of energy absorption have to increase to maintain the increased land and ocean temperature measured in terms of our representative air. Add 1.188oK/yr to 281.92oK and enter 283.108 for T. Enter x for P and click Calculate x. P =364.24335wpsm Subtract 358.2wpsm. The change in Radiation Power per area absorbed by the surface is 6.04335wpsm.
Now look at the 2010 NASA Earth Energy Budget. Notice net absorbed by surface, 0.6wpwm. And there is more. The Earth Energy Budget does not reconcile. Therefore, change net absorbed to 0.5wpsm, incoming solar radiation to 340.3wpsm and emitted by surface to 398.3wpsm. 6.04335wpsm exceeds 0.5wpsm by more than 12 times. To find the correct values add 0.012oK/yr to 281.92oK, enter 281.932 into the Stefan-Boltzmann Law calculator for T and x for P. Click Calculate x. P equals 358.2288408wpsm. Add 0.5wpsm and enter 358.7288408wpsm for P and x for T. Click calculate x. T equals 282.0303256oK. Subtract 281.92oK. 0.110325609oK/yr is the net absorbed kinetic energy by air, land and ocean. 0.012/0.110325609=0.108768944 The annual air temperature increase is 10.9% of the global temperature effect. 1-0.108768944=0.891231056 The annual air temperature increase equivalent to the kinetic energy absorbed by land and ocean is 89.1% of the global temperature effect. The ocean is 84.6% of the global temperature effect. The land is 4.5% of the global temperature effect.
I calculated that carbon dioxide’s annual contribution to temperature is 0.0029oK/yr. 0.0029oK/yr divided by the current trend 0.012oK/yr is only 24.17%. In terms of the last 4.75 years it is only 2.76%, 0.013775oK/0.5oK=0.02755. How low can you go! Now that you have forced me to calculate the annual temperature effect it is only 2.63%, 0.0029oK/yr divided by/0.110325609oK/yr=0.0263.
I statistically proved that the earth’s air temperature determines the growth rate of carbon dioxide in the air by regressing annual changes in carbon dioxide against channel 5 AMSU annual global air temperature anomalies between 1979 and 2011. The equation is dC=1.70+1.94*T. r=0.76434 r squared = 58.42% This equation estimates that if the temperature anomaly is plus 0.5 degrees Celsius the increase in carbon dioxide for that year will be 2.67 parts per million. Mis-specifying cause and effect is an intellectually dishonest trick to deceive the technically challenged. But if the Global Warming Believers want to insist that the direction of cause and effect is the other way around I can do that also. The equation is T=-0.514+0.302*dC r=0.7643492 r squared = 58.42% Both equations have the same level of attained statistical significance but only the first equation has any correspondence with reality. The mis-specified equation infers that in reality the earth's air temperature anomaly decreases 0.514 degrees per year unless there is a 1.7 part per million increase in carbon dioxide per year. In fact the coefficient overestimates the effect of carbon dioxide on temperature by 37.67 times. The average annual temperature at which the earth’s air radiates to space actually increased 0.4393 degrees Celsius between 1979 and 2011. Since carbon dioxide increased 54.8ppm the temperature anomaly according to the mis-specified equation should have increased 16.5496 degrees Celsius. 0.302*54.8=16.5496 degrees Celsius 16.5496/0.4393=37.67 This is a textbook perfect example that the public policy inference from a mis-specified equation of reality might be different than you expected. For example between 1979 and 2011 the carbon dioxide concentration increased 1.702 parts per million per year. If you plug 1.702ppm of carbon dioxide per year into the mis-specified equation the answer is 0.0 degrees Celsius increase in the earth’s annual air temperature anomaly. The Public Policy Inference is that you can increase carbon dioxide 1.7 ppm per year forever and never increase the earth's average annual global air temperature. The point is that if you try to use phony science to deceive, somebody like me can use your mis-specification of reality to draw a public policy inference that is not what you expected. All you have to know is that since 1979 the earth's average annual global air temperature has increased 0.80 degrees Fahrenheit and this was not caused by carbon dioxide.
[PS] This is a naive approach considering only one line of evidence. Please see "CO2 lags temperature", "Warming causes CO2 rise" and "CO2 rise is natural". Comments should go there.
John warner, you would clarify things enormously
(a) if you specified which part of air temperature you are referring to. Stratosphere? Upper troposphere? Mid-troposphere?
(b) if you discussed how your idea of rising planetary temperature (as cause of CO2 rise by out-gassing from the oceans) does differ from the similar ideas of Murray Salby et alii. [Perhaps you are unaware that Salby's ideas have already been thoroughly debunked.]
(c) if you specified the actual mechanism/s by which the past century's rapid global warming occurs [in the alleged absence of CO2 greenhouse effect]. So far, you have failed to do so.
(d) if you indicated how the well-understood and well-measured greenhouse effect of CO2 comes (in your eyes) to be null and void.
There is a very real problem here - since the world is a real physical entity, and not an abstract mathematical construct. John warner, you need to need to address the physical realities.
john warner - You have shown a great love of very exact numbers, but have not IMO demonstrated an understanding of the science.
For but one example: "I statistically proved that the earth’s air temperature determines the growth rate of carbon dioxide in the air" - CO2 levels over the last half million years of Earths history varied between ~190 to ~280ppm over the glacial cycle, with a temperature response of perhaps 10-15ppm per degree C global temperature change. Yet over the last 100 years with about 1C in global temperature change there has been a rise in CO2 of over 100ppm, more than 6X the thermal response. And that is without looking at the isotopic evidence, increasing ocean CO2 (your claim would seem to require decreasing levels there as CO2 moved to the atmosphere), or our excellent knowledge of just how much carbon we've burned since the Industrial Revolution. Your assertion of temperatures forcing CO2 rise is simply incorrect - it's human action.
I would suggest that instead of pulling data from the most convenient internet sources and running a calculator, producing numbers with no attention to significant digits, that you instead look into the actual science behind our understanding of climage science - The Discovery of Global Warming by S. Weart would be an excellent starting point for you.
John Warner @17, your style of writing verges on inchorence, making it difficult to determine your argument, when you even have one. A major contribution to that effect is your tendency to take up distinct arguments within the same paragraph; but to also scatter the discussion of any given argument across multiple, not necessarilly consecutive paragraphs. You appear, however, to be raising three major arguments, and a minor one:
If I have missed, or mistated an argument, please specify the argument clearly by explicitly stating the claim then in sequential paragraphs, with a separate paragraph for each line of evidence in favour of the claim, state the evidence for each claim; before then stating the next claim and so on. Your thoughts are not so brilliant that we should be required to wade through "word salad" to try and garner them.
Taking the identified points consecutively on the list above:
1) You claim, "Since you did not cite the sources I have to gather my own facts." In fact, I did better than cite sources, I provided active links to the data (except for Mauna Loa which I thought sufficiently well known to not require such a link). Consequently, you did not need to "gather your own facts" because I did not provide you with the appropriate citations. Further, you did not "gather your own data". The data you use was gathered by (mostly) NOAA and NASA and processed by Spencer and Christy. You merely cherry picked the data most suitable to your narrative, ignoring approximately 80% (by time) of available temperature data to do so.
2) Your preferred temperature data is not temperature data specically. Rather it is the microwave signal from Earth as detected by a series of different units from a series of different platforms. These platforms in turn have had decaying orbits and orbits not in tune with the day night cycle such that different locations are observed at different local times on consecutive orbits. On top of this, the quality of the instruments themselves are known to decay in space, and the altitude weighting profile of the observed signal changes with the altitude of the surface, and depending on wether the signal processed is over land or sea. On top of that, each data point represents an average of signals across a wide swathe so that all TLT data is "homogenized" automatically, despite the major objection to the instrument record mounted by AGW deniers being that homogenization.
Because of these difficulties, the processing of the microwave signal data required to generate a temperature record is far more extensive than that required for the instrumental records. The difficulty of the process has resulted in a number of major corrections over time, partly listed below:
These corrections have continued, and Spencer and Christy are in the process of introducing a major new correction at the moment. Curiously at the same time as they are introducing a correction that will reduce the trend, the rival RSS product (which produces a different record from essentially the same data) is introducing a correction that increases the trend. Also at the same time, Spencer and Christy are ignoring a peer reviewed correction to their own product which would also increase the trend. It should be noted that (unlike the case with the instrumental record), the corrections are large relative to the "observed" trend. Worse, there are at least four independent analysis of the microwave data to determine a TLT temperature, all of which come up with different trends, with the differences being large relative to the observed trend.
In contrast, with the instrumental record, using partially overlaping data sets, 5 major institutional records using different techniques all come up with essentially the same result. One of those, the Berkeley Earth Surface Temperature project (BEST) was headed by people noted for their criticism of climate scientists, and funded by leading climate denier funders, the Koch brothers. It would rightly have been regarded as the denier's temperture record until the deniers repudiated the result (having earlier affirmed that the method was appropriate and adequate). Further, at least 4 independent private citizens have processed the data and also come up with essentially the same result.
The upshot is that we know fairly well what the instrument record tells us about GMST, whereas we do not know what the satellite temperature record tells us because we do not yet know the correct means of processing it. Therefore, if anything we should prefer the instrumental record. We certainly should not truncate 80% of the data because we refuse to use any record other just one satellite record.
[PS] Further details of satellite versus thermometers discussed here and a good place for any further discussion, before this goes too much further offtopic.
3) You write:
However, when you get around to discussing it, you do not discuss the energy involved, but restrict the discussion to temperature trends (degrees K per year). You give rough energy conversion factors but no data.
Instead, I the 0-700 Meter Ocean Heat Content data from the KNMI Climate Explorer, and regressed it against the CO2 forcing as determined from Mauna Loa. The result is a correlation of 0.917, and R-squared of 0.841, and a regression of 13.55 (+/- 0.445) x 10^22 Joules /(W/m^2). The 0-700 OHC data represents sufficient of the Earth's total surface heat content anomaly to be considered representative over the long term. That regressing the OHC against CO2 forcing provides as much support as does regressing surface temperatures means that your objection (for which you provide no relevant data) is merely a smoke screen.
4) Finally, with regard to cause and effect, it is a matter of simple physics that increasing CO2 concentration will increase surface temperature, and that increasing temperature will increase CO2 concentration in the atmosphere. The question is, what is the relative magnitude of each effect. If we look at the record over the recent glacials, we see (according to this graph) a change of 100 ppmv for a 10 C temperature increase:
That represents 10 ppmv/C meaning the 120 ppmv increase in CO2 since the preindustrial era, if caused by the temperature increase, must have required a 12 C increase in GMST to match it. That is somewhat exagerated. GMST are widely thought to have represented just 50% of the Vostok variation, which would reduce the required temperature increase to 6 C, but again that is way to much. Using your formula, dC=1.70+1.94*T, a 120 ppmv change in CO2 concentration requires a 61.85 C change in temperature to drive it. Taken seriously, if you actually think that is the relationship between CO2 concentration and temperature, you must think the Earth to be ice free and uninhabitable, with a GMST of 76 C.
Your formula is, of course, in error, having been taken from too small a data set. But a variety of estimates show that the rise in temperature can have contributed no more than 10% to the increase in CO2 concentration. That is consistent with the ten lines of evidence that show conclusively that the recent increase in CO2 concentration was driven by anthropogenic emissions. Disagreeing on this point is intellectually as unsuportable, given the evidence, as geocentrism.
From the fact that the vast majority of the increase in CO2 over the 20th century was anthropogenic in origin, it follows that the strong correlation between CO2 forcing and temperature, and the statistically significant regression demonstrate a major impact of CO2 on GMST.
[PS] Also should note (amplified in Tom's last link) that rising ocean temperature releases CO2 over long term (with ocean mixing). In short term ocean is net absorber of CO2 not a source. See Tom's last link for evidence.
Tom be patient with me. I have been working hard on your regression. I have pages of notes to justify my petty criticism of your mistakes. I only sent you those two comments to let you know I was interested. I apologize for not telling you the first note was a comment I sent to an Economist post commenter November 24, and I was not being critical of him. I was just saying I can get the facts. Neither of us knew anything about the annual temperature effect. And it was not until I finished my comment that I realized the magnitude of the annual temperature effect made carbon dioxide less believable. In the comment at 17 using temperatures I calculated that carbon dioxide only accounted for 24.17% of the current temperature trend of 0.0120K per year. Converting to air temperature equivalent radiative forcing to heat both the air and the surface as you introduced adds up to 0.7612wpsm per year. 0.0148wpsm per year divided by 0.7612wpsm per year equals 1.94%. You were trying to augment the carbon dioxide sensitivity coefficient with the heat coming out of the surface that you forgot to put in. Maybe you can give up on this one and credit the other 199.7852watts per square meter attributable to the other forcing factors with heating the surface. The second was a comment I sent to Dan Lashof at the National Resource Defense Council in November of 2012.
Tom Curtis @ 15 I like to get to the heart of the matter and I don't feel like typing pages of notes to justifying my petty technical criticisms. I realize the incredible scientific inferences about reality from the summary statistics you report will easily survive my petty criticisms. I looked at how you calculated your independent variable and the scale on the x axis. Carbon dioxide concentration increased 1.7wpsm in 163 years. Carbon dioxide added 0.01 watt per square meter of radiative forcing every year and controlled 81.1% of the of the earth's air temperature variation for 163 years. And just one watt per square meter of infrared radiation absorbed by this gas can raise the earth's air temperature 0.58oK. None of these inferences conformed to reality. [mod. - Are you suggesting here that every PhD level researcher, every National Academies, and all the most prestigious scientific institutions around the world, all don't understand the basic science on climate change? It's a stunningly audacious statement!] My understanding of the global warming controversy is that the earth controls its own temperature [How? By what mechanism or process does this happen?] and there should not be a correlation between forcing factors and air temperature. That is why in comment 9 I showed how the earth mitigates a 23.5wpsm change in solar radiation power every year. In the comment at 17 I regressed change in carbon dioxide against air temperature and found that temperature explained 58% of the variation in carbon dioxide. But I also regressed air temperature against the change in carbon dioxide and also got an R2 of 58% but the regression results did conform to reality. Returning to your regression the challenge was to figure out how you could you get such a high correlation with annual air temperatures born of chaos with a de dimimus forcing factor and a carbon dioxide sensitivity coefficient 2.951 times higher than the theoretical scientific value. And the answer was obvious. A proxy measure for air temperature was being regressed against another proxy measure for air temperature. But since proxy measures are so bad, why the high correlation. When the ocean temperature is higher less atmospheric CO2 is sequestered from the CO2 created from burning fossil fuel and the parts per million increase for the year is higher than average. This would result in a higher annual increase in carbon dioxide radiative forcing for that year. If the ocean temperature is lower more atmospheric carbon dioxide is sequestered in the ocean and the parts per million increase in the air for the year is lower than average. The result is a decrease in radiative forcing for that year. The physical connection between the two variables could not be closer because the dependent variable is the Global Mean Surface Temperature and 70% of the GMST is sea surface temperatures measured by ship logs and recently by satellites. Finally, why is the sensitivity so high. In a linear regression if I enter the data for the independent variable by one decimal place to small the coefficient will be one decimal place to high. By entering a too low forcing factor for the independent variable you got a too high carbon dioxide sensitivity coefficient. As currently generated it has no scientific meaning. Whatever it is, it shows a relationship between carbon dioxide in the air and sea surface temperatures, which we already know. In order to have the moral force of science for public policy, a quantitative scientific study has to have a rigorous scientific explanation and the summary statistics have to conform to reality.
[RH] These last two posts read as little more than indecipherable ramblings. Maybe Tom can make sense of it but this activity is very much trying the patience of moderators.
We encourage substantive discussion on climate matters. Perhaps you can endeavor to organize and present your thoughts in a more coherent manner so that people here can better understand the points you're trying to make.
KR @ 19 My regression was dCppm/yr = 1.70ppm/yr + 1.94ppm/oK * ToK
T is the temperature anomaly around the 1981 to 2010 baseline. For example if T is 0 the carbon dioxide increases 1.7ppm/yr. In 1998, an El Nino, year the temperature anomaly T is 0.5oK dC = 1.7ppm/yr + 0.97ppm/yr = 2.67ppm/yr
john warner @23.
If you wonderful regression was anything more than the result of a curve-fitting exercise, you could, say, use it with HadCRUT4 (suitably re-based) to calculate CO2 levels back into the 1800s. Alternatively, you could use it with CO2 data obtained from ice cores to back-calculate a temperature record.
I have to say that the results of such calculations do suggest your regression is nothing but curve-fitting.
Tom Curtis at 20. Using my temperature data I say the earth's average annual global surface air temperature has increased .444oK since 1979. Can you make a statement like that from your data? The key to doing research is knowing what you are looking for. For all there knowledge global warming believers have they can never answer the simplest questions. What is the earth's average annual global air temperature? I am not going to give you the answer until you give yours.
[PS] Sloganeering.
The impossibility of measuring global absolute surface temperature as been known for a long time and if you havent read Hansen and Lebedeff 1987 then it is time you did. Then you might actually understand why anomalies are used instead.
At this point you are not engaging in any meaningful conversation and instead are rambling from topic to topic. I would request that answer Tom Curtis' point, stating clearly where you agree and where you disagree before jumping off at another tangent. If you not are interested in engaging with points raised, then your time commenting here is over.
[RH] [edit] Here is a very good explanation of why it's better to use anomaly over absolute temperature. LINK It's a sure sign of a rookie who insists on using absolute temps.
john warner @23, how did you obtain that regression? Specifically, what data did you use? Was the data used in monthly or annual values? Did you use an ordinary least squares linear regression as obtained from the linest function in Open Office and Excel?
[PS] I rather doubt john warner has will or skill to engage in meaningful discussion of the science and so far has simply derailed this thread with offtopic "discussion". I have asked him to address specific points so that any further discussion to move to appropriate threads. Please dont chase after wild horses if/until john has more clearly identified his points of departure.
john warner @24, the Global Mean Surface Temperature from Jan 1979-Dec 2015 was 15.1oC with a margin of error or about +/- 1oC (I would have to email a member of the BEST team to obtain a precise value). The trend temperature increase over that period was 0.66oC. The time period was chosen to approximately match that of the satellite record but to avoid any contamination from the seasonal cycle. This is according to the Berkeley Earth Surface Temperature Land Ocean Temperature Index (BEST LOTI).
John Warner, I have read all your posts, and broadly I disagree with your reasoning and conclusions. Much of what you say is hard to follow, and looks wrong to me, and Tom Curtis has much more in depth climate knowledge than me and has picked holes in the same things. I also cant see anything incorrect in what Tom has said, and his notes on the ice age cycles were illuminating and clear.
Tom has also shown you the respect to respond to specific issues you raised. Now its your turn to respond to his specific points especially in post 20, points 1-4.
You appear to believe CO2 is coming from the oceans or some other natural source. The oceans are acidifying (getting less alkaline) so are absorbing CO2, not emitting it (in a net sense over decadal time periods).
Volcanoes and the biosphere are ruled out as significant sources. Theres a ton of research on that and you havent even begun to falsify it. You would have to show in precise detail where its wrong, not just generalise or do your own alternative version..
There are many things that show increased CO2 comes from fossil fuels rather than other sources. The population of the earth has gone from 1 billion to about 7.5 billion in just the last 150 years, which represents a huge increase in fossil fuel use correlating rather well with increases in atmospheric CO2.
Sure warmer and warmer water absorbs less and less CO2 but so what? it has not reached saturation and when it does that would obviously present us with even more problems.
Tom Curtis @ 26 Scientific calculator, UAH Lower Troposphere, Mauna Loa CO2 annual
Tell moderator my regression conformed to reality.
Tom Curtis @ 27 No Problem. Moderator said you can't measure average annual global surface air temperature.
Tom I can talk to you. Tell moderator that I read and understood your regression at Tom Curtis 15. I have invested a lot of time convincing you that we can have a discussion. You might also tell the moderatorer you have never received a more thoughtful, intelligent, knowledgeable, insightful response.
The average annual global surface air temperature is 281.92oK. [mod. - Nope. That might be TLT, but it sure isn't a surface temperature reading @ 8.77°C]
Let's have a discussion. You choose the subject.
While your thinking of a subject consider that dana 1981 wrote an article saying the climate change denier don't know science. I am here on your home field to prove that the global warming theory is shallow and not scientific. My preference is for you to defend what you think is the strongest scientific argument for global warming. Let's find out who has the science on their side. If you like the way I think let's see what we agree upon.
[RH] The moderators are perfectly capable of reading your comments. You don't need to ask Tom to tell us anything. You're skating just along the edge of moderation complaints, and per our policies, those are deleted. But continue...
[PS] Ok, the paper I pointed to (have you read it?) points to lack of practical usefulness in any measure of absolute surface temp given the error bars. (especially compared to anomaly methods). You would know that if you read resources people have provided you. So far you have only demonstrated you have an extremely poor grasp of even the basics of climate theory, a reluctance to improve your knowledge, and yet on that basis believe you know more than the experts. You have so far failed completely to overturn any of the science here. You have not stated as requested where you agree or disagree with Tom's response on your CO2 outgassing fantasy.
"You might also tell the moderatorer you have never received a more thoughtful, intelligent, knowledgeable, insightful response." ROFLMAO!
John warner, you seem to be unaware that UAH Lower Troposphere is not a measure of global surface temperatures. It has a limited overlap, and a rather poor correlation with: GMST.
Your computations are therefore not valid.
Nor have you taken into account ocean surface temperatures and total ocean heat content - all of which also have a rather poor correlation with UAH Lower Troposphere temperatures.
The end result is that you are wasting your time, and have produced GIGO.
[RH] TLT has significant bleed from the stratosphere as well, and thus is biased low. If one is going to use satellite data TTT is a better product for the troposphere. But, as you note, none of the satellite data are representative of the surface temperature.
Moderator @ 29,
There are of course two UAH TLT records as well as RSS TLT.
The v6.0beta5 (which is not yet released so shouldn't be in use) has an annual cycle with an average well below freezing so the annual averages will also be below freezing. I calculate Dec15 to Nov16 at -8.67ºC. (Note, the value presented by the commenter is only a couple of fat fingers away from this value.)
RSS TLT would have similar anomaly values. UAH TLTv5.6 has a lower average altitude (about 2km lower) so should have an average above freezing but the +8.77ºC could be a bit high. I've never seen its absolute values quoted for UAHv5.6.
MA Rodger @31, the annual cycles for earlier verions of the UAH TLT were found in the "read me" files. The average for the UAH v 6 beta5 has a mean of -9.2 C, or 263.9 K. That is well below the 282.9 K (+8.77 C) quoted by the john warner. john warner's values are also well above the appoximately -13.5 C mean for the AMSU chanel 4 data that he cites elsewhere for the seasonal cycle. That makes it something of a mystery as to how he actually obtained the value. Given that he seems only to have been making a rhetorical point "For all there knowledge global warming believers have they can never answer the simplest questions" - a point that has no basis; the issue seems moot with regard to this discussion.
[PS] To all commentators responding to John Warne.
This charade of a discussion is at an end. John Warner has unfortunately derailed this thread and offtopic discussion here stops now. John believes he can attack climate science with his superior science at any point.
If this is so strong, then I suggest that he use the "arguments" menu to pick something he believes he has a strong case against and present the science that challenges it on the relevant thread. No sloganeering. Produce data and/or paper in support and leave the rhetoric at the door. I strongly recommend that he reads the science he is attacking first rather than just assuming he knows it based on statements so far. IPCC WG1 is your friend.
Any discussion of surface versus satellite record goes here. Discussions about source of CO2 go here.
For completeness, I have analysed the relationship between CO2 forcing and the UAH TLT v6 beta5 elsewhere.
Further, with the moderators indulgence, I will respond to john warner's request that, "You might also tell the moderatorer you have never received a more thoughtful, intelligent, knowledgeable, insightful response."
Frankly, I would have used none of those adjectives in describing john warner's contribution to this debate. Rather, his analysis has been poor, relied too heavilly on cherry picked sources; and his discussion has been non-responsive and marked mostly by failure to acknowledge contrary evidence. Finally, his reasoning has been masked by his composition, which as previously remarked, resembles word salad. I find it difficult to believe clear logical thought underlies such poorly expressed arguments.
[PS] Thank you for cooperation in putting your response to an appropriate thread.
To all between 26 and 33 two corrections: I used UAH Mid Troposphere. I think channel 4 was down in 1912 when I sent this to Dan Lashof at the Natural Resources Defense Council.
There is a typo I need corrected at line 16 for john warner @22 Change, did conform, to did not conform.
My source for the earth’s average annual global surface air temperature of 281.92oK, is NASA 2010 CERES Earth Energy Budget. Notice absorbed by atmosphere is 358.2wpsm. The Stefan-Boltzmann Law Calculator yields an average annual global surface air temperature of 281.92oK.
https://science-edu.larc.nasa.gov/energy_budget/pdf/Energy_Budget_Litho_10year.pdf
[PS] You have been responded to on the appropriate thread. Do as directed. No further offtopic comment is being permitted here.