


 Arguments


2014 SkS Weekly Digest #36
Posted on 7 September 2014 by John Hartz
SkS Highlights
97 hours of consensus: caricatures and quotes from 97 scientists by John Cook
El Niño Watch
For months now, the tropical Pacific Ocean has been flirting with blossoming into a full-fledged El Niño state: Waters off the coast of South America have warmed, a hallmark of the climate phenomenon, but then cooled, only to warm once again. Winds, which normally blow east-to-west have made tentative moves in the other direction, another key criteria, but the bottom line is that the whole El Niño package hasn’t come together.
So, is this El Niño going to happen or not?
“Most likely” is the answer from forecasters with the National Oceanic and Atmospheric Administration’s Climate Prediction Center and the International Research Institute for Climate and Society at Columbia University, who issue monthly forecasts.
El Nino Watch: 6 Months and Still Counting by Andrea Thompson, Climate Central, Sep 4, 2014
Toon of the Week
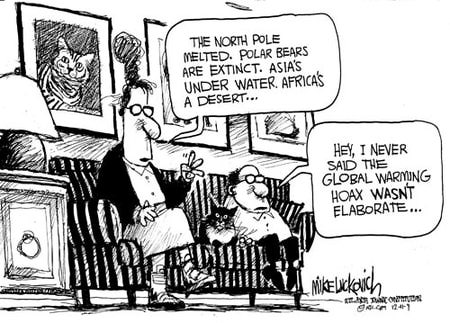
h/t to I Heart Climate Scientists
Quote of the Week
'Yet, like a young person planning their career, a mayor looking at future demographics or a corporation evolving a business strategy, there also needs to be a long term view of where we want to be fifty years or so down the road.
"That long term vision is ‘climate neutrality’ – ie not putting in more greenhouse gases into the atmosphere than natural processes take out – as soon as possible in the second half of the century.
"There is ample evidence from the UN’s climate science panel that global greenhouse gas emissions have to be zero or near zero by the end of the 21st century if we want to achieve the goal of holding a global temperature rise below 2C."
New York climate summit is a chance to push for long-term climate neutrality by Christiana Figueres and Mario Molina, The Guardian, Sep 4, 2014
SkS in the News
The teaser widget for the 97 Hours of Consensus campaign caused a stir in Deniersville this past week. The absurd speculations by a prominent climate denier and his followers are squarely addressed in:
- Conspiracy theorist Anthony Watts counting down to "sue the pants off" SkepticalScience by Sou, Hot Whopper
-
Anthony Watts Hot on the Conspiracy Trail. Serprise, Serprise, Serprise!! by Peter Sinclair, Climate Denieal Crock of the Week
In his ArsTechnica article, Scientific consensus has gotten a bad reputation—and it doesn’t deserve it, John Timmer links to John Cook's Communicating Scientific Consensus posted on the website of The Cultural Cognititon Project at the Yale Law School.
SkS Spotlights
The Woods Hole Oceanographic Institution is dedicated to research and education to advance understanding of the ocean and its interaction with the Earth system, and to communicating this understanding for the benefit of society.
Poster of the Week
SkS Week in Review
- 97 hours of consensus: caricatures and quotes from 97 scientists by John Cook
- 2014 SkS Weekly News Roundup #36B by John Hartz
- Rising Ocean Temperature: Is the Pacific Ocean Calling the Shots? by Rob Painting
- When their research has social implications, how should climate scientists get involved? by John Abraham
- 2014 SkS Weekly News Roundup #36A by John Hartz
- Climate sceptics see a conspiracy in Australia's record breaking heat by Graham Readfearn
- Fire and water – how global warming is making weather more extreme and costing us money by Dana
- Keystone XL: Oil Markets and Emissions by Andy Skuce
Coming Soon on SkS
- Lord Leach – an example of reliance on unreliable sources of global warming information (Dana)
- In the Years of Living Dangerously, Part 2 (John Abraham)
- SkS Weekly News Reoundup #37A (john Hartz)
- Cutting Emissions Pays for Itself (MIT Center for Global Change Science)
- In the Years of Living Dangerously, Part 3 (John Abraham)
- Certain Arctic lakes store more greenhouse gases than they release (NSF News Release)
- SkS Weekly News Reoundup #37B (john Hartz)


If the hiatus is due to internal variation of the climate system does that imply that previous warming must be partially attributed to internal variation? And further does that mean that the warming attributed to anthropogenic carbon is overestimated?
I refer to Matt Ridley's argument and his defense here:
http://www.mattridley.co.uk/blog/whatever-happened-to-global-warming.aspx
I found convincing the email he quoted from the Chen and Tung (2014) authors supporting his interpretation of their paper.
Jim, try a read of Double Standard. Note also that the internal variability strongly affects surface temperature (ENSO in particular), but it doesnt do much to OHC. I would say that pretty much all variations in OHC are due to change in forcings.
jim - Depends on the period you are looking at, on whether you are examining sufficient data for statistical significance, etc. The period 1985-1999, for example, is 15 years (too short for significance, as are the last 15-17 years), showing a warming rate of 0.23 C/decade, while the statistically significant period 1984-2014 shows a warming rate of 0.167 C/decade. Short term variations definitely added to warming in the 1990's (albeit without statistical significance).
Longer term, the AMO for example appears to have had a cooling influence in recent decades (Mann et al 2014). There seems to be no way to support natural variation as a majority cause in recent warming.
"...does that mean that the warming attributed to anthropogenic carbon is overestimated?" - No, it means that there is natural variability plus the anthropogenic forcing trend, hardly a surprising result. See IPCC AR5 WG1, Chapter 10, Detection and Attribution of Climate Change, for the current state of the science.
[Source]
As noted on RealClimate wrt Chen, Tung, and others, "Nobody has any problems with the idea that multi-decadal internal variability might be important. The problem with many studies on this topic is the assumption that all multi-decadal variability is internal. This is very much an open question."
Hey guys,
are you going to comment on this paper from the global warming policy foundation?
http://www.thegwpf.org/content/uploads/2014/09/Warming-consensus-and-it-critics.pdf
Quote:
"While Cook’s approach appears to owe more to public relations or propaganda than the scientific method, there is little doubt that there is a scientific consensus, albeit not the one that the authors of the paper have led people to believe exists. The consensus as described by Cook et al. is virtually meaningless and tells us nothing about the current state of scientific opinion beyond the trivial observation that carbon dioxideis a greenhouse gas and that human activities have warmed the planet to some unspecified extent. The figure of 97% is entirely discredited, whatever the nature of the consensus."
herrhund, do you think it's worth responding to? Do you find its method to be sound?
DSL, well isn't that what sciense is about? Ongoing discussion has to be allowed and is a demand of science. There is always a chance that a study is not correct - to act like something is 100% sure is not allowed in scientific methodes, acting like it disqualifies whoever claims to know something for 100%.
If the method of the consensus project is well done according to scientific standards - I am sure they have no problem to responding to some of the points in the paper from the global warming policy foundation.
[JH] You are already skating on the thin ice of sloganeering which is prohibited by the SkS Comments Policy.
Please note that posting comments here at SkS is a privilege, not a right. This privilege can be rescinded if the posting individual treats adherence to the Comments Policy as optional, rather than the mandatory condition of participating in this online forum.
Please take the time to review the policy and ensure future comments are in full compliance with it. Thanks for your understanding and compliance in this matter.
Thank you scaddenp and KR for the references. In reading Chapter 10 of the IPCC report I see that Tung and Zhou (2013) is referenced quite a bit particularly in section 10.3.1.1.1. Here is a quote from the end of that section:
Now my reading of the chapter would be that there is anthropogenic warming but the contribution from internal variability and anthropogenic forcing is uncertain. I looked at the Tung and Zhou 2013 paper and they claim that "Quantitatively, the recurrent multidecadal internal variability, often underestimated in attribution studies, accounts for 40% of the observed recent 50-y warming trend."
My question is how to treat that body of literature in the above quote? Its very odd that this literature is included here and supports significant contribution of internal variability to the 20th century warming and yet the chart fig. 10.5 shows mostly a very small contribution from natural and internal variability. So obviously it has been discounted in the IPCC summary. But it is also not explicitly stated that these authors are are wrong in their conclusions. I am uneasy about this. The authors statements should be refuted completely or it is a reasonable opinion to hold that anywhere from 0 to 50 percent of the observed 20th century warming is from internal variability.
I also want to acknowledge that is a very good point that the assumption that the variability is all internal is an open question.
My own position right now is that there is 0 contribution of natural variability to the overall 20th century trend. And yet these above mentioned published authors hold a different opinion. I have to say claiming up to 50% contribution from internal variability is a reasonable position.
herrhund: "I am sure they have no problem to responding to some of the points in the paper from the global warming policy foundation."
They've responded. You haven't looked. And, no, science isn't required to answer every publicly displayed argument against it. If that were the case, no science would ever get accomplished. GWPF is designed to shape public opinion, not be scientifically accurate. Its writers can write just about anything they want without facing scrutiny. The general public certainly won't scrutinize, and scientists, for the most part, completely understand what the GWPF is all about and treat it accordingly (by ignoring it).
[PS] It would be better if any further discussion on this was moved to the thread pointed to by DSL. Herrhund - in the interests of a reasonable discussion, it would be best if you picked the point in the GWPF "paper" that you found most compelling (a criticism of the method used that would alter the conclusions of the paper) and that is not already answered.
herrhund @6,
Sorry, you only get to play that card if the paper is published in peer review, or is the official report of an internationally recognized scientific body.
There are too many kooks out there to expect academics to respond to every pet peeve produced by political hacks, politically motivated "think tanks", and other web crazies. If they think they have something of substance, let them publish. If they have not published, and you think they have something of substance, you specify what it is and why it is substantial.
jim - Yes,Tung and Zhou is part of the literature considered in the IPCC reports. But note that it is only one piece of the literature, that there are other works using similar and quite different methods that find the anthropogenic contribution to be much higher. In fact, there are papers referenced in AR5 showing much lower and much higher percentages.
But in looking at all of the literature, and the uncertainties expressed in those works, the IPCC has reported a PDF as shown above. It would be completely inappropriate to ignore the body of evidence in favor of a single paper.
[ Side note: IMO most of the estimates of AMO attribution are flawed. In particular, a linear detrending of North Atlantic temps to identify AMO is wholly inappropriate in the face of other factors/forcings being non-linear over the periods of interest, linear detrending doesn't correctly remove forcings. If you are looking for variability you must first accurately subtract knowns and only then look at unknown contributions, or you will misattribute the remaining forcings to the unknowns. T&Z 2013 fails on this point. ]
jim @7, you quote Tung and Zhao as saying:
Given the mean 60 year period of the AMO, that is an astonishing claim. The temperature impact of the AMO over 60 years (ie, one full cycle) should approximate to zero, and over 5/6's of a cycle it must be a small fraction of its impact over half a cycle.
To illustrate, consider Zhao and Tung (2013). They show a 0.1 C impact from the AMO from 1961-2010 (50 yrs), compared to a 0.49 C impact from 1974-2005 (ie, the most recent trought to peak interval). (See fig 1a inset). Their 50 year trend to 2010 in the regressed temperature data (fig1b) is 0.083 C per decade, or an increase of 0.415 C. That leads to a total increase due to natural variability of only 19.4% ignoring other factors (and in fact less than that considering the total actual temperature increase). Even then, that requires that the contribution from the AMO be 100% of the 0.49 C increase from 1974-2005, and hence that the change natural forcings be equal but opposite in sign to the change in anthropogenic forcings over that period.
So, when you actually look at 20th century data, their 40% claim is absurd on its face, even using their own data from a different paper. It requires far overestimating the peak to trough temperature impact of the AMO (which they consider the primary source of decadal variability), and ignoring the duration of the cycles to which they appeal. Even then we are ignoring the multiple additional problems with their claim, some of which are mentioned by KR.
KR @10 the link to posts where Tung laid out his defence were very helpful. I think i now understand what the problem is. The AMO has an 80yr oscillation and the completes 2 cycles in the modern record since 1850. But it also is undergoing a nonlinear increase. I take it that Tung is calling this increasing temperature in the AMO in the recent decades as partially explaining global temperature rather than a response to global temperature. I am not able to get much deeper into it but I think its more likely long term warming (longer than the AMO cycle) is likely to be a response not a driver.
This is so puzzeling to me because Tung does great work. Its very technically adept and his latest paper published in Science is a very important document of the response of the Atlantic to global warming.
I get the sense that his 2013 paper is good but the review process failed in letting him make a such a strong claim. I get the impression that he wanted to make similar strong claims in his 2014 paper but here the review process did not allow that.
Tom @11 That was my thought at first was well, that it seemed ridiculous just to plot the increase over the last upward swing of the AMO cycle. But i dont think thats is what Tung is doing. I think he is using the residual after removing the oscillation. I could be wrong, but if he is doing what you claim that would truly be ridiculous. I don't think that would have gotten through the review process.
The reason I am pursuing the climate literature so closely is that I am troubled by the role cognitive bias plays in climate science. It seems that those that those that support global warming as severe and imminent threat are classic liberal while those who doubt its severity are libertarian or republican. Now I personally think that global warming is a severe threat but then I'm a classic liberal. If only I were libertarian and believed global warming was a severe threat this would be so much easier!
I am currently a graduate student doing climate related work but i keep getting exposed to prominent scientists that seem to downplay the severity of global warming. i.e. Judith Curry (climate scientist), Jose Duarte (ocean ecologist) and now I suppose in the literature Tung. My explanation is that they may be biased by their social beliefs but than this makes me question my own biases.
You have elevated Jose Duarte to a position he has yet to earn. The kid's loud, confident and wrong.
jim @13.
The MLR analysis carried out by Zhou & Tung (2013) is a single process which takes a data series (D) and a set of functions (Fa Fb Fc etc) and calculates the best fit such that D= xFa +yFb +z Fc + residuals. Zh&T did this without AMO and produced their Figure 1a.
This is all non-controversial. It is when ZH&T repeat the exercise but with AMO (shown in the inset with the de-trended residuals) added to Sol Vol & ENSO and various profiles for Anthro that it all starts to go wrong. But attributing AMO is their whole purpose, so without it there is no MLR analysis.
The strength of AMO's input into HadCRUT (where they get their 40% from) is a simple output from the MLR. You can fire off a whole pile of objections as to why using AMO in the MLR is simple curve-fitting but even when we had KKTung here last year (here and here) to present his version of it, answers were not forthcoming.
jim - WRT Tung, not even the most prominent and respected people can be expected to bat 1000. And he's hardly alone in misidentifying the textbook definition for AMO (linearly detrended N. Atlantic SSTs) as correctly depicting internal variability in the Atlantic; internal Atlantic variation is change over and above what occurs due to the non-linear forcing changes (natural and anthropogenic) over the period under consideration.
Cognitive bias certainly plays a part in interpreting science, particularly in the public policy arena, but it really doesn't have any significant effect on the science, the data, itself - reality is a very harsh critic. Unless you're a fan of Stephen Colbert, who's noted, "Reality has a well-known liberal bias." :)
Judith Curry is a curious case, someone who overemphasizes uncertainties to the point of contradicting her own prior works. Just keep in mind that there are very very few scientists unconvinced by the evidence for AGW, for our role in climate change, and that those very few get overamplified by the blogosphere and media, overrepresented, because they are the only ones to ask for contrary opinions and false (i.e., unsupported) 'balance'. That overrepresentation doesn't make them right, and in fact is a useful heuristic for identifying extremely minority positions.
[ If you're actually a grad student in climate related work I'm very puzzled by your mis-identification of the recently blogging Duarte as an ocean ecologist - to the best of my knowledge he's actually a PhD candidate in Social Psychology, one who appears to have ideological axes to grind, personal issues seemingly disconnected from the work he then criticizes. ]
jim @13, I am not claiming that is what Tung did. I am claiming it is what you can do with Zhou and Tung's data, and that when you do it falsifies the claim that 40% of warming over the last 50 years was due to internal variability. Further, using Zhou and Tung's data if you accept the 40% claim, you are then required to accept that for a 30 year period from 1974 onward where natural variability accounts for 100% of warming (indeed, more than 100% once ENSO is included). That, however, is strictly inconsistent with the known relative strengths of anthropogenic and natural forcings, and the idea that anthropogenic forcings effect temperature. In other words, Zhou and Tung require the physics of climates to change on a decadal time scale for their regression to make sense.
In Zhou and Tung 2013, they do infact determine a residual after removing solar, volcanic, and ENSO components. The result is close to a straight line, which is no surprise given that they defined the AMO as the North Atlantic temperature minus a linear trend. To the extent that NA temperatures follow global temperatures, it follows that the residual of the regression will be a straight line and overstate the AMO component. The result is close to circular, and of little interest as a result.
KR @17 this is very embarrasing. I am confuseing my Duarte's. I meet Carlos Duarte and he seemed to downplay the effect the severity of the climate threat, giving reasons for optimism. But I dont even whant to attribute that position to him maybe he was just making the argument.
KR @ 17 I am in an Agricultural Engineering department which does a lot of work with extention and I attend the Southeast Climate Conference of which John Christy and Judith Curry are prominent. I think in my department, which does a lot of extension work, most members don't want to emphasise climate because frankly our clients (farmers, water managers) don't want to hear about it. It seems adaptive response to current climate variability is an acceptable argument for the extension work but don't talk about climate change.
jim - Ah, that explains the Duarte mention. Happens to everyone, I'm really bad at remembering names myself.
Carlos Duarte has said:
I would consider this a well-reasoned statement against hysteria. I would not consider him to be optimistic regarding climate change, however, as his work has also stated:
Hardly an optimistic outlook, IMO.
Side note: your mention of "I keep getting exposed to" Curry, Duarte (Jose), and Tung give me the impression that you've been reading denialist nonsense blogs that emphasize those particular positions. You should avoid those - they rot the brain.
jim - Regarding Curry contradicting her own work, see Rabett Run, Curry vs. Curry, where he describes the situation far better than I could.
Christy is, if anything, worse - he habitually presents irrelevant, uncorrected, cherry-picked (Sierra Nevada winter snow extent _only_ while ignoring yearly anomalies and the greater Rockies), or simply deceptive information (graph from Christy), and claims from those that climate change either isn't happening or isn't having an impact. I consider his impact on public policy to be strictly destructive.
I would suggest reading a wider variety of work.
I agree that the contrarian blogs are very bad nonsense. But the 2013 and 2014 papers by Tung were somthing i was not able to work through on my own. The references and discussion KR and Tom provided helped very much! Now back to thesis writing!
In the last week the “skeptic" blogs have been agog with Ross Mc Itrick’s statistical analysis that the haiatus goes back 16, 19 or 26 years depending on the data set.
file:///C:/Documents%20and%20Settings/user/My%20Documents/Downloads/OJS_2014082814175187.pdf
Reliably, Watts puts up a graph of the Hadcrut4 data set (1995 to April 2014) from WFT but decides not to put in the WFT trend line which like the data in Mcitrick’s paper indicates a warming trend of 0.0925 °C/decade (the skeptical science trend calculator gives Trend: 0.093 ±0.100 °C/decade (2σ)) but substitutes a cooling slope.
http://wattsupwiththat.com/2014/09/01/new-paper-on-the-pause-says-it-is-19-years-at-surface-and-16-26-years-at-the-lower-troposphere/
My problem with McItrick’s paper is that he appears to be claiming that unlike the skeptical science trend calculator, his data shows that the hiatus is statistically significant. The stats is a bit beyond me , Does anyone have any ideas?
Philip Shehan @24.
This may or may not help but...
I always see four different flavours of "hiatus" being discussed. The first is the David Rose of the Daily Rail version. This version simply shows that the present global temperature is still below the temperature of some cherry-picked temperature of time gone-by. Thus the 'hiatus' is, to be as silly as possible, using HadCRUT4 24 years and 4 months long. The silliness becomes plain when average temperatures over a year or a half decade are compared, rather than single months.
The second flavour is courtesy of Dickie Lindzen who fed the question to Prof Jones via the BBC's Roger Harrabin. Has gobal temperature rise been statistically insignificant over the last X years? The answer given was "Yes, but only just," which I consider to be correct but the wrong answer. The answer should be 'Yes, just like the period of Y years previous to that, and the previous period of Z years before that again. No statistically-significant rise does not mean no significant rise.'' The actual value of X is a function of the rise as well as the size of the wobbles. (Stat significance is not proportional to X but to X^1.5 (or is it X^2.5?) which is why X and Y and Z don't change much.). For the same rate of rise, bigger wobbles means X will be larger. X is usually ~16 years for the likes of HadCRUT (although HadCRUT(T&W) would perhaps be more appropriate to use). Using satellite data UAH or RSS gives you bigger wobbles and so gives you larger X.
The third flavour is the answer to the question "When did the 'hiatus' in global temperature begin?" and I would suggest that happened in 2007. Doing what Ross the Mac did but forwards not backwards so you've got more data and significance is maintained. This method shows that the global temperature record modelled as a linear trend was accelerating (the slope getting steeper) up to that point. See graph of GISStemp regressions two clicks down here. The slope peaks so the rise stops accelerating only in 2007. To say an accelerating linear trend is subject to a 'hiatus' would be an difficult statement to substantiate (although that will not stop fools saying it).
The fourth flavour leads to a more grown-up discussion and it is about when the symptoms that lie behind the 'hiatus' first appear, which is during the half-decade prior to the impact on global temperatures.
MA Rodger @16, a light correction. Fig 1a (shown by you) is the regression against ENSO, volcanic record, and solar only. Fig 1b is further regressed against the AMO defined as the linearly detrended NA temperature:
Jim, As I commented above, the result is near linear which is unsurpising given that the AMO used is just the North Atlantic temperatures minus a linear trend. Had the AMO been defined as the North Atlantic temperatures minus total CO2 forcing, the result would have mirrorred GHG forcing over the twentieth century. A paper doing that would have been rejected by AGW deniers as being circular (for good reason), but the same is equally true of Zhou and Tung. (Note, it is not strictly circular. To be strictly circular they would have needed to define the AMO as the linearly detrended global temperatures.)
In fact, the only sensible definition of the AMO from twentieth century data I am aware of is that from Ting et al (2009) (third panel), which is discussed in reference to Tung and Zhou by KR here:
Leaving aside, however, which is the correct AMO signal of the three (in order, linearly detrened NA, NA-Global Oceanic Mean, and NA-NA forcings), it is plain that very different results would be obtained by using either the second or third definition to that obtained by Zhou and Tung.
And finally, seeing as I'm showing figures, here is the CET series at 10, 15 and 50 year running averages. If anybody can show me the consistent approximately 60 year oscillaiton in that series I will be very impressed. Absent that persistent oscillation, there is no reason to think the AMO is a genuine mode of internal variability in global temperatures, rather than an artifact of the forcing history of the twentieth century.
Philip Shehan @24, this topic came up at And then there's physics. The key point is that the V-F method used by McKittrick indicates the pause starts at the earliest year such that for that year, and for each following year, the trend to the terminal year is not significant. That permits, however, that there be trends from the initial year to years prior to the terminal year that are significant. In such cases (and it is the case with every temperature set examined by McKittrick) it clearly begs the question to assume that there is a "pause" over the entire period, including over that subperiod in which there is a statistically significant warming trend. That, however, is just what McKittrick does. Indeed, I would go further and say they assymitrical treatment of trends to the terminal year and other trends shows the statistical analysis to be rubbish.
For the record, here are the longest statistically significant warming trends from the year the "pause" started according to McKittrick's method, as determined on the SkS trend calculator:
Finally, here is HadCRUT4 running 12 month means from 1970 showing various trend lines. It is plain from the data that it has warmed since 1995 in that data set, and indeed that it warmed through to about 2007. The apparent "hiatus" is almost entirely an artefact of the strong El Nino in 1998 coupled with the record breaking La Nina in 2011-12:
Philip Shehan, just to add to the already excellent answers on this, the ridiculousness of McKitricks' conclusion is shown by just plotting the trend for the 26 year hiatus in the RSS data along with the trend for the entire dataset:
You can immediately see that the OLS trend during the hiatus is almost exactly the same as the trend over the whole period. Also there is no obvious evidence of any change in the rate of warming in 1988 (1998 perhaps!), which is what you would expect at the start of a hiatus.
McKitrick's error is in calling a period where the trend is not statistically significant "trendless". A Failure to reject the null hypothesis in a statistical hypothesis test does not mean that the null hypothesis is true, and never has done. To see why this is true, we can consider flipping a coin (which is much easier to analyse).
Say I have (unknown to you) a double headed coin, and you want to determine whether the coin is biased. The first thing to do is to state the null and alternative hypotheses:
H0: The coin is unbiased - p(head) = p(tail) = 0.5
H1: The coin is biased, p(head) != p(tail)
We then observe some flips of the coin, and evaluate the probability (known as the p-value) of a result at least as extreme as the one we observe assuming that H0 is true. This is an important point, you suspect me of cheating and have a biased coin, but to provide self-skepticism, the test by starts by assuming you are wrong and that the coin is unbiased. If the p-value is sufficiently small, often 1 -0.95 = 0.05, then we consider the observations sufficiently unlikely and we "reject the null hypothesis" and can continue with the alternative hypothesis. Otherwise we "fail to reject the null hypothesis" and should keep quiet about H1 for the time being.
Note the purpose of the test is to avoid getting carried away by our enthusiasm for H1, so we have the hurdle of at least being able to reject H0.
Right, say we flip the coin four times, and get heads four times in a row (unsurprising as it has a head on both sides). The p-value (assuming an unbiased coin - which is H0) is 0.5*0.5*0.5*0.5 = 0.0625. This is more than 0.625, so we "fail to reject the null hypothesis", but does that mean that H0 is true? Definitely not, the coin is as biased as it could possibly be!
So what went wrong? The problem is that if you only flip the coin four times, we will never be able to reject the null hypothesis as the p-value can never be smaller than 0.0625. This is because if we don't have enough observations, the test lack statistical power. The power of a test is the probability that the H0 would be rejected if it actually is false. If the test has very high power, then not being able to reject the null hypothesis is evidence that the null hypothesis is true. If the test has low statistical power, then a failure to reject the null hypothesis may be because it is true, or because we don't have enough data to confidently show that it is false.
The bottom line is that a failure to reject the null hypothesis does not imply the null hypothesis is true, unless the test has high statistical power. McKitrick does not evaluate statistical power, but he really should have done! In saying that the period is trendless, he is asserting that the null hypothesis is true. Just plotting the diagram shows this clearly isn't reasonable in this case.
The other key problem is that he is looking (cherry picking) the longest period possible to get a trend that just fails to achieve statistical significance. This means that the observed trend would be a rather unlikely thing to see even if there were a hiatus. Essentially if we had a large number of Earths in parallel universes that were undegound a hiatus (and H0 were true) then about 95% of them would have a trend that is lower than the one we have observed.
This really is a STATS101 issue, and it is dissapointing that this wasn't picked up by the reviewers of a statistics journal.
Dikran Marsupial @28, the Open Journal of Statistics has a Google Scholar h5 ranking of 5, with a h5-median of 4. That is, in the last five complete years, the journal has just 5 articles which have been cited 5 or more times, and for those five articles, the median number of citations is 7. That compares the mean h-5 ranking of the top 20 statistics journals of 41.45, with a mean h5-median of 65.5.
Such a low h5 index could well be achieved by self citations alone.
It is no wonder that the first thing the website for McKittrick's paper informs you is that it is "An academic publisher". Without that flag, it is dubious that you would notice.
Tom, I understand it is also on Beal's list of predatory open access (author pays) publishers - more or less academic vanity publishing. I definitely won't be sending any papers there! ;o)
Dikran @30, indeed. Number 405 on the list.
Thank you to all those who responded to my request for opinions on this.
It will take me some time to properly read and consider your answers, but in the meantime, thanks again very much.
I will say at this point that I suspected on viewing the paper and comparing the results with those provided by the excellent skeptical science trend calculator that McItrick was converting 'warming no longer statistically significant (that is, the trend error margins include values below zero)' to a statement that this constitutes evidence for a pause, but as I noted previously, his statistics is beyond my level of expertise (limited to applications in biomedical research).
I have previously said on skeptic blogs that the requirement for statistical signficance for warming or cooling (the error margins do or do not cross the zero trend line) is "unfair" as far as a hiatus is concerned. By definition, a hiatus means that the trend is (or is very close to) zero, so any error margins no matter how small will include positive and negative trend values. It is difficult to see haow you can get a "statistically significant" pause by this criterion.
So I was wondering whether McItrick's stistical manipulations (not meant pejoratively) were a legitmate way of dealing with this problem, but considering the comments here, I remain unconvinced.
Any further comment welcome.
I might add that on Jo Nova's blog, when I raised these points, i was challenged to submit a manuscript for publication to the journal and see what the reviewers made of them.
This is a typical "skeptic" response and I pointed out that a few observations on a paper do not constitute 'original research' worthy of publication, but it did cause me to check on the Open Journal of Statistics (the 'open' in the title is enough to raise suspicions).
Philip Shehan - Sounds like a basic misunderstanding of statistics. Failure to reject the null hypothesis of no warming does not mean no warming has occurred, merely that you have insufficient data to exclude it.
To perform a frequentist test of 'no warming', you need to posit a null of warming continuing at previous rates and show that it is excluded. That simply hasn't happened.
Examining any time-span starting in the instrumental record and ending in the present:
The people at JoNova's blog, not to mention JoNova herself, simply don't understand statistics or the evidence you can gain from it. Their misperceptions lead them to false (i.e., wrong) conclusions.
Philip Shehan There are two ways in which the scientific community deal with journal papers which contain fundamental errors. The most usual way is for scientists to read the paper, raise their eyebrows, think "boy, the reviewers have let that author down!", and then ignore it. The result of this is that the paper rarely gets cited and the authors' academic reputation slips somewhat. The second way is that someone writes a comment paper (a "letter to the editor") pointing out the errors, and then the scientific community continues as in the first way.
I suspect in this case, nobody will be very interested in Prof. McKitricks paper, I doubt it will get many citations (outside e.g. Energy and Environment), and it won't change anything. The fact that Prof. McKitrick published it in a lowly journal that few people read and rarely contains ideas worth using (c.f. h-index mentioned by Tom) suggests that even Prof. McKitrick doesn't think his method has much value. If he did, he would have sent it to a more prestigeous journal.
So asking you to write a journal paper on this is basically their way of saying "we have no answer to your criticism, but we are not going to admit that, and we are not going to change our minds". In this case, there is little value in publishing a comment as the journal is not sufficiently prestigeous for the paper to attract much scientific interest, and it is unlikely that the skeptics on the blogsphere would pay any attention to the comment anyway.
BTW I have written several "letters to the editor", and whether they are effective depends on the nature of the audience. I wrote a paper explaining why Prof. Essenhigh's argument about the residence time of atmospheric CO2 does not mean the rise is not anthropogenic. However that has not stopped the skeptics from citing Prof. Essenhigh's paper and ignoring the refutation and not also citing my paper (e.g. the NIPCC report). I wrote another explaining the flaws in a paper about estimating the body mass of dinosaurs from their long bone measurements. While the authors of the original study were unable to accept their method was incorrect for this particular application, the research community often cite my paper, whenever the original one is cited. This rather shows a difference between some skeptics in the climate debate and the way in which scientists generally behave.
Just to answer Philips question more directly, no, McKitricks method is not a legitimate way of determining the length of the hiatus. The correct way would be to use changepoint detection, also known as piecewise regression, which attempts to see if there is evidence for a change in the slope of the regression function at some particular point. If there is, then the point identified would be the inferred start date of the hiatus. The major problem with this is that the standard methods (e.g. the Chow test) do not account for the autocorrelation of the time series, which means that it will tend to identify suprious changepoints.
Using the statistical test with the null hypothesis being that the underlying rate of warming has continued unchanged would also be a valid approach, and as KR says, in this case the null hypothesis would not be rejected and there would be insufficient statistical evidence to claim that there has been a hiatus.
I don't think anybody disagrees that there has been a hiatus, that much is evident from just looking at the data, however that does not mean that climate change has stopped, or is called into question, as it seems that it is likely to be due to a change in the redistribution of heat between the oceans and surface. Such redistribution is noise, not signal, but naive statistical tests do not properly account for the full range of unforced variability.
Thank you again to KR and Dikran for additional comments.
As a follow up to my comments above and the helpful replies, I finally got around to sending Ross McItrick an email on the subject as his blog does not appear to have a comment section. I mentioned on Jo Nova that i intended to do so and got the usual go on we dare you responses.
I will let you know if I get a reply, but here is the business end of my email after the introductory para introducing myself:
Anyway, I have previously said on skeptic blogs that the requirement for statistical significance for warming or cooling (the error margins do or do not cross the zero trend line) is "unfair" as far as a hiatus is concerned.
By definition, a hiatus means that the trend is (or is very close to) zero, so any error margins no matter how small will include positive and negative trend values. It is difficult to see how you can get a "statistically significant" pause by this criterion.
So I was wondering whether your calculations are a way of dealing with this problem.
I would like to point out similarities and difference in your results from those obtained using Kevin Cowtan’s algorithm for the calculation of trend and 2 sigma error margins, which take into account autocorrelation of the data. For Cowtan’s trend calculator I have input the year from your tables (inclusive) for the start date and 2014.25 (up to but not including April 2014) as an end date, which I understand to be the period you are covering.
http://www.skepticalscience.com/trend.php
The data in tables 1-3 appear to be very similar to the results returned by Kevin Cowtan’s trend calculator, which calculates the 2 sigma values taking into account autocorrelation of the data. The results here use the year and the endpoint of 2014.25 (up to but not including the month of April).
I will examine the years you have put in bold on tables 1-3 of your paper, which are the years furthest back in time for which the CI lower bound includes negative trend values.
Table 1 of your paper deals with Hadcrut 4 data:
19 1995 −0.0063 0.0925 0.1913 36.8666 19.8734
Which to 3 decimal places give the trend and error margins as
0.093 ±0.0.99 °C/decade
Which is essentially the same result as Cowtan’s algorithm:
Trend: 0.093 ±0.100 °C/decade (2σ)
Table 2 of your paper (UAH data):
16 1998 −0.0586 0.0609 0.1804 10.9176 5.6454
0.062 ±0.120 °C/decade
Cowtan’s algorithm gives essentially the same trend but almost twice the error margin:
Trend: 0.062 ±0.221 °C/decade (2σ)
Table 3 (RSS):
26 1988 −0.0005 0.1184 0.2373 41.6345 35.4573
0.118 ±0.119 °C/decade
Cowtan:
Trend: 0.121 ±0.109 °C/decade (2σ)
The trends and error margins are very close.
Again the years for which Cowtan’s 2 sigma error margins cease to include a cooling trend for Hadcrut4 and RSS are 1995 and 1990 (your dates 1995 and 1988) but Cowtan’s year for which this occurs for UAH data is 1994, commensurate with his larger error margin (your date 1998).
So, are you able to explain why Cowtan’s and your results are very close for Hadcrut4 and RSS, but UAH data has almost twice the error margin?
How are the results of your analysis different from saying that when there is no longer statistically significant warming, there is a statistically significant pause?
Thank you if you have the time to answer.
Phil Shehan
I received the following reply from Ross McKitrick.
I note that I was incorrect in thinking that he was saying that the "pauses" were statistically significant, but I believe he has incorrectly concluded that when warming ceased to be statistically significant, the "pauses" begin, even though at this point the trends are still warming and the error margins have only just crossed thew zero line.
Dear Phil
I don't know why the UAH result is so different. I don't know what algorithm is used on the SKS website. Also there might have been revisions to the UAH data set since I accessed it.
My calculations didn't aim to measure a statistically-significant trend in the neighbourhood of zero, instead I was aiming to measure how far back the hiatus apparently started.
Cheers,
Dr. Ross McKitrick
- Professor of Economics and Chair of Graduate Studies
- CBE Fellow in Sustainable Commerce
Dr McKitrick wrote "instead I was aiming to measure how far back the hiatus apparently started."
his method clearly doesn't do that. Here is a plot of the RSS data, along with trend lines showing the trend over the whole period, and the trend over the last 26 years, which McKitrick claims to be "trendless" according to his test:
There doesn't seem any evidence whatsoever of any change in the rate of warming starting in 1988 (a decade later perhaps), and the trend since 1988 is almost exactly the same as the long term trend.
The problem is that Dr McKitrick simply doesn't understand that a failure to reject the null hypothesis does not mean that the null hypothesis is probably true, and never has done.
All Dr McKitrick needed to do to see this problem was to plot the data with the trendlines, and it is pretty hard to understand why he obviously failed to perform that basic sanity check before publishing a journal papers (although perhaps it explains the choice of journal).