Archibald’s take on world temperatures
Posted on 5 July 2010 by John Chapman
Guest post by John Chapman
At a recent WUWT tour, David Archibald presents a series of plots to demonstrate that the world isn’t warming. The evidence represents a classic case of cherry picking and it is worth examining some of his submissions to illustrate the technique. One of his slides shows the snow extent of the Northern hemisphere.

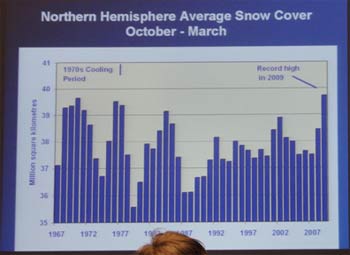
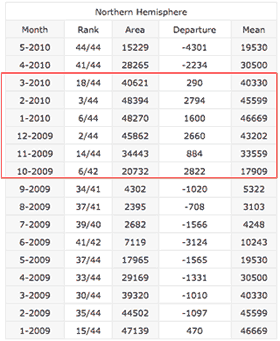
That fellow whose head is in the foreground probably thought all this talk of melting ice caps is nonsense. Well the key is the period – October to March. Why was this chosen? If you look at a table of the monthly snow cover area it is clear that these were particularly snowy months, above average for 44 years. Any month before or after the period is below the 44-year average.

Now if the whole of 2009 had been considered one would obtain the result as reported in the Rutgers University Snow Cover Annual Report 2009.

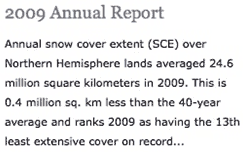
A completely different picture!
To give more non-warming evidence Archibald presents the following slide:

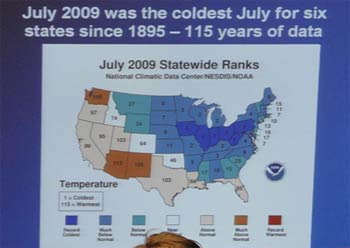
But note the explanation by a meteorologist in some paper of the region;

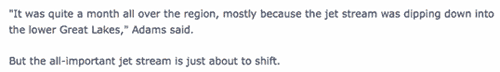
The June (and probably August) record was quite a different story when the jetstream didn’t dip and when a more global view is considered. From NOAA, the same source as the data in the above slide, “The combined global land and ocean surface temperature for June 2009 was the second warmest on record, behind 2005.” (www.noaanews.noaa.gov/stories2009)
Mention of the jetstream is significant as it is probably responsible for Archibald’s main message later on when dealing with sunspots. All sorts of correlations are made with temperatures in Ireland or Canada, little ice ages, Maunder Minimum, and he extends those correlations to the whole planet. But recent (peer reviewed) research by Mike Lockwood at the University of Reading has found that low solar activity promotes giant kinks in the jetstream, which is responsible for Europe’s recent freezing winter. Furthermore Lockwood’s findings throw light on one of the biggest puzzles of the Little Ice Age – namely that it appeared to be a particularly European phenomenon, with the rest of the world largely spared. A personal communication with Archibald on this salient point was rebuffed with the remark that “people can make statements and those can be printed in black and white but that does not necessarily make them true.” Indeed that particularly applies to authors who write books with content which would otherwise not be accepted by peer reviewed journals.
Back to Archibald’s support for a non-warming world, he brings data closer to the home of the audience, with this slide:

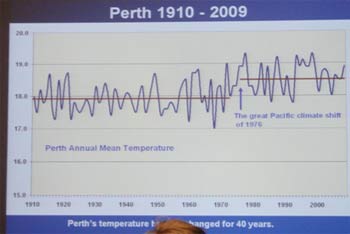
The plot has the partially obscured caption “Perth’s temperature has not changed for 40 years”. If one examines the temperature at the Perth airport site the plot would look like this:

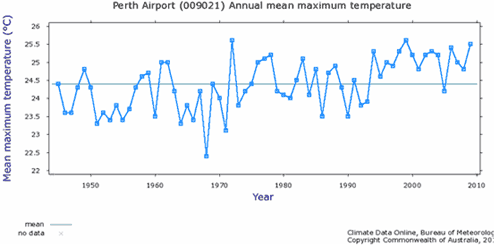
An obvious great Pacific climate shift is not so evident, but a general upward slope is, especially over the past 40 years. One distinction between the plots is that one is the mean while the other is the maximum temperature. The selection that one presents is the one that suits the argument. Now one might think having listened to

So it is quite clear that there is no persuasive evidence that the world is not warming.

Arguments


So I think a better response to Archibald is to say "The evidence for global warming has not been rebutted by his data"
Massimo Piglucci has a good post on the "burden of prook" here:
Burden of Proof
all the denial crowd says there is no melting in the Arctic and Greenland- they also say we are not warming, but cooling- they are given so much attention because we have a Media- that 'believes' a small group of people with bogus information needs to be heard- while the other 97% of scientists who have robust science needs to questioned and investigated for large 'errors' they have committed.
The media Titans in the USA need advertising dollars- so they print junk from the Denialists--they may lose their anti science sponsors- their revenues may be reduced-its all about money-not the truth.
It strikes me 24.6msqkm is >98% of the average (if the anomly that year was 0.4). That doesn't seem like a great disaster and it seems fair to suggest it could well be little more than natural noise. It would be hard to believe that 2% variation is much outside the error margins of the methodology. In my field of work I wouldn't get too excited by a 2% drop in anything and I don't have to work with anything as chaotic as the planets climate.
Dappledwater at 19:18 PM on 5 July, 2010
"What does Archibald think is causing the worlds ice sheets and glaciers to melt?."
AMO maybe.
There is something very significant about the period around the 1970s. It seems to appear as an important feature in many climate data sets.
A rather important eaample might be radiative forcing, images often show things really taking off around this time.
I don't see any harm in investigating other possible phenomenon that may explain this notable period. I agree though his terminology may be mis-leading.
Don't start quoting June-June periods somebody might accuse you of cherry-picking. El Nino might go some way to explain things.
from the data you can determine if a change is statistically significant or not, there's no such thing as absolute "too much" or "not that much". You can also determine the minimum period of observations (or number of observations) for a given variability to get significant results.
A tiny few percent of decrease per year may appear to be small, but in 100 years you're left with a few percent of the initial value. So the problem is how far you're looking.
The difference right there, between damned lies and statistics.
It fits perfectly into the process (cycle) of natural changes. Cited work here: Are cold winters in Europe associated with low solar activity? Lockwood et al., 2010.:
“The results presented in section allow rejection of the null hypothesis, and hence colder UK winters (relative to the longer-term trend) can therefore be associated with lower open solar flux (and hence with lower solar irradiance and higher cosmic ray flux). A NUMBER OF MECHANISMS ARE POSSIBLE [?! ...].
“Our subsequent studies (not reported here) on solar modulation of various blocking indices have confirmed previous studies, and we stress that this phenomenon is largely restricted to Europe and NOT GLOBAL in extent.”
These are really just local mechanisms?
No, it was not local, and will not be, warm and cold anomalies
Temperature proxy records covering the last two millennia: a tabular and visual overview
Ljungqvist, 2009:
“The records show an amplitude between maximum and minimum temperatures during the past two millennia on centennial timescales ranging from c. 0.5 to 4°C and averaging c. 1.5–2°C for both high and low latitudes, although these variations are NOT ALWAYS OCCURRING SYNCHRONOUS. Both the Medieval Warm Period, the Little Ice Age and the 20th century warming [...] are CLEARLY VISIBLE in most records ...”
High-resolution isotope records of early Holocene rapid climate change from two coeval stalagmites of Katerloch Cave, Austria, Boch et al., 2009:
“Our record also shows a distinct climate anomaly around 9.1 kyr, which lasted 70-110 yr and showed a maximum amplitude of 1.0‰, i.e. it had a similar duration and amplitude as the (central) 8.2 kyr event. Compared to the 8.2 kyr event, the 9.1 kyr anomaly shows a more symmetrical structure, but onset and demise still occurred within a few decades only. The different progression of the 8.2 (asymmetrical) and 9.1 kyr anomaly (symmetrical) suggests a fundamental difference in the trigger and/or the response of the climate system. Moreover, both stalagmites show evidence of a climate anomaly around 10.0 kyr, which was of comparable magnitude to the two subsequent events.
Using a well constrained modern calibration between air temperature and δ18O of precipitation for the study area and cave monitoring data (confirming speleothem deposition in Katerloch reflecting cave air temperature), a maximum cooling by ca 3°C can be inferred at 8.2 and 9.1 kyr, which is similar to other estimates, e.g., from Lake Ammersee north of the Alps.”
Once again, Lockwood (and underestimated here: mechanisms):
“This grand solar maximum has persisted for longer than most previous examples in the cosmogenic isotope record and is expected to end soon.” “... ~ 8% chance that the Sun could return to Maunder minimum CONDITIONS within the next 50 years. The connections reported here indicate that, despite hemispheric warming, Europe could well experience more frequent cold winters than during recent decades.”
8% - too small?
The surface ice in the Arctic melts roughly every 70 years, with the last melt in the 30s, and the one before that around 1880. National Georgraphic Magazine about a year ago had an article that described the oscillation. When sea ice decreases in the Arctic it increases in Antarctic, and that has happened this time as well. Sea ice depends upon the relative warmth ocean currents. As to the ice caps, the last IPCC report claimed that the total land ice is very close to stable. If temperatures are well below zero, warming does not cause melting.
In the climate debate, the burden of proof is for advocates to prove that there is a climate crisis. The crisis theory is based entirely upon math models that predict the earth will warm considerably more than the straight physics of carbon dioxide predicts. The test of math models is whether they work reliably. Observed data is below the model error bounds, so the models are wrong. The present task therefore ought to be to find models that work.
UAH
GISS
RSS
GISS
Do you have any further information to back up that claim ?
Just quickly looking at the NOAA site, I have found a 0.31F/Decade trend since 1990, and a 0.43F/Decade trend since 1980.
Try it yourself here. All based on a 1901 to 2000 base period.
Do you mean since 2000 ? Here the trend is -0.73F/Decade but surely you don't find that significant ? And that is only one decade - hardly "recent decades".
Global record UAH LT V5.3 May 1995 to May 2010
trend is +0.13 C/decade, almost identical to that of the entire record.
Continental USA record RSS TLT V3 entire record (1979 to 2010) trend +0.15 C/decade
These are public access direct satellite measurement records. Your statements on this are not supported by the evidence.
Arctic sea ice 70 years ago was around 20% greater (mean level) than today, from our best overall publicly accessible records. For Antarctic we have very sparse records for pre 1950s, so your statement is dubious to start with, however whaling records, proxy records, and a few voyages we do have a few records from suggest that Antarctica had significantly higher sea ice levels than today, though no precise figures exist. The rise in maximum or mean Antarctic sea ice over the 1978 to present satellite period is just above borderline significant. The 1972 to 1978 interrupted satellite record shows a drop in maximum extent from a higher value than present. The earlier record has uncertainty attached, but it is the best information we have. None of this is based on modeling. Your statements on this are not supported by evidence.
If you have other sources please give them. Time permitting I will provide them for all numbers and statements above.
Scott A. Mandia, Professor of Physical Sciences
Selden, NY
Global Warming: Man or Myth?
My Global Warming Blog
Twitter: AGW_Prof
"Global Warming Fact of the Day" Facebook Group
As you point out, the highest global temperatures have been recorded during a low period in the solar cycle. What should concern everyone is the effects that more pronounced solar activity will have on global temps. Presumably Archibald thinks that the measurements provided by satellites such as GRACE are wrong?
Archibald’s claims of a cooling world really are at odds with empirical data and do little more than repeat assertions made by such luminaries as Lord Monckton and Ian Plimer. One wonders why they make claims which are so easily shown to be wrong?
(from Wikipedia)
I'm sure I don't need to remind you that sulfur dioxide is an aerosol, with relatively short residence time in the atmosphere, which reduces solar input to the surface, and has a cooling effect?
Roy Latham at 04:35 AM on 6 July, 2010
Am I misunderstanding your claim that ..Melting is basically irrelevant in Antarctica and important in Greenland .. If GRACE satellite measurements are to be believed, ice loss in the Antarctic, particularly from WAIS is not only significant but has the potential to be disastrous. WAIS, being a marine ice sheet is particularly vulnerable to attack from warm ocean currents causing large areas of ice resting on the seabed to float. Hardly irrelevant where rising sea-levels are concerned.
Roy, I think you have been taken in by some skeptic site as virtually all those statement are wrong. eg "The test of math models is whether they work reliably. Observed data is below the model error bounds, so the models are wrong. " Pardon? Doesn't fit with this. Perhaps you point us to papers that support your assertions?
“As you point out, the highest global temperatures have been recorded during a low period in the solar cycle.”
It has always been. The greater the change in to solar activity, the response (temperature) more remote in time. Take a look: http://upload.wikimedia.org/wikipedia/en/1/16/Sunspot-temperature-10000yr.svg, like circa 7400 BP - solar activity is very low. Temperature by EPICA Dome C - maximum. Delaying even a circa 800 years. But the last period (last millennium - less than 100 years).
Thank you for the reference. The point I was trying to make is that solar activity has been low for the past 40 years but is now showing signs of increasing. During that same period of solar quiescence, global temperatures have continued to rise and, as solar activity becomes more pronounced, we can expect global temperatures to rise even more rapidly than they have so far.
This should concern, particularly to those who believe that present measures to limit rise in temperature to 2C by 2100 will be effective. They will not, certainly not in Australia or North America where there is little concerted effort to reduce greenhouse gas emissions.
"solar activity has been low for the past 40 years but is now showing signs of increasing."
Are you speaking of some long-term solar cycle or the more familiar sunspot cycle? John has written on other threads that TSI is decreasing. This TSI graph from PMOD's 'Solar Constant' page supports that point.
The 11-12 year period is clearly shown; the '79 peak value seems the highest of the lot.
TSI is well-correlated with sunspot number, which has a much longer observation history. However, these short-term cycles are hardly a match for the global temperature trends, as shown below, from wikipedia.
While one can certainly see the early 20th-century temperature low in the long-term sunspot graph, the flat section (1950-1970's) in the temperature graph is a puzzler. I would love to see if a study including solar activity, atmospheric CO2 and another independent factor like atmospheric albedo (via sulphate/particulate emissions) sheds some light on that question. For example, if particulate levels rose between WW2 and the mid 70's, would that be enough to temporarily suppress the long term temperature trend?
He probably gets it from the widely disseminated misquoting of Phil Jones.
Dude, the man said that the evidence of global warming in the past decade wasn't statistically significant. Which means you cannot make the claim that global warming has progressed in that time frame.
The problem with the CO2 "problem" is that ALL of the rise since the 60s has to be due to CO2 or there is no MANMADE crisis. If a portion of the pre-1960s temperature rise mechanism is still in effect - and I can think of no reason why mechanisms effect for the last 10,000 years should suddenly stop with the introduction of the miniskirt - then 0.7 becomes 0.5. And if the correction bias has some validity, and it sure looks like it does (old get colder, new gets warmer, and more corrections are for warming than for cooling, regardless what NOAA claims), then 0.5 becomes 0.4 for CO2. But 0.4 for 45 years makes only 1 degree or so per century. That is not a disaster, and even if it were added on top of "natural" rises, the disaster as such would not be anything that cap-n-trade or some such restriction on fossil fuel consumption could fix.
The single villian for current climate warming is climate science's best hope for governmental green-policy implementation, but it is also its fundamental weakness. Any quarter given to "natural" forcings, or correction bias invalidates CO2's Joker-like villany. Gore, Suzuki and Hansen cannot discuss or argue the subject without leaving themselves open to admitting that natural and artefact issues have SOME bearing. Considering the +/- precision of the data, the "some" has to be significant when the temperature rise is so small. We declare War On Drugs when the Mafia or Cartels are behind what's on the street, not when it is some punk with a couple of plants hidden in his father's corn fields. If CO2 is not responsible for 90% of the claimed effect, then it is not a supervillian and CO2 suppression is not crisis-worthy. A reasonable, two-step back view, says that there is no man-responsible, CO2 based, catastrophic temperature rise. We live in a multvariant world; a single solution is simply a dream of the naive or agenda-driven.
As to correction bias, you must have missed this recent post here on Skeptical Science.