Climate Science Glossary

Term Lookup

Enter a term in the search box to find its definition.

Settings

Use the controls in the far right panel to increase or decrease the number of terms automatically displayed (or to completely turn that feature off).

Term Lookup

Settings


All IPCC definitions taken from Climate Change 2007: The Physical Science Basis. Working Group I Contribution to the Fourth Assessment Report of the Intergovernmental Panel on Climate Change, Annex I, Glossary, pp. 941-954. Cambridge University Press.

Home Arguments Software Resources Comments The Consensus Project Translations About Support

Twitter Facebook YouTube Mastodon MeWe

RSS Posts RSS Comments Email Subscribe


Climate's changed before
It's the sun
It's not bad
There is no consensus
It's cooling
Models are unreliable
Temp record is unreliable
Animals and plants can adapt
It hasn't warmed since 1998
Antarctica is gaining ice
View All Arguments...


Username
Password
New? Register here
Forgot your password?

Latest Posts

Archives

Hockey sticks, 'unprecedented warming' and past climate change

Posted on 15 December 2009 by John Cook

A continual theme expressed at Skeptical Science is one should take in the broader picture rather than focus on small pieces of the puzzle. There is a YouTube movie currently propogating through the blogosphere that purports to do this. Rather than narrowly focus on just the hockey stick of the last few thousand years, it examines temperature change in Central Greenland over the past 500,000 years. This shows that that there are periods where Greenland temperatures were warmer than today, including the Medieval Warm Period. If current temperatures are not unprecedented, how can we say global warming is not natural?


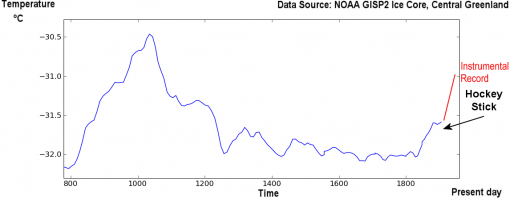
Figure 1: Temperature in Central Greenland over last 1200 years.

Now one could nitpick the analysis by pointing out that it focuses on one location in Central Greenland. Temperature at a single location inevitably show greater variation than the global average. While Greenland showed strong warmth 1000 years ago, global temperature during the Medieval Warm Period was less than today. But the broader argument is that climate change has happened naturally in the past. Global temperatures have changed dramatically - in particular during those periods when we emerged from world-wide ice ages. Looking back over the past 500,000 years, we see periods where temperature has warmed over 10°C and interglacial periods that were warmer than today.


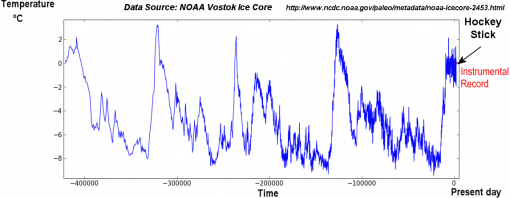
Figure 2: Temperature in Antarctica over last 450,000 years.

Many peer reviewed papers have studied these periods to glean a deeper understanding of climate. As climate scientist Dana Royer puts it: "the geologic record contains a treasure trove of 'alternative Earths' that allow scientists to study how the various components of the Earth system respond to a range of climatic forcings." The key result we obtain from examining past records is that climate is sensitive to changes in the planet's energy balance. When the planet accumulates heat, global temperatures rise, enhanced by net positive feedbacks. In the past, energy imbalance (or radiative forcing) have been imposed by a combination of forces: changes in the Earth's orbit, solar variations, volcanic activity and yes, natural changes in greenhouse gases.

Rising carbon dioxide in the atmosphere is currently causing a heat build-up. While there are various uncertainties in climate science, the radiative forcing from carbon dioxide is one factor that is known with high understanding and confirmed by empirical observations. How much warming can we expect from rising carbon dioxide? The temperature change is determined by climate sensitivity, which is determined from past periods. By comparing temperature change in past periods to the energy imbalance over that period, we can calculate climate sensitivity.

There are important lessons to be learnt from the past 500,000 years of temperature change. But the lesson is not that humans can't change climate. On the contrary, the past provides evidence for our climate's sensitivity to carbon dioxide.

For more detail on how past climate change tells us about climate sensitivity, see "Climate's changed before". Apologies to regular readers as this post revisits existing material - the inevitable consquence when forced to respond to rehashed skeptic arguments.

0 0

Printable Version  |  Link to this page

Comments

Comments 1 to 46:

  1. Watching the global warming debate back and forth is like watching a boxing match between two very good fighters. Punch, counterpunch. Back and forth. Fascinating.
    0 0
  2. "On the contrary, the past provides evidence for our climate's sensitivity to carbon dioxide. " That's kind of an irony around the arguments from "the climate has changed in the past" and "I want the MWP to be warmer than today so I can claim CO2 doesn't cause warming and warming isn't bad" folks. If climate was almost entirely static but greenhouse gas concentrations changed significantly, it would be evidence against their impacts. The larger temperature swings between glaciation periods helps to confirm the impact of greenhouse gases, and a more variable climate and stronger temperature swings over the last couple of millenium tends to imply greater climate sensitivity to any forcing mechanism, thus confirming positive feedbacks.
    0 0
  3. Looking at the graph in figure 2 it looks like we are imminent to enter a new ice age.
    0 0
  4. “Apologies to regular readers as this post revisits existing material - the inevitable consquence when forced to respond to rehashed skeptic arguments.” Indeed. There was a nice piece from Ben Goldacre in The Guardian this weekend about the prevalence of ‘zombie arguments’ amongst AGW denialists, a ‘zombie arguments’ being “arguments which survive to be raised again, for eternity, no matter how many times they are shot down.” http://www.guardian.co.uk/commentisfree/2009/dec/12/bad-science-goldacre-climate-change Congratulations on your excellent blog by the way.
    0 0
  5. Since you are bringing CO2 up again, I now actually have a question. There is a concept called free space path loss that is key to radio transmission. A simple formula describes this as loss = 20log(4*Pi*distance/lamda). As some have accused me of paper napkin numerology, you can apply this formula using a spreadsheet and easily see that the power drops off very fast, (which is why people have to pay good money for broadcasting radio and television signals). IR is electromagnetic radiation too and I assume is subject to this same phenomenon (i.e. signal dispersion which you notice by just backing your hand away from the ground on a hot day.). Anyway, I was wondering if someone knows whether this effect has been taken into account when modeling the impact of global warming on the Earth from gases at 10, 100, 1000 meters, the idea being that less and less energy would be reaching these parts and conversely, the higher the gas, the less its going to warm the Earths surface, etc.... PS. As I edit this comment, I am having a dejavu, so please excuse me if I actually already wrote this.
    0 0
  6. A small note: the text under figure 2 says Greenland, but the figure is from Antarctica. Not that it matters for the argument presented in the article, but anyway. Moreover, I have a general argument regarding the MWP, on which I would be happy for feedback. The thing is, I do not see how the size and coverage of the MWP affects the significance of the AGW-theory of today. Even if the MWP was shown to be a global phenomenon and much warmer than today, its causal origin need not be the same as the causal origins of today's temperature trend. What we see between 1970 and 2000 is a temperature trend that cannot yet be explained without including anthropogenic CO2 in the model. Before a suitable alternative explanation is found and supported by evidence, we are in no position to rule out the CO2-hypothesis, no matter how temperature varied in the past. If the MWP was indeed warmer it is possible that what caused it causes warming today. But unless we show what caused it, we cannot just assume that the same forcings are at play today. "Natural variability" is not an argument either, temperature does not change spontaneously - the laws of thermodynamics ensures that. My opinion is that a theory of climate using the MWP as a part of the argument needs both to address the causal origins of the MWP and to show the relevance of the same causal mechanism in today's climate. In such an argument, the peak amplitude of the MWP temperature is not as important as to what extent the suggested forcings can be shown to explain the general temperature curve.
    0 0
    Response: Have corrected the caption of Figure 2, thanks for the tip.
  7. Figure 1 is pretty misleading - Inspection of Alley's data in the NCDC archive [*] shows that the most recent temperature data point for the GISP 2 core is for around 100 years before 2000. According to the temperature reconstruction from the ice sheet this temperature was -31.6 oC. In the intervening period, the Greenland ice sheet temperature (2 metre surface height) has risen by around 1.5 oC, averaged over the whole ice sheet [**]. It’s likely that the ice sheet summit area where GISP 2 is, has warmed more than this (NASA GISS analysis puts the warming at the Grenland summit where the GISP 2 core was drilled to more than 2 oC [***] So if we are comparing like with like [i.e. the temperature at the Greenland ice sheet summit at GISP 2 at the “height” of the MWP (-30.5 oC), and the temperature at the Greenland ice sheet summit at GISP 2 at the turn of the 20th century (-31.6 oC), we should really consider the temperature change since then at the same location. This is at least 1.5 oC warmer and likely at least 2 oC warmer. So current temperatures at the Greenland summit at the GISP 2 site are warmer than for the height of the MWP (by 0.5 to 1.0 oC or more) according to the Alley’s data, and taking account of the temperature record of the last 100 years. [*] ftp://ftp.ncdc.noaa.gov/pub/data/...gisp2_temp_accum_alley2000.txt [**] Box JE et al. (2009) Greenland Ice Sheet Surface Air Temperature Variability: 1840-2007 J. Climate 22, 4029-4049 [***] http://data.giss.nasa.gov/gistemp/maps/ (make your own map – e.g. compare the current (5 year temperature average to the 5 year temperature average around the start of the 20th century)
    0 0
  8. Thanks for posting that, Chris. I see that Watts or whoever was responsible for that graph penciled in a small red line labeled "instrumental record" showing about an 0.5C warming from 1900 to the late 20th C. But you rightly note that adding the actual data would show current temperatures off the top of the chart. I won't hold my breath waiting for Watts to make that correction, however.
    0 0
  9. Looking at Figure 2 makes me wonder if any scientist has been able to make a computer model to reproduce this “near” periodical cycling between -8 and current temperatures in the past thousand years scale. Those supporting anthropogenic global warming say that solar activity is stable over the years, so these major temperature changes can depend mostly on earth’s axial tilt than any other factor. If a computer model is able to reproduce and verify all these past temperatures, then it would have chances to predict future climate as well. On the other hand, the skeptical argument says that coming out of the ice age into interglacial there is a delay of hundreds of years after which CO2 rises. They argue that CO2 is a product of temperature rise (maybe with some feedback effect) and not the primary cause of the temperature rise. Is it only me feeling I should enjoy the last years of interglacial before going into the next ice age?
    0 0
    Response: We address the CO2 lags temperature argument here. Basically, warming causes CO2 outgassing from oceans. However, this doesn't mean CO2 doesn't cause warming - this is proven by a laboratory measurements plus empirical observations of an enhanced greenhouse effect. When you combine the two effects - warming causes CO2 rise and CO2 rise causes warming - you get a positive feedback system which enabled our planet to come out of a global ice age.
  10. What should also be mentioned is that the graphs compare the global temperature record with a local record. I think that region in Greenland is more sensitive to changes and has warmed more than the global average, so the comparison is not valid.
    0 0
  11. Livas, analysis of the Milankovitch cycles that underlie the transitions from glacial to interglacial periods and back again, indicates that the present interglacial will likely be very long lived in the context of the last several cycles (e.g. around another 50,000 years of interglacial to go before the next descent into a glacial maximum) e.g. A. Berger and M. F. Loutre (2002) An Exceptionally Long Interglacial Ahead? Science 297, 1287-1288 http://www.sciencemag.org/cgi/content/short/297/5585/1287 On the lead/lag phenomenon of CO2/temperature. There's no question that temperature changes during ice age cycles lead CO2 changes by a few hundred years (at least in the Antarctic cores; the CO2 changes lead temperature changes in Greenland ice cores). The CO2 rises (during insolation-driven glacial to interglacial transitions) amplify the primary warming resulting from insolation-driven ice melt/albedo contributions and water vapour feedbacks. One can get a handle on the amount of atmospheric CO2 that results from glacial-interglacial transitions. The atmospheric CO2 levels rise pretty faithfully during the slow, 5000-year, glacial-interglacial transitions from around 190ish ppm to 280ish ppm (and back to 190ish ppm in the following descent to glacial conditions: http://en.wikipedia.org/wiki/Ice_age This is in response to a global temperature change near 5-6 oC. So each oC of warming produces around 15-18 ppm of raised CO2 levels (90 ppm rise resulting from 5-6 oC rise). Obviously the massive rise in CO2 from preindustrial levels (280ish ppm) to now (386 ppm and rising) can't have resulted from a temperature rise, since we've only had around 1 oC of this since pre-industrial times.
    0 0
  12. Chris, you have put it very well. For every 1oC rise in temperature we observe as a result an additional 15-18ppm of CO2 levels. Of course, this does not mean the opposite direction. 15-18ppm rise of CO2 levels do not necessary means that it will produce a 1oC rise in temperature, which is about what the anthropogenic global warming supporters claim. Not, if you ignore the fact that the other 95% of global warming factor which is water vapor will likely remain at the same levels. Not, if scientists, as I hear, have not concluded to the basic physics behind the relation of water vapor, cloud formation from water vapor and the effect of clouds in global warming.
    0 0
    Response: "15-18ppm rise of CO2 levels do not necessary means that it will produce a 1oC rise in temperature, which is about what the anthropogenic global warming supporters claim"

    What the peer reviewed science finds is that a doubling of CO2 leads to 3°C warming. Eg - if we move from the pre-industrial levels of around 280 parts per million (ppm) of atmospheric CO2 to 560 ppm, the CO2 forcing would cause 3°C warming. We're currently at around 385ppm.

    For more on water vapor and how it enhances CO2 warming, see water vapor is the most powerful greenhouse gas.
  13. re #12 (i) No one claims that 15-18 ppm rise will produce a 1oC rise in temperature, livas. Taking the central value of the likely range of climate sensitivities of 3 oC (the temperature rise from doubling atmospheric CO2) the equilibrium temperature rise is expected to be: Temp rise = ln([CO2]2/[CO2]1)*3/ln2 where [CO2]1 is the starting [CO2] level, [CO2]2 is the end [CO2] level, 3 is the climate sensitivity and ln2 refers to the doubling. (ii) Note that water vapour doesn't remain at the same level. The water vapour concentration in the atmosphere rises as the atmospheric temperature rises. So water vapor provides a positive feedback to whatever forcing increases the atmospheric temperature.
    0 0
  14. It would be nice to have a collection of properly calibrated temperature series from cores in one easily accessible post. As chris points out, the 'instrumental record' part of fig 1 is probably misleading. Maybe not the most rewarding task, but I fear WUWT and likes will bring up this again. And again and again and again. I think it would also be worthwhile to go more into the orbit/precession/nutation material, to give better understanding of the forces at work - AND - the sensitivity.. Apropos sensitivity: Who is quite sure that a 3 deg sensitivity at the doubling from 140 to 280 ppm necessarily implies a 3 deg sensitivity at the next doubling, to 560 ppm? I'm not :-)
    0 0
  15. You can point at skeptics regurgitating the MWP/Hockey stick arguement over and over again but it shouldn't be forgotten that it was warmers who really shot this to fame. Al Gore and the IPCC 2001 made sure this would be at the centre of the climate change debate. Critisism of this science has moved from marginal skeptic websites into peer reviewed literature. You could look at the Nature blog as a jumpimg off point. For this reason I think it's wrong for John to dismiss all this as "the inevitable consquence when forced to respond to rehashed skeptic arguments." As John mentioned, in a previous post, Mann has refined his arguement this year to suggest that MWP was a regional phenomenon. It will be interesting to see if this new version can stand up to inspection. You could view all this as the normal process of a developing science but we shouldn't forget this particular bit of science has been seriously affected by it's collision with politics.
    0 0
    Response: The regurgitation was refering to the use of the Climate's Changed Before argument. The YouTube movie doesn't look to dispel the hockey stick - but demonstrate that over longer periods, there have been even greater changes in climate. I've yet to encounter any peer reviewed science claiming that past climate change means that climate is not sensitive to the radiative forcing currently being imposed by rising carbon dioxide.
  16. SNRatio, the 3 degrees per doubling concentration holds as long as the simple logarithmic approximation holds. For exaple, the IPCC TAR quote three different aproximations for the forcing. You get 3.71 W/m2, 3.98 W/m2 and 3.97 W/m2 respectively for doubling from 280 to 560 ppm. If you double from 140 to 280 you get the same 3.71 W/m2 (obviously), 3.8 W/m2 and 3.45 W/m2 respectively.
    0 0
  17. re #15 No one is that concerned about "regurgitating hockey stick arguments" HR. It's unfortunate that this isn't always done honestly and with a bit of scientific rigour (although one shouldn't have great expectations about the more dismal corners of the blogosphere!). After all the large amount of aditional paleoproxy data since the original "hockey stick" has pretty consistently supported the initial conclusions of that study concerning the anomalous nature of late 20th century warming. Alley's analysis of GISP 2 temperature proxy data for the Greenland ice sheet is also consistent with the "hockey stick" as originally presented. It's unfortunate that some blogger has made a false representation of the warming at the Greenland ice sheet surface during the last 100 years (see my post #7 above), but again, there does seem to be a concerted effort to misrepresent the science on climate-related matters. Your comments about "criticism of the science...moved....into peer reviewed literature" isn't really correct (of course all science has an essential critical element); a Nature blog simply isn't "peer reviewed science" HR! You're also incorrect in your assertion that "Mann has refined his arguement this year to suggest that MWP was a regional phenomenon". Mann has presented evidence for a regionality of the MWP for many years (as have many other scientists). That's simply what the evidence indicates, and there are many studies in the peer reviewed literature that indictaes that the MWP was represented predominantly in the high Northern latitudes and was spatially and temporally non-homogeneous elsewhere. See, for example, the following papers [*] that discuss evidence for the regionality of the MWP in comparison with the global scale nature of late-20th century and contemporary warming. This is a conclusion that has been around for quite a while....it's certainly not a "new version". You're right that "this particular bit of science has been seriously affected by its collision with politics". How true. But why not focus on the science and treat the political nonsense on the blogosphere with the disdain it deserves? [*] PD Jones and ME Mann (2004) Climate over past millennia Reviews of geophysics 42, RG2002 T. J. Crowley and T.S. Lowery (2000) How Warm Was the Medieval Warm Period? AMBIO: A Journal of the Human Environment 29(1):51-54 Bradley, R.S., Hughes, M.K., Diaz, H.F. (2003) Climate in medieval time Science 302, 404–405 Osborn TJ, Briffa KR (2006) The spatial extent of 20th-century warmth in the context of the past 1200 years Science 311, 841-844 H. Wanner et al. (2007) Mid- to Late Holocene climate change: an overview Quaternary Science Reviews 27 (2008) 1791–1828 etc. etc.
    0 0
  18. On the graph of Vostok Ice Core data above, the temperature peaks around +3, +2, and +4 degrees. How could any ice have survived these peaks?
    0 0
  19. They're not absolute temperatures RSVP. Obviously the top of the Antarctic ice sheet at Vostock isn't at a temperature anywhere near positive values! I think the temperatures are actually temperature differences between then and current temperatures, and the temperature difference may correspond to the air temperature in the atmosphere where the precipitation forms, since the temperatures are based on isotopic fractionation. It would be helpful if this was more carefully specified in graphs, although it obviously is in the scientific papers from which the graphs are derived. The warmer last interglacial is associated with much greater ice melt than now; the evidence indicates that sea levels were 4-6 metres higher then, than now...I believe there is some uncertainty about exactly how warm the previous interglacials actually were.
    0 0
  20. Riccardo - Surely a linear function of ln(x) is a linear function of ln(x) for as long as you want - and then some. But - to mention just one thing: There is considerable overlap between IR absorption spectra of CO2 and H2O. Which may imply that changes in CO2 absorption with concentration is not independent of H2O, and the very idea of feedback f>0 is that other things, H2O vapor not the least, change with CO2. The whole thing could just add up to sensitivity increasing with CO2 (within bounds, of course), or it could decrease. Forcing-wise, we seem to be in a unprecedented situation now, so we can't just compare and apply.
    0 0
  21. Question....based on SNRatios post 20.....I would expect a differential in IR absorption between WV & CO2, based on concentration, sure, but also on assymetry - WV molecule having more ways that the bonds can be stressed. So the question is, in a given sample of air where the number of CO2 molecules is equal to the number of WV molecules, and there is insufficient IR to affect all the molecules -is there preferential absorption by WV? Apologies if the question is badly worded.
    0 0
  22. PS: or is it just a question of which molecule gets 'hit' first?
    0 0
  23. John - I think there's another implication to the way skeptics use the "climate's changed in the past" argument. It's not just that "climate changes naturally, so humans aren't causing it" - it's also like, "climate's changed much more in the past, so it's nothing to worry about. Life goes on." My usual response is that, "yes, we've had ice ages and warm periods in the past, but what's important is the rate of change going on now," but I was hoping you could elaborate more on the implications of past climate change. e.g., just because climate's changed in the past doesn't mean it's nothing to worry about.
    0 0
  24. re #21 It depends on a lot of things. Obviously it depends on the wavelength - you are really only talking about wavelengths where the CO2 and water vapour absorption bands overlap. In such a case the relative absorption is chracterised by the (wavelength-specific) absorption coefficient. Water vapour does have a stronger absorption than CO2 over the range of longwave IR wavelengths/frequencies relevant to the greenhouse effect (the wavelengths/frequencies appropriate for surface heat dissipation to space). All of that is "accounted for" in analysis of the greenhouse effect and the effect of raising greenhouse gas levels.
    0 0
  25. Mizimi @21 H2O and CO2 have the same number of IR active vibrations - 3. An absorption band at a given frequency is due to a specific vibration. For example the 650cm-1 CO2 absorption is due to the (doubly degenerate) bending mode. So more asymmetry in a molecule does not mean more absorption at a given wavelength. It usually means more wavelengths at which it absorbs. However asymmetry will complicate the rotational-fine structure of a particular IR absorption, however H2O's rotational fine structure will be quite dispersed because of its light mass (18 compared to CO2's 44)
    0 0
  26. Chris #17 I agree the Nature blog isn't peer reviewed I did suggest it as a jumping off point because it does give a view of the development of the hockey stick idea as well as linking to some peer reviewed papers that questioned the science. I can accept that Mann didn't stumble on the MWP as a regional phenomenon in 2009 but I'd question the validity of the papers you present Crowley 2000 - The main conclusion of this paper is that the MWP can't be described as warmer than 20th century. It describes MWP as occuring in the NH only because it recognises insufficient data in the SH. You can't say something is regional just because you don't have data for the other regions. Bradley 2003 - Again this paper bemoans the lack of records in the tropics and SH. Concludes that evidence of a MWP is safest in Europe. Again MWP as a regional phenomenon can't be deduced due to the poor spread of data. Jones 2004 - "Regional conclusions, particularly for the Southern Hemisphere and parts of the tropics where high-resolution proxy data are sparse, are more circumspect." Osborn 2006 - This states it is an analysis of the NH. It is impossible to draw conclusion on SH. They are generally working with averaged data from 14 proxys and make no attempt to define spatial variation. Based on averaged data they find evidence of a MWP. Wanner 2007 - I don't fully follow this 38 page blockbuster again I'll stick to one quote to prove my point. "It is still an open question whether the MWP–LIA transition was caused by external forcing, and its spatial extent is still not entirely clear" It appears the MWP is a northern Hemisphere phenomenon only because we have data for the NH. It is funny that with essentially the same data sets Mann in 2009 can draw such definitive maps of the globes temperature 1200 years ago. It should be remembered he is still working with only a handful of proxy data sets in the tropics and whole of the southern hemisphere. I assume he uses modelling to fill in the huge gaps. Mann's desire for certainty in his work is his shortcoming.
    0 0
  27. "a positive feedback system which enabled our planet to come out of a global ice age." If CO2 can make the planet come out from an ice age isn't it also a plausible idea that CO2 can prevent the planet from entering an ice age as well?
    0 0
  28. batsvensson @ 27: I think that it sounds pretty plausible to me. But what happens if we aren't heading into an ice age, and we throw that additional forcing on top? That seems to be the issue at present. WAG @ 23: a colleague of mine summed it up nicely. There have been climate changes in the past, many were quite large. The difference is that we weren't around to see them. 'We' being 'human civilisation' - there were hunter-gatherers around at the end of the last ice age, but the entire development of human civilisation has taken place in a relative stable period of climate history.
    0 0
  29. SNRatio, you can't be so generic about band overlap. For example, the main contribution to CO2 absorbtion in the atmosphere is at about 600 cm-1 where there's no overlap with water vapour; other bands do overlap and there there's almost no contribution by an increase in CO2 concentration. For this reason CO2 absorption is essentially independent on H2O concentration. This was about forcing and the reason why it is more or less logarithmic. Then comes feedbacks and climate sensitivity, but it's a completeley different story.
    0 0
  30. #29 Riccardo It IS about sensitivity, at least I think so! :-) My initial question was whether a 3 deg sensitivity at the 280-560 ppm doubling would imply the same sensitivity at the next doubling. This is not irrelevant for the current theme: If, for instance, sensitivity falls with increasing ln(CO2), CO2 may actually have played a bigger role in the climate variations of the reconstruction period than assumed - CO2 was, most of the time, lower than now. It is also a question of how to define 'sensititity'. Some model runs indicate that 100 year sensitivity may be only about half of equilibrium sensitivity, which may take several hundred years to reach. It's not quite implausible that the more radiative overlap, the longer the system may take to reach equilibrium. And the relevant indicator here is the observed radiation balances, not the expected. And because the H2O/CO2 ratio varies so much spatially and temporally, I think it may be hard to make good estimates of the net effects of overlapping. Making too simplistic assumptions can lead us very far astray.
    0 0
  31. #27 batsvensson "If CO2 can make the planet come out from an ice age isn't it also a plausible idea that CO2 can prevent the planet from entering an ice age as well? " Sure. And we may already be past that point, relative to the variations of the other factors during the last 500000 years. With values in the upper tail of the current estimated probability density function for CO2 sensitivity, we probably are.
    0 0
  32. Batsvensson writes: "If CO2 can make the planet come out from an ice age isn't it also a plausible idea that CO2 can prevent the planet from entering an ice age as well? " As far as I understand it, there's a lot of disagreement as to the probable timing of the next glacial cycle in the absence of human intervention. Most people (but not all) now think that the current interglacial would have been longer than the Eemian (basically, cooling over the past millennia would have dipped towards the tipping point for initiation of a new glacial cycle, but probably not gotten cold enough). The next tipping point comes in ca. 50,000 years from now, when the Milankovich forcing almost certainly would be sufficient to start glaciation. Depending on how much CO2 we emit over the next 200 years, it's entirely possible that there will still be enough in the atmosphere to prevent the next glacial cycle from starting 50,000 years from now. That's a pretty astonishing thought, IMHO. See Clausen et al (2004), Did Humankind Prevent a Holocene Glaciation? Climatic Change, 69: 409-417. Not everyone agrees, however. I haven't discussed this with them, but my former colleagues Steve Vavrus and John Kutzbach have a paper out (coauthored with Bill Ruddiman) which allegedly confirms Ruddiman's hypothesis that we would already have started a glacial cycle if it weren't for the initiation of agriculture several millennia ago: Vavrus et al., 2008, "Climate model tests of the anthropogenic influence on greenhouse-induced climate change: the role of early human agriculture, industrialization, and vegetation feedbacks" Quaternary Science Reviews, 27: 1410-1425.
    0 0
  33. SNRatio, this is where it all started in #14: "Apropos sensitivity: Who is quite sure that a 3 deg sensitivity at the doubling from 140 to 280 ppm necessarily implies a 3 deg sensitivity at the next doubling, to 560 ppm? I'm not :-)" Here you are linking sensitivity and temperature. It's correct, they are by DT=lambda*DF. So the issue is wether the forcing is logarithmic or not. If it is, whenever CO2 concentration happens to double, you'll get 3 °C. Now, maybe I misunderstood your question. Are you asking if climate sensitivity can be assumed constant? Then in #20 you mention absorption band overlap. In my mind sensitivy is defined by the relation above. Then overlap has nothing to do with climate sensitivity but, eventually, with the forcing. This is the rationale of my comment #29. CO2 forcing does not depends on overlap, it's already considered. Maybe I misunderstood again or maybe we call sensitivity two different things. In #30 you explicitly say that "100 year sensitivity may be only about half of equilibrium sensitivity". This sensitivity can not be used to compare different time span or different situations; for example, even keeping everything else constant the next 100 years you'll get a lower "sensitivity", given that the process of reaching equilibrium is not linear. So, you can use this different definition of sensitivity just for inter-model comparison ot to compare them with reality in the very same situation and time span.
    0 0
  34. Re #26 HumanityRules, I was highlighting the fact that the evidence of a non-spatially homogeneous MWP, has been around for some time, and is not the recent proposal of Mann thst you suggested. I don’t disagree that there is limited S. hemisphere proxy temperature data. However, there’s rather a lot of data that supports the interpretation of a non-homogeneous MWP (temporally and spatially) either focussing on the N. hemisphere (see papers in my post above), or considering less quantitative paleoproxy data from the S. hemisphere and central latitudes. So, for example, data from Pacific corals indicate that the tropical Pacific was cool during the period of the high N. latitude MWP: Kim M. Cobb et al. (2003) El Niño/Southern Oscillation and tropical Pacific climate during the last millennium Nature 424, 271-276 And this data has recently been extended through the 20th century, to pin the paleoproxy data to the 20th century temperature record Nurhati IS et al. (2009) Late 20th century warming and freshening in the central tropical Pacific Geophys. Res. Lett. 36 Art # L21606 Temperature records from the mid-latitudes (Tibet) and S. hemisphere (Tropics; Andes) shows either an insignificant warming during the period of the high N. hemisphere MWP (tropics and Tibet) or a small warming that is non-synchronous with the N. hemisphere MWP (Andes; it lags by ~200 years) L.G. Thompson et al. (2006) Abrupt tropical climate change: past and present Proc. Natl. Acad. Sci. 103 10536–10543 Likewise analysis of S. hemisphere glacier advance (New Zealand) indicates that the N. hemisphere and S. hemisphere warming at the time of the MWP was temporally asynchronous: J. M. Schaefer et al. (2009) High-Frequency Holocene Glacier Fluctuations in New Zealand Differ from the Northern Signature Science 324, 622-625 Likewise, analysis of paleoproxy data from S. America has indicated non spatially coherent warming and little overall warming in the region compared to MWP in Europe R. Villalba, 1990 Climatic fluctuations in northern Patagonia during the last 1000 years as inferred from tree-ring records Quaternary Research 34 (1990), pp. 346–360 Recently reviewed: J.A. Boninsegna et al. (2009) Dendroclimatological reconstructions in South America: A review Palaeogeography, Palaeoclimatology, Palaeoecology 281, 210-228 and so on… Now one may quibble about the limited “quantitative“ paleoproxy data from the Southern hemisphere. However there is rather significant evidence that the Pacific was displaying La Nina like conditions during the period of the warm high latitude N. hemisphere MWP signature, and that Southern hemisphere and mid-latitude glaciers were not responding in a manner consistent with warming during the period of warming in the high Northern latitudes. This is quite different for the spatially-and temporally homogenous nature of 20th century warming. This evidence has been around for a long time…the recent data tends to reinforce this interpretation.
    0 0
  35. "Here you are linking sensitivity and temperature. It's correct, they are by DT=lambda*DF. So the issue is wether the forcing is logarithmic or not. If it is, whenever CO2 concentration happens to double, you'll get 3 °C." I don't see the situation that way. While we can be pretty sure that the forcing is approximately logarithmic at the current levels of CO2, our 3 °C estimate for sensitivity is the estimated mean of an unknown pdf with quite big variance. Furthermore, there is a very long adaptation time, so it can't be safely estimated even 20 years after forcings have changed. Several 'proofs' of low sensitivity are based on such short time observations. The basic, zero-feedback forcing of ca 1.0 °C/doubling of CO2 is usually derived under the assumption of independence from other GHGs - as far as I can see. If we use Chris Colose's http://chriscolose.wordpress.com/2009/10/08/re-visiting-cff/ presentation, we have dT0 = k * ln(2) * lambda_Planck. lambda_Planck is the reciprocal of the partial derivative of Stefan-Boltzmann wrt temperature, with approx numerical value of 0.27, an often used approximation of k is 5.35, and it all multiplies to approximately 1. Different degees of overlap with H2O could influence the sensitivity.
    0 0
  36. In addition to the papers Chris cites in #17 and #34, there is Mann et al.s most recent (Sept 2008) PNAS paper on the proxy reconstructions over the past 2000 years: www.pnas.org/cgi/doi/10.1073/pnas.0805721105, which brings together the work on S hemisphere as well as N. And concludes that the MWP was a variable phenomenum and was at a lower temperature than current. This was indicated as likely by the National Academy of Sciences review in 2006, as well as by the IPPC AR4. NAS reckoned more data was needed, which the paper provides. McKitrick et al. still try to show otherwise (of course) but Mann rebuts their criticism in PNAS 2009.
    0 0
  37. SNRatio, I still can't see your points but the last sentence. I agree the the 3°C for doubling CO2 have a large uncertainties, we can take it for granted. I also agree that the zero feedback sensitivity is much lower than the "true" sensitivity, roughly 0.3 °C/Wm^-2 against 0.8 °C/Wm^-2. But then comes the last sentence that appers to be uncorrelated with the reasoning above. The "degree of overlap" does not change with H2O concentration, it is due to the basic properties of the individual molecules. For example, the well know 600 cm-1 CO2 band will never overlap with H2O bands in any plausible atmosphere; and where there's already overlap it won't change if we increase CO2 and H2O concentrations. Consider also that the radiative transfer codes takes into account all of these, concentration of all the consituents, absorption band frequency, band width, dependence on temperature and pressure and, finally, superimposition of the absorption bands. I think that the only point scientifically valid is the "true" value of the sensitivity, trying to constrain it as much as possible; i.e. lower the uncertainty.
    0 0
  38. Ian Love, "NAS reckoned more data was needed, which the paper provides." acutually it is a never-ending story, scientists always need more data :)
    0 0
  39. @SNRatio #31, Says who? And would you mind be more specific on what you mean with "other factors" and what numerical data is the solution of the probability density function you refer to based on? - - - @Ned #32, Thanks for an informative answer. It is really a mind boggling thought that raised CO2 level today could have an effects 50 thousand year ahead in time. But according to this hypothesis, woudl you know how much extra CO2 would then be needed in the atmosphere today to prevent the next glacial cycle to be triggered? One thing I note with the cure is that the noise in the plotted line increase with growing time. The first part shows a very smooth line while the last is very smeared or "noisy". If the curve was taken to be factual measurement, a signal analyst would directly observer that the signal to noise ration is increasing by time. The signal would then be regarded as the low frequencies component of the plot. If we interpret the "signal" as "climate variations" and the "noise" as "weather variation", then the curves makes perfect sense: it follows that the curve should be more noisy with increased time as this shows our ability to track weather as well. In order to get a better understanding of variations in the past error bars may be very useful tools in the analysis because they would not only show the uncertainty in signal level but also indicate the possible variability of the noise. However we are not talking weather but climate, so the interesting question with this graph is: is there anything in this particular graph, taken out of any context of other research, that suggest the signal has changed? - - - @Bern #28, you are not addressing the question but asking another one, a "what-if" question and proposing we do something based on that. Another what-if question with an action is, "What if Al Gores ears causes global warming? Perhaps we should cut them off just to be sure..." Clearly, this is a potential very dangerous method of answering questions and proposing solutions. Using fear to aid decision and action will maybe not do harm, but it is also equal reasonable to assume that one may do harm as often when no harm would had been done else.
    0 0
  40. re #26 HR, I’m curious about your statement re Mann: “Mann's desire for certainty in his work is his shortcoming.” Especially in relation to this comment you made earlier in the thread: “…we shouldn't forget this particular bit of science has been seriously affected by it's collision with politics.” Well I wouldn’t say that the science has been affected, although there’s been a rather persistent effort to create a false perception of the science. Let’s have a look: Mann’s original millennial paleoproxy reconstruction was published in a paper entitled: Mann ME et al. (1999) Northern hemisphere temperatures during the past millennium: Inferences, uncertainties, and limitations Geophys. Res. Lett. 26, 759-762 which doesn’t sound to me like “a desire for certainty”, and Mann’s analyses have consistently addressed the uncertainties in the data and its interpretations. On the other hand, Mann might have every right to have confidence in his analyses. He’s made a series of strong contributions to paleoanalysis of climate-related indices (the paper above has more than 600 citations), and has seen his analyses supported and validated by subsequent studies, despite a pretty dismal and rather pathetic effort to undermine his work. Considering the MWP, one can examine the set of paleoproxy reconstructions that extend back to that period and see that essentially all of these find an MWP that is close to the temperature of the original Mann et al reconstruction (Moberg's "highly variable” temperature reconstruction, puts the NH MWP perhaps 0.2 oC warmer than Mann's; that's a fairly trivial difference, and of course we don't know whether this is any more or less correct than Mann's analysis). Your comment on “politicisation” of this issue is highlighted by contrast with another scientist, this one a darling of the scientific misprepresenters. His presentation of his methodology was launched with a robust assertion of certainty: Spencer RW and Christy JR (1990) Precise monitoring of global temperature trends from satellites Science 247, 1558-1562 And despite the fact that the methodology was early shown to be anything but “precise”, and that the practitioners made ae extended series of errors indicating (at best) a less then competent relationship with their data, resulting eventually (15 years later) in an embarrassing climb down [see Christy JR, Spencer RW (2005) "Correcting temperature data sets", Science 310, 972-3; and comments by Mears, Wentz and Sherwood, Lanzante], the scientist (Spencer) is considered to be one of the luminaries of the anti-science movement. The difference between the way that these two scientists are treated in some quarters is really where the politicisation of this subject lies
    0 0
  41. "Now one could nitpick the analysis by pointing out that it focuses on one location in Central Greenland. Temperature at a single location inevitably show greater variation than the global average. "
    Aren't the long time scale proxies necessarily spotty? I am trying to learn as much as possible, and let me state my position before asking questions. I believe CO2 is a good prima facie argument for observed warming. I am not strong enough in science to judge between many seemingly convincing arguments (more on that later), but I do believe we need to be seriously thinking about it. I think we need to look at all of mitigation, adaptation, and possible counter climate engineering. We also need to get statisticians and economists involved in these debates as well - cross discipline review and hard analysis will help, not hurt. The scene at Copenhagen was very disappointing for anyone who cares about environment - it looked from here like a mixture of magical thinking and silly UN politics. I also am deeply suspicious of cap and trade - it looks more like a way for scam artists to get rich than a way to really make a change. That said, I am trying to learn as much as possible about the science. It is fascinating to me. I have just watched (twice) a lecture by Dr Richard B Alley that opened my eyes about CO2 a bit. The compliment to him is that a laymen can get a lot from his talk. http://www.agu.org/meetings/fm09/lectures/lecture_videos/A23A.shtml He discusses several CO2 proxies but mentions that the Antarctic ice is the gold standard for reconstruction. He mentions some glitchiness in Greenland ice. Also at points he alludes to certain temperature records being uncertain due to locality. I have two questions: 1. How well spread out are the proxy records for temperature and CO2? Is there a chart that shows what proxies are available for each time scale? 2. How well do proxies agree, and what statistical methods are used to resolve them to the one line graphs I see in so many presentations? That is, what is the error margin when extrapolating global averages from them? For example this graph apparently shows various NH proxies. They seem to vary quite a bit to me. http://physicist.org/history/climate/images/ipcc_6_10_sm.jpg What I am driving at is that these are northern hemisphere, but I don't see a similar SH. How do we know what the global temp was and with what accuracy? We seem to are talking about a degree or two or less over a thousand year period.
    0 0
  42. The same as Chris said: WWT has added the global temperature record (0,6ºC), but Greenland has experienced much more warming than the global average. These two reconstructions clearly show a warming of more than 1 ºC, therefore, temperatures in Greenland are probably warmer now than they were in the MWP (in spite of the fact that the MWP was mainly focused on the North Atlantinc around Greenland): FIG. 11. Greenland ice sheet land station record annual temperature anomalies with respect to the 1951–80 base period. Multiples of standard deviations for the 1951–80 period are included. Major volcanic eruptions are indicated Source: Greenland Ice Sheet Surface Air Temperature Variability: 1840–2007 (full pdf, PPT) Jason E. Box, Lei Yang, David H. Bromwich y Le-Sheng Bai Journal of Climate, Volume 22, Issue 14 (July 2009) Fig. 2. (a) Mean annual temperature (TMA) difference averaged over ice-sheet area, assembled from two datasets: ECMWF re-analyses (blue) and BOX (red) Source: Surface mass-balance changes of the Greenland ice sheet since 1866 (full pdf) Wake et al 2009 Annals of glaciology., 50 (50). pp. 178-184 It is curious that much of the warming there took place at the begining of the century (though anomalies are now greater). It seems that there is great variability there, probably related to the Arctic amplification.
    0 0
  43. I have a few relevant points to add here. On my reading of Jared Diamond's book "Collapse" (highly recommended read I might add), there are 3 civilizations whose collapse is consistent with a warming period between the 7th & 14th C AD. The Khmer Empire, the Mayans & the Anasazi all declined/collapsed around the same time, & all the Paleo-climatic data from the respective areas (especially sediment cores from lake beds & coastal regions) show that there was definitely a warming event which triggered/accelerated the decline of these civilizations. So we do have fairly reasonable evidence of warming-induced collapses of civilizations from the low N. Hemisphere & Tropical S. Hemisphere. What is interesting, though, is this-the warming events are believed to have been on the order of +0.5 to +0.8 degrees, but occurred over a period of almost *seven hundred years*. Secondly, solar activity proxies for that time period (Be-10 & C-14) suggest a surge in solar activity not unlike what we saw during the 19th & early 20th centuries. So this again leaves us with the fact that the current warming period is *faster* than any other in the last 2000 years (at least), & is the only one not underpinned by changes in the heliosphere.
    0 0
  44. is the following statement true - "The essence of the error (fraud) is in claiming some radiation goes around the center of absorption peaks for CO2 but gets picked up on the shoulders of the peaks. Even the shoulders absorb in such a short distance that increasing the CO2 only shortens a short distance. Cooling of the planet is caused by long wave infrared radiation which goes around the shoulders as well as the peaks." from - http://www.nov55.com/gbwm.html
    0 0
  45. It's not. You may want the empirical evidence or a more detailed explanation. Or both.
    0 0
  46. One more Hockey Stick: The climate of North America during the past 2,000 years reconstructed from pollen data A.E. Viau, M. Ladd, K. Gajewski 2011 http://www.sciencedirect.com/science/article/pii/S0921818111001500 Highlights ► We use 748 pollen records from across North America to reconstruct the climatic conditions during the past 2,000 years ► Temperatures during both the Medieval Period (MWP; 650-1050 AD) and the subsequent Little Ice Age (LIA; 1550-1850 AD) appear cooler than the past few decades ► The climate during Medieval times was warmer than the LIA across North America ► Results can be interpreted as due to a poleward shift in the position of Subtropical High Pressure Cells in summer during the MWP ===== With so many records this paper may show the advanced and retreat of the aforementioned Subtropical High Pressure Cells during the MWP. That would be a nice addition to the Hockey literature.
    0 0

You need to be logged in to post a comment. Login via the left margin or if you're new, register here.


The Consensus Project Website

THE ESCALATOR

(free to republish)


© Copyright 2024 John Cook
Home | Translations | About Us | Privacy | Contact Us