


 Arguments


Is a Powerful El Niño Brewing in the Pacific Ocean?
Posted on 23 April 2014 by Rob Painting
- El Niño puts in an appearance every two to seven years, and involves the abrupt discharge of heat from the tropical ocean to the atmosphere - often resulting in years with warmer-than-average global surface temperatures.
- Every now and then a very large event occurs, such as the one in 1997-1998 which broke surface temperature records at the time and caused worldwide disruption and damage.
- The current large build-up and eastward movement of heat in the equatorial subsurface ocean strongly hints at a powerful El Niño developing this year.
- A powerful El Niño is by no means guaranteed, but should one develop mid-2014 to mid-2015 would likely be the hottest 12 months ever recorded. Unfortunately widespread weather-related chaos and mass coral bleaching is almost certain to follow.
Figure 1 - Ocean temperature vs depth anomalies for the equatorial Pacific in 2014. Image from NOAA CPC.
Normal Transmission in the Tropical Pacific Ocean
The prevailing (dominant) winds in the tropical Pacific Ocean are the easterly trade winds which blow toward the west off the equator. These winds exist, in part, because the strong solar heating of the ocean there drives strong evaporation and the uplift of warm air from the sea surface. Air flows in above the sea surface to take the place of the warm air that has been vertically displaced, but this low-level air curves toward the west due to Earth's eastward rotation - a phenomenon known as the Coriolis Effect.
An index known as the Southern Oscillation Index (SOI) describes the state of the trade winds, and measures the air pressure difference at sea level between Tahiti in the central Pacific and Darwin at the edge of the western Pacific. Under normal conditions the ocean near Tahiti sits in an area of high pressure, and Darwin in an area of low pressure. As the ocean surface is warmer in the western Pacific there is stronger upward movement of warm moist air (convection) and this lowers atmospheric pressure there relative to the ocean around Tahiti. As a result air at sea level moves 'downhill' from high to low pressure and the trade winds are reinforced.
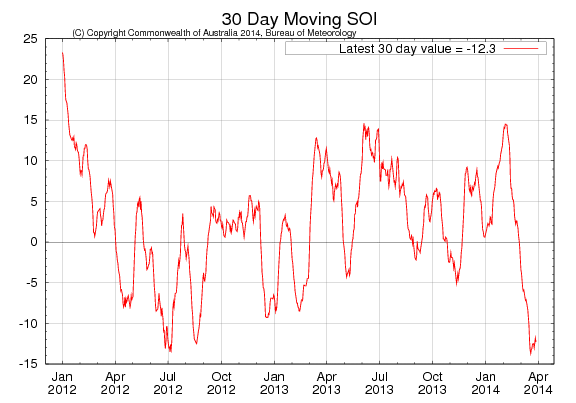
Figure 2 - recent SOI observations showing present negative conditions - an indication that the pressure at Tahiti is currently lower than that at Darwin. Sustained negative values below -8 generally indicate El Niño conditions. Image from the Australian Bureau of Meteorology (BOM).
Persistent trade winds have a curious effect on the motion of the water beneath them. Rather than travelling in the same direction as the wind, as one might intuitively expect, the westerly-moving trade winds induce a net current below the surface (Ekman transport) that travels at right angles (90°) to the wind. This near-surface current moves to the right of the wind direction in the Northern Hemisphere, and to the left in the Southern Hemisphere, and what we end up with is a large-scale movement of water away from the equator near the surface. This surface displacement pulls cold water up from the deep at the equator and creates the 'cold tongue' in the eastern and central Pacific.
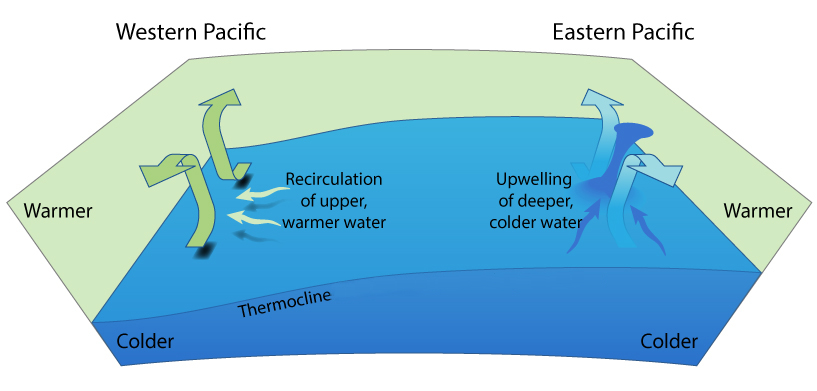
Figure 3 - Upwelling at the equator. The trade winds result in a net flow of water away from the equator due to the Coriolis Force. At the equator subsurface water is drawn up to the surface to replace it. The shallow thermocline (a result of water displacement to the west in the thin equatorial strip where the Coriolis Force drops to zero) in the east enables nutrient rich cold water from the deep to be drawn up to the surface, whereas in the west the deep thermocline results in recirculation within the layer above the thermocline. Image by jg.
Because there is no Coriolis Force in a thin band along the equator, rather than being directed at right angles to the wind (as elsewhere), water is dragged along in the direction of the wind, and piles up in the west and deepens the thermocline - so long as the wind is maintained. This piling up of water mass in the western Pacific also results in the flow of tropical water through the Indonesian archipelago into the Indian Ocean.
El Niño: A Break From Normal Transmission
Every 2-7 years or thereabouts El Niño signals an abrupt turnaround in this familiar pattern. Unlike La Niña, which is a strengthening of the normal circulation, El Niño comes about when the trade winds weaken. Although the details are vague and the precise triggers for El Niño development are still unknown, the normally intense trade winds weaken and the water piled up in the west begins to move back toward the eastern tropical Pacific in waves known as Kelvin waves. With this relaxation of the trade winds, the flow of warm water through the Indonesian Archipelago begins to wind down too.
Kelvin waves are 'helped' eastward by westerly wind bursts often associated with the formation of tropical lows and cyclones. As these spin clockwise in the Southern Hemisphere and counter- clockwise in the Northern Hemisphere, the equatorward edge results in intense westerly winds. Very close to equator, where the Coriolis force is zero, water is dragged in the same direction as the wind, but outside this thin strip the Coriolis force makes its presence felt. As mentioned earlier, the Coriolis force results in a net movement of water below the surface that is at right angles (90°) to the wind - to the right of motion in the Northern Hemisphere and to the left in the Southern hemisphere. So the flow of water beneath the surface in response to westerly wind bursts moves toward the equator, and any poleward deviations are likewise generally directed back toward the equator. The Coriolis Effect therefore results in the Kelvin wave being confined to the equator, with the equator itself acting as a boundary between the wave travelling west in the two hemispheres.
Figure 4 - The transit of the equatorial Kelvin wave across the Pacific basin is revealed by the sea surface height anomalies in 2014. As the warm water moves across the basin the greater thermal expansion of the warmer-than-normal water elevates the sea surface above it. Image from NOAA GODAS.
When the Kelvin waves reach the eastern Pacific they ride up the thermocline slope (the sharp temperature transition between less dense warm surface water and dense cool deep water) toward the surface, depressing the thermocline in the process, and are deflected north and south along the coast of North and South America. This gives the characteristic warm tongue-like feature in sea surface temperatures in the eastern Pacific during the peak phase of El Niño, and also shuts off the upwelling of cold water there. Not only is heat at the surface given up to the cooler atmosphere above, but heat is discharged poleward out of the equatorial zone via the ocean itself in a series of processes that are too long-winded to go into here. Suffice to say that the discharge of heat from the equatorial ocean eventually moves it back to a recharge mode - accumulating warm water for the next El Niño discharge.
Large Warm Water Anomaly Typically Equals Large El Niño
The large blob of warm water moving westward in the animation in Figure 1 above may look impressive, but how does it stack up against previous El Niño? The image below (Figure 5) illustrates the size (magnitude) of the equatorial warm water volume anomaly (the warm blob) relative to previous years. This shows that the current blob of warm water is comparable in magnitude, at this stage, to the El Niño event of 1997-1998.
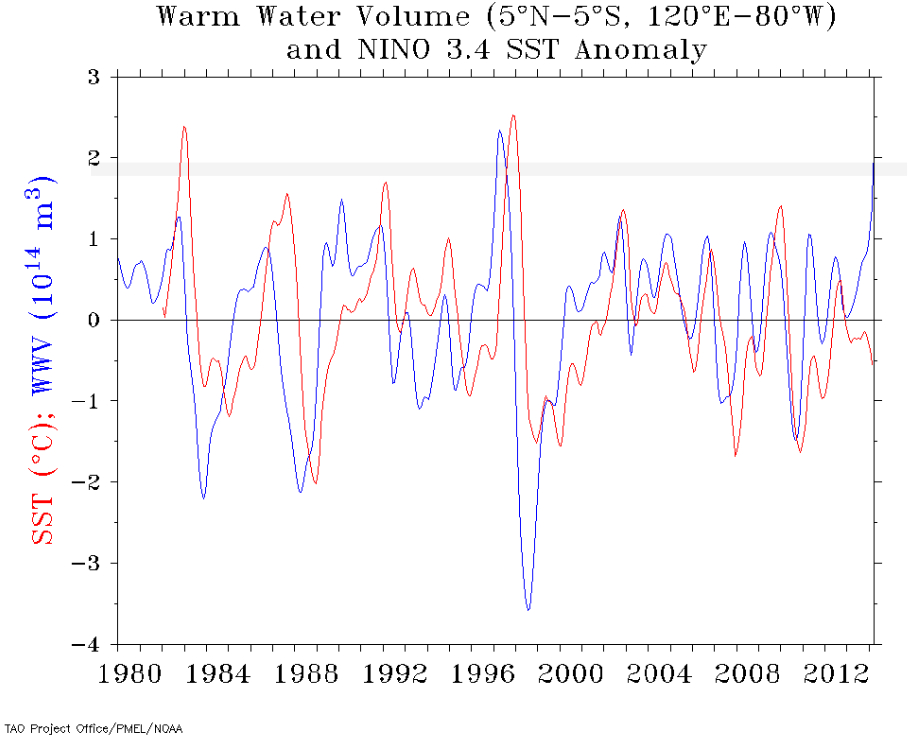
Figure 5 - Equatorial warm water volume anomaly (temperatures above 20°C) over the last few decades and up to early 2014. Warm volume anomaly in blue and sea surface temperatures (SST) for the NINO 3.4 region in red. As the grey band indicates, the 2014 volume anomaly is second only to the event of 1997-1998 in magnitude. Image from the TAO Project at NOAA.
Do larger equatorial warm water volume (WWV) anomalies necessarily translate into larger El Niño events? Although we have only a few decades worth of reliable observations, it does seem that the magnitude of the warm water anomaly typically leads to larger events. The relationship between WWV and eventual sea surface temperatures are apparent in Figure 5, but this was also a key finding of Meinen & McPhadden (2000) - see Figure 6.
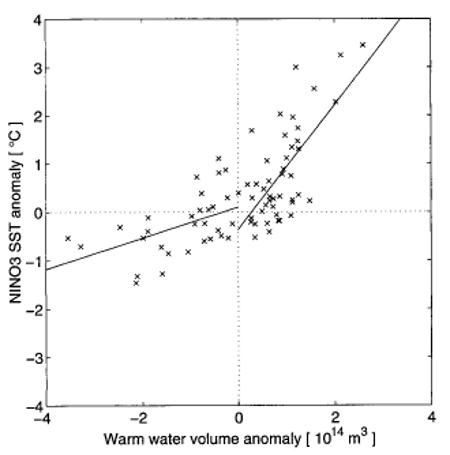
Figure 6 - Comparison of Nino3 SST and WWV anomalies. SST time series has been shifted backward by 7 months to maximize the cross correlation between WWV and SST. Lines represent least square fits to the values, separated into seasons with a negative WWV anomaly and those with a positive WWV anomaly. Image from Meinen & McPhadden (2000).
Keep a Close Watch on the Pacific
As stated earlier, we only have just over two decades worth of reasonably detailed observations, so it is by no means guaranteed that a powerful El Niño will develop. But, based on what we have observed and our current physical understanding of the phenomenon, the evolution of an intense El Niño event is possible. It's true the models are not yet predicting a large event, but they did fail to predict the magnitude of the 1997-1998 event, so are not necessarily a reliable indicator of scale this far in advance.
The arrival of a powerful El Niño would cause an abrupt rise in global surface temperatures as heat is discharged from the tropical ocean, and would entail widespread weather-related disruption and suffering around the world - so is not something to be welcomed. We (SkS) will take a look at the likely consequences if such an event unfolds, but for now we'll keep a watchful eye on the Pacific...


I think it needs to be made clear that even if we have as signficant event as the 1998 El-nino it is less likely to have such a dramatic impact on the calendar year temperature record as the impact looks to be spread across 2 calendar years. The impact of the 1998 El-nino was almost perfectly timed with the calendar year, as can be seen when you notice that 1997 and 1999 were both relatively cool.
A new temperature record is quite possible as it is during any El-nino event nowadays, it just wont be a stand out record in the way that 1998 was.
Kevin
The included chart of the BOM's 30 Day Moving SOI is out of date by over two weeks. The one you posted is showing a value of -12.3, but for the past couple weeks, that value has been steadily climbing and after topping out at +2.2 a few days ago, it currently sits at +1.9. The latest is available here:
http://www.bom.gov.au/climate/enso/#tabs=SOI
(Rob P) Yes, I'll update that later on today - the post was written a few weeks ago. I updated the first GIF animation, but forgot about the SOI image.
A new burst of westerly winds has started up within the last 4-5 days, so it would be expected to shift the SOI sharply negative once again, and push the subsurface warm water to the surface when the new kelvin wave reaches the east. Typical transit time from Papua New Guinea to the South American Pacific coast is about 2 months.
Kevin @1... But surface temps usually lag by about 6 months, so if we see an El Nino this summer or fall, we'll likely see a corresponding rise in surface temperature starting in 2015.
Entirely apart from the matter of climate change, my understanding of El Niño seems quite a lot better than it was a few minutes ago. Thanks!
ktam @1,
There is a correlation between the SOI and the El Nino that can be seen when you compare the values of each. A consistent strong negative monthly SOI was the start of the 1997/98 event. But noteable El Ninos have formed with fluctuating SOI values at this time of the year.
The following site presents a table of monthly updated averaged SOI values.
http://www.bom.gov.au/climate/current/soihtm1.shtml
And this one presents the monthly updated tracking of the ONI (El Nino/La Nina)
http://www.cpc.ncep.noaa.gov/products/analysis_monitoring/ensostuff/ensoyears.shtml
When an El Nino forms it generally gets established by midyear and extends into the following year.
Also, the change to negative SOI occurs in advance of the El Nino forming (as mentioned by Rob @3, and as presented in the article).
And the year after the formation of the El Nino is often the one that gets the biggest temperature increase above the ENSO Neutral condition.
Reviewing the NASA/GISS land-ocean average temperatures alog with the ONI:
This one, if it forms, could create a bigger 2015 bump or a big bump of both years.
How big the bump will be will depends on a number of difficult to predict factors, so it is a "watch for it" situation as mentioned in the article.
Rob,
I'd also like to draw your attention to a completely mathematical treatment of ENSO prediction, based on (elliptical) Mathieu functions rather than (circular) sine waves. You can find it here:
http://contextearth.com/2014/02/21/soim-and-the-paul-trap/
"Week beginning on April 13, 2014: 401.53 ppm
Weekly value from 1 year ago: 397.52 ppm" http://www.esrl.noaa.gov/gmd/ccgg/trends/weekly.html
So there's been a rise of over 4 ppm for last week over the same week last year.Is that going to be the new rate of increase--4ppm/year? Or is this a seasonal blip above the longer term rate of ~1.5 to 2.7ppm/year we've seen in so far this century?
ftp://aftp.cmdl.noaa.gov/products/trends/co2/co2_gr_mlo.txt
Note that the only reading in annual increase above 2.7ppm before this century was 1998 at 2.93. This, of course, was the year of the last Super-El-Nino. If we are moving toward a new Super-El-Nino this year, I would expect the annual increase this year to be considerably above 3ppm--maybe even well above 4, since we are already seeing this level of rise with the El Nino not quite officially started yet?
Kevin @1
We seem to be looking at different data as regards the assertions in your opening paragraph. When I look at the ENSO data provided by NOAA, (http://www.cpc.ncep.noaa.gov/products/analysis_monitoring/ensostuff/ensoyears.shtml) the “super el Nino” seems to pretty well straddle both 97 and 98. If I am looking at the wrong dataset, or if I am managing to misinterpret it, can you (or any one else) please point me in the right direction?
Regarding temperatures, if I am reading the data correctly (increasingly probable with every passing year) each of the three main terrestrial datasets (HadCRUT4, NCDC, Gisstemp LOTI) all seem to show 1997 as having been a record year for global (land + ocean) temps – albeit very briefly. Similarly, 1999 at the time ranked either 3rd or 4th (again very briefly) in each of these datasets.
The fact that 1997 was a record breaking year has simply been forgotten by many owing to the way it was summarily eclipsed in 1998. The two year rise (96-98) is unparalled in both the gisstemp and NCDC datasets, and is the second biggest (behind 1876-78) in the HadCRUT4 dataset. Similarly, although 1999 now seems relatively “cool”, it wasn’t really at the time. The huge drop from 98 to 99 was due to the fact that 98 was such an outlier, rather than any chilliness inherent in 1999.
If the timing is right (note the "if") then I think another outlier of the scale of 1998 could easily appear sometime in the not-too-distant future.
That is NOT a prediction for this year, just a thought for the future.
Cheers Bill F
Oops!
Paragraph 2 of my comment above should have read...
"... increasingly IMprobable with each passing year..."
See what I mean about each passing year????
Bill@8.
You are interpretting the ENSO/ONI information correctly. The warm El Nino effect typically starts in one year and continues into the next year.
What Rob@3 points out can also be seen. The global average surface temperature increase lags behind the formation of the warmer El Nino ocean surface. It takes time for the warmth from the equator to spread its effect to a larger area of the globe.
So 1997 was a record compared to the previous temperature history, but the bigger bump of that El Nino was in 1998.
As I indicated in my earlier post, this greater bump of the second year is seen in most of the El Nino periods.
Bill @8,
A better explanation for the sharp drop of global average temperature in 1999 from the 1998 peak was the rapid formation of a significant La Nina condition in mid-1998 (as you would see in the NOSS ONI table at:
http://www.cpc.ncep.noaa.gov/products/analysis_monitoring/ensostuff/ensoyears.shtml.
However, I agree that 1999 and 2000 remained high compared to the previous temperature history even though a strong and long acting La Nina had developed.
And the moral is... "never post on SkS just before going to bed after an evening spent slurping real ale with old university chums!"
OPOF @ 10 & 11
Thanks for the f/b
I totally agree with your la Nina comments in #11. What I had been trying to convey was that, despite the significant upwelling of cold deep water in the Eastern Pacific during 98/99, the temps were still remained very elevated for the time.
SkS has (somewhere) a graphic with annual global temps filtered into 3 categories: la Nina years, el Nino years and ENSO neutral which (I think) really explains the idea far better than words.
Cheers me dears Bill F (Oh look, it's getting near opening time again.)
[DB] Try here:
This is confusing my brain for a couple of slightly irrelevant reasons..
First, a large el-Nino event that blows away previous temperature records by a large margin would quiten doen the whole 'hiatus' hubbub. But that's scare comfort given the likely impacts. So on humanitarian grounds I want it to be a dud.
Second, there's a kind of Murphy's law involved.. everyone in the climate blogosphere is anticipating a big el nino.. but it's still possible that it'll fizzle out. Especially if people keep going on about it..
It's a bit like following the Arctic sea ice. It's a kind of addiction seeing if records are going to be set again this year.. but you know that the best thing that could happen is a sea ice recovery. And you also know that the moment you stop clicking 'refresh' on cryosphere today and forget about it, we'll have open water at the North Pole.
wili @7
The yearly increase in CO2 can jump around a bit - even modest changes in the rates for the major natural sources and sinks can have a big effect. So I would wait several years before calling such a large rate increase. That said the economy is picking up after the GFC so there could be some increase in the human emission rate. Too early to tell.
Wili @ 7
Another factor which may contribute to a strong El Nino are increased Chinese efforts to reduce their chronic air pollution. Every success they have in doing this increases solar radiation reaching the surface, adding that little extra to global surface temperature.
A very informative post, thank you.
Although I, too, would deplore the human suffering from weather extremes caused by a massive El Nino, it might at least cause some doubt about the veracity of AGW to be removed, at least in minds open to reason. A nasty jolt to our civilisation now, might just wake up some who are, currently, peacefully asleep at the wheel.
Also see the World Meterological Association (WMO) press release of April 14:
WMO Update Indicates Possible onset of El Nino Around Middle of Year
I think it is a lesson here, now in July, how cautious one needs to be about predictions. Statements made in April indicating how data is "stongly hint[ing]" about the size of the future El Nino are appearing to be inaccurate. Now in July, with ONI reported by the NOAA at .2, strong El Nino looks to be off the table with an event more in line with 2004 or 2009 (years where ONI was .2 at this time and El Nino started in September).
(Rob P) - See also El Niño in 2014: Still On the Way?. An event like 2009 would put El Niño (if it occurs that is) down as an extreme one. We'll have to wait and see.
The immense build-up of heat in the equatorial ocean, followed by a strong decline, is something not observed before. Uncharacteristic behaviour often leads to new insights into how something works.