


 Arguments


PMEL Carbon Program: a new resource
Posted on 12 February 2011 by John Cook
The NOAA Pacific Marine Environmental Laboratory’s Ocean Carbon Group in Seattle has developed a new website, the PMEL Carbon Program to help understand the changing chemistry of the oceans and the impacts of ocean acidification on marine ecosystems. 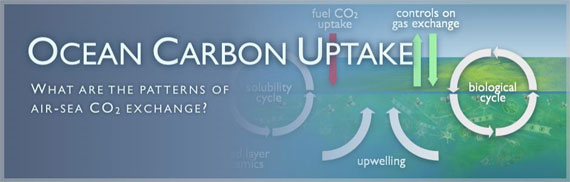
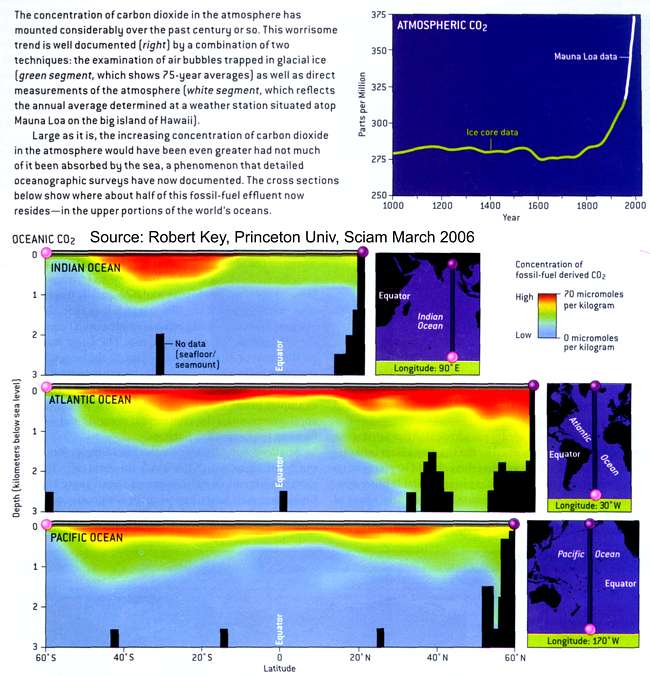
Fundamental changes in seawater chemistry are occurring throughout the world's oceans. Since the beginning of the industrial revolution, the release of carbon dioxide (CO2) from humankind's industrial and agricultural activities has increased the amount of CO2 in the atmosphere. The ocean absorbs about a quarter of the CO2 we release into the atmosphere every year, so as atmospheric CO2 levels increase, so do the levels in the ocean.
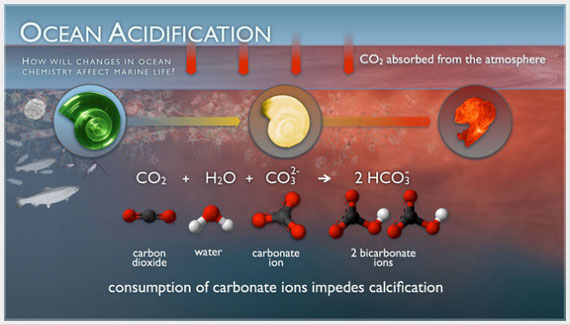
Initially, many scientists focused on the benefits of the ocean removing this greenhouse gas from the atmosphere. However, decades of ocean observations now show that there is also a downside — the CO2 absorbed by the ocean is changing the chemistry of the seawater, a process called “Ocean Acidification.”
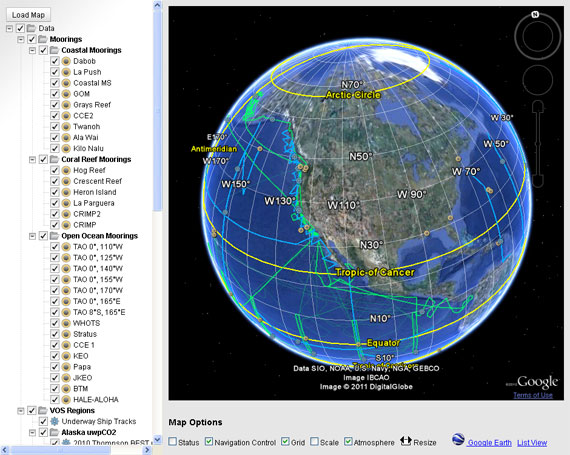
Oceanographers in their group have been studying how CO2 emissions affect the ocean system for more than three decades and continue to monitor ocean acidification in all the world’s oceans from coral reef ecosystems to deep North Pacific waters. The website provides valuable information on the ocean carbon cycle and ocean acidification processes, including model simulations of future projections. It also provides ocean carbon data via an easy-to-use Google web-based data portal. The website is easy to navigate and contains many links to ocean acidification data and information sources.


 0
0  0
0 As far as the impact of surface pH on ocean organisms, I found that the most alarming research (thin shells etc.) was done in areas of known upwelling. It is clear that living organisms will spread and populate the very edges of their tolerance - shellfish will live in low pH water that dissolves their shells IF there are sufficient nutrients to support them. Finding examples of critters at the edge of their tolerance is just a matter of selecting the right critter and the right locale.
I am concerned that the PMEL website is showing a lack of objectivity when it repeatedly focuses on anthropogenic nature of ocean carbon cycle changes (in the mission statements) when there are large natural variations that should also be studied to gain a true understanding of the ocean dynamics.
As far as the impact of surface pH on ocean organisms, I found that the most alarming research (thin shells etc.) was done in areas of known upwelling. It is clear that living organisms will spread and populate the very edges of their tolerance - shellfish will live in low pH water that dissolves their shells IF there are sufficient nutrients to support them. Finding examples of critters at the edge of their tolerance is just a matter of selecting the right critter and the right locale.
I am concerned that the PMEL website is showing a lack of objectivity when it repeatedly focuses on anthropogenic nature of ocean carbon cycle changes (in the mission statements) when there are large natural variations that should also be studied to gain a true understanding of the ocean dynamics.
 See prior ocean acidification threads; here's one for starters.
See also McNeil and Matear 2008
Southern Ocean acidification via anthropogenic CO2 uptake is expected to be detrimental to multiple calcifying plankton species by lowering the concentration of carbonate ion (CO32−) to levels where calcium carbonate (both aragonite and calcite) shells begin to dissolve.
See prior ocean acidification threads; here's one for starters.
See also McNeil and Matear 2008
Southern Ocean acidification via anthropogenic CO2 uptake is expected to be detrimental to multiple calcifying plankton species by lowering the concentration of carbonate ion (CO32−) to levels where calcium carbonate (both aragonite and calcite) shells begin to dissolve.
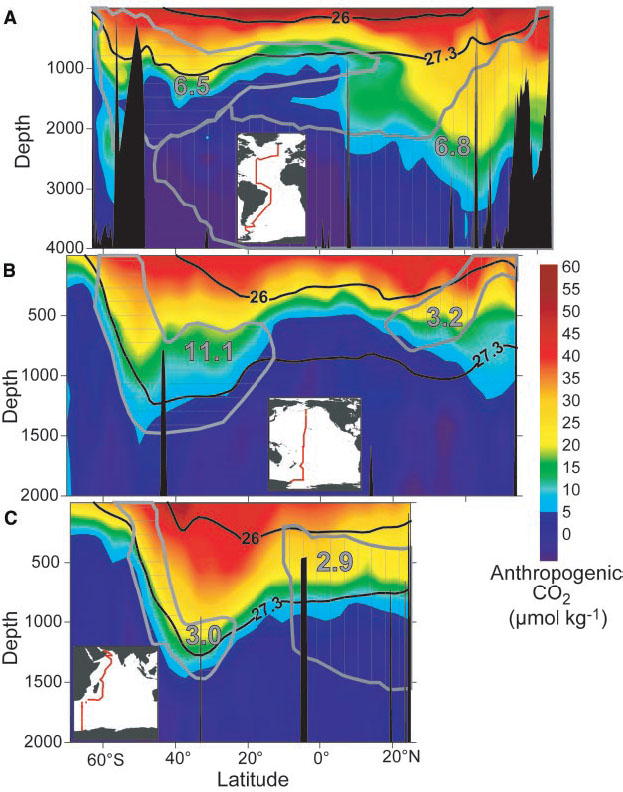
 Notice the the relationship here?.
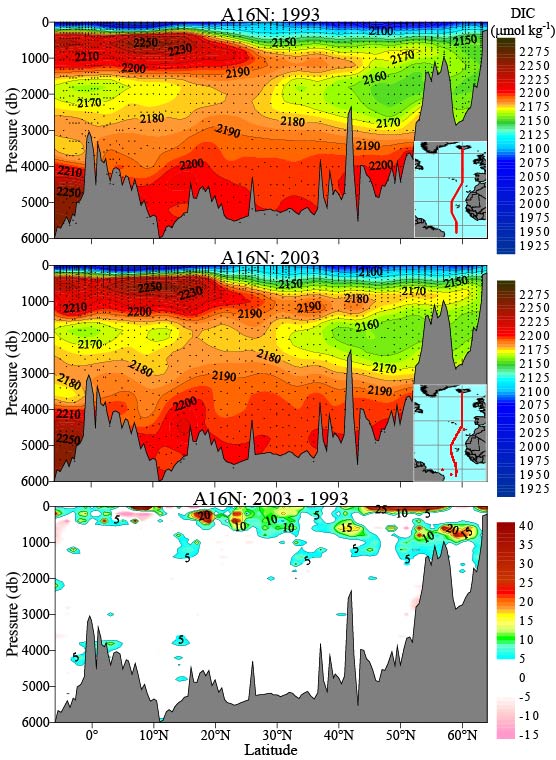 It seems to show some interesting features. First, it shows that the DIC is acually lower near the surface compared to the deeper waters - the opposite of muoncounter's graph. Why? muoncounter is looking only at estimates of anthropogenic CO2 - that means that the total (anthopogenic + nonanthropogenic) CO2 could be going up or down - you can't tell from his graph.
The PMEL data shows 1993 on the top, then 2003, then the difference. We can see that there was an increase in DIC in some areas from 1993-2003. Does that mean that the increasing atmospheric CO2 impacted the oceans...?
Perhaps. A quick look at the data will show that the surface temperature was a couple of degrees higher in 1993 than in 2003 over the latitude range 45N-55N. This qualitatively matches the region of largest increase. Could this explain the change in DIC in the PMEL data rather than atmospheric CO2 increases?
It seems to show some interesting features. First, it shows that the DIC is acually lower near the surface compared to the deeper waters - the opposite of muoncounter's graph. Why? muoncounter is looking only at estimates of anthropogenic CO2 - that means that the total (anthopogenic + nonanthropogenic) CO2 could be going up or down - you can't tell from his graph.
The PMEL data shows 1993 on the top, then 2003, then the difference. We can see that there was an increase in DIC in some areas from 1993-2003. Does that mean that the increasing atmospheric CO2 impacted the oceans...?
Perhaps. A quick look at the data will show that the surface temperature was a couple of degrees higher in 1993 than in 2003 over the latitude range 45N-55N. This qualitatively matches the region of largest increase. Could this explain the change in DIC in the PMEL data rather than atmospheric CO2 increases?
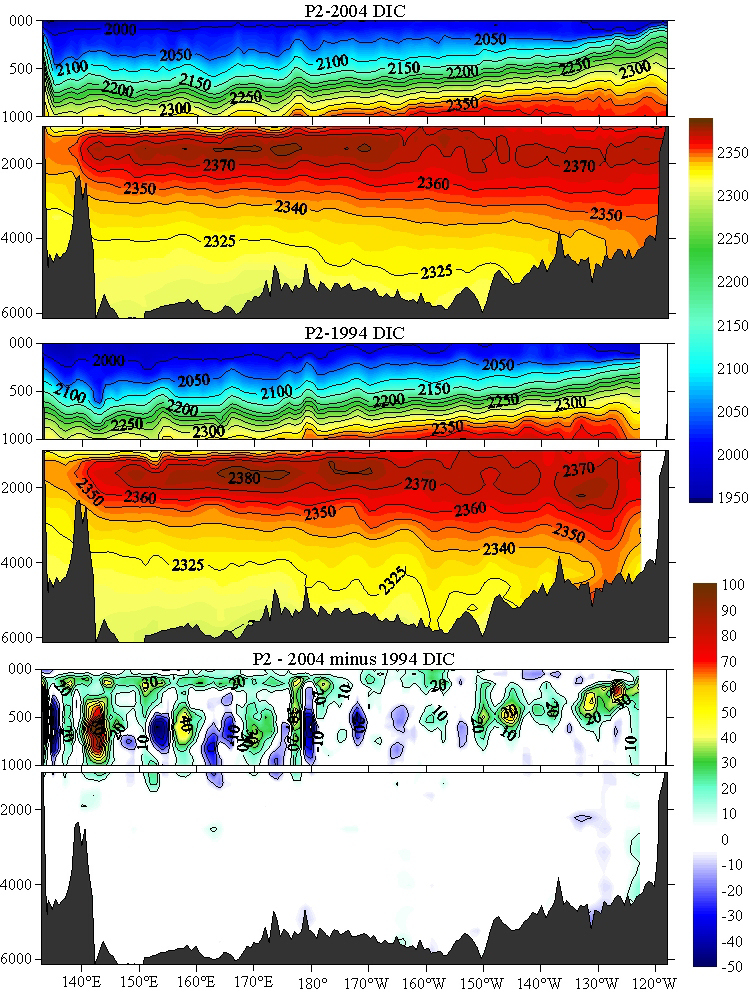 It still doesn't look much like muoncounter's graph.
 This is obviously a complex and very dynamic problem. Hopefully the availability of the PMEL data will help sort out what's going on.
 You still haven't explained your novel mechanism, in fact you continue to evade the question, dancing around the issue . How does the ocean become acidified if not from fossil fuel emissions?. Remember those graphs of total DIC in the ocean you posted at comment Nos.7 & 10.?. Where's that extra carbon coming from?. You understand it has to be coming from outside the oceans right?. See what I mean about coherence?.
guinganbresil - .....are playing fast and loose with the facts.
Typed, no doubt, without the slightest inkling of self-awareness.
You still haven't explained your novel mechanism, in fact you continue to evade the question, dancing around the issue . How does the ocean become acidified if not from fossil fuel emissions?. Remember those graphs of total DIC in the ocean you posted at comment Nos.7 & 10.?. Where's that extra carbon coming from?. You understand it has to be coming from outside the oceans right?. See what I mean about coherence?.
guinganbresil - .....are playing fast and loose with the facts.
Typed, no doubt, without the slightest inkling of self-awareness.
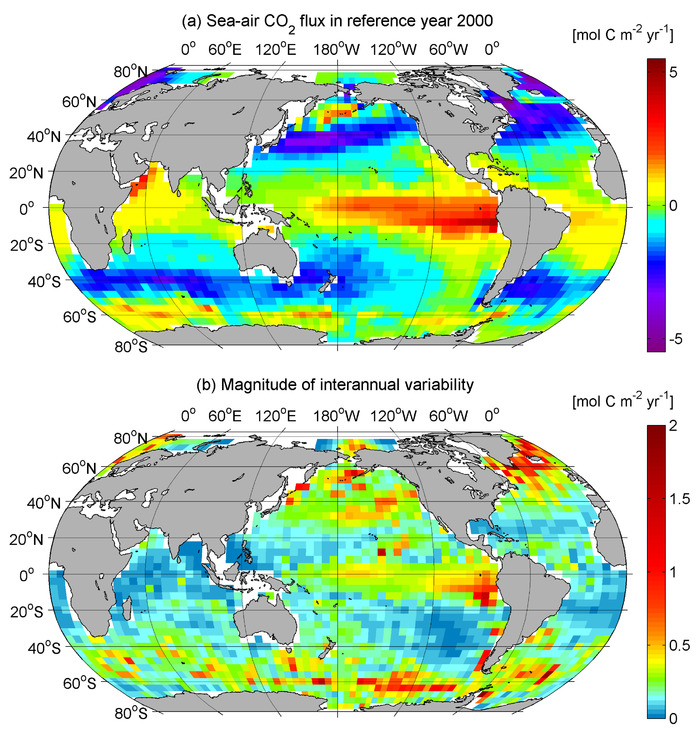
 A result of this Fallacy of Composition(2) is the idea that a drop in pH in the ocean surface can only be due to increasing anthropogenic CO2. Here are a few 'novel mechanisms' that can reduce surface CO2: Upwelling of lower pH water from below, decrease in biological activity at the surface, difference in CO2 surface transfer due to local wind and temperature - I am sure there are more... It is a lot more complicated than just anthropogenic CO2.
Another result of this Fallacy of Composition(3) is to assume that increasing concentration of anthopogenic CO2 in the ocean surface since the beginning of the industrial age results an increase in total CO2 in the ocean surface over time.
I am not saying that anthropogenic CO2 is not affecting the environment - I am saying that we should critically analyze the data and results. avoid the insidious fallacies and not play fast and loose with the facts.
A result of this Fallacy of Composition(2) is the idea that a drop in pH in the ocean surface can only be due to increasing anthropogenic CO2. Here are a few 'novel mechanisms' that can reduce surface CO2: Upwelling of lower pH water from below, decrease in biological activity at the surface, difference in CO2 surface transfer due to local wind and temperature - I am sure there are more... It is a lot more complicated than just anthropogenic CO2.
Another result of this Fallacy of Composition(3) is to assume that increasing concentration of anthopogenic CO2 in the ocean surface since the beginning of the industrial age results an increase in total CO2 in the ocean surface over time.
I am not saying that anthropogenic CO2 is not affecting the environment - I am saying that we should critically analyze the data and results. avoid the insidious fallacies and not play fast and loose with the facts.
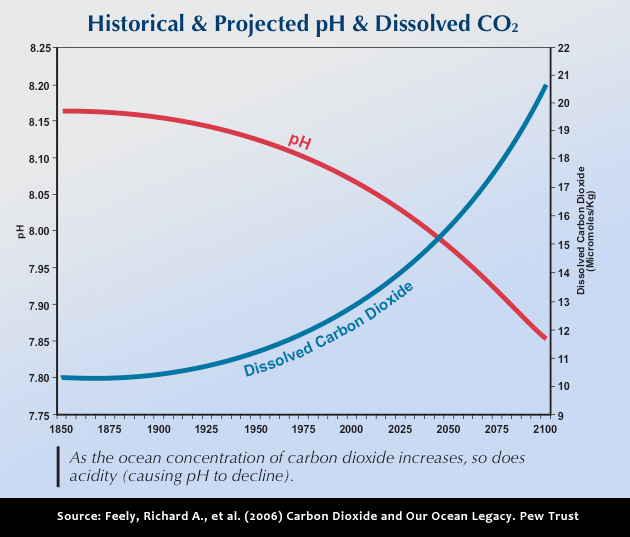
 Note that the addition of carbon dioxide dissolving into surface waters is what is causing the increase in total carbon in the ocean (DIC). pH is a reflection of the chemical reactions which dissociates more hydrogen ions from water molecules. I think your confusion stems from failing to understand this point.
 It appears that respiration and photosynthesis drives the CO2, O2 and pH profiles of the oceans...


Comments