


 Arguments


How does Arctic sea ice loss compare to Antarctic sea ice gain?
What the science says...
| Select a level... |
 Basic
Basic
|
 Intermediate
| |||
|
Arctic sea ice loss is three times greater than Antarctic sea ice gain, and the amount of solar energy absorbed by the Earth is increasing as a result. |
|||||
Climate Myth...
Arctic sea ice loss is matched by Antarctic sea ice gain
In fact, the global sea-ice record shows virtually no change throughout the past 30 years, because the quite rapid loss of Arctic sea ice since the satellites were watching has been matched by a near-equally rapid gain of Antarctic sea ice. Indeed, when the summer extent of Arctic sea ice reached its lowest point in the 30-year record in mid-September 2007, just three weeks later the Antarctic sea extent reached a 30-year record high. The record low was widely reported; the corresponding record high was almost entirely unreported. (Chris Monckton)First of all, it is very simple to look at the data and realize that the Arctic is losing more sea ice than the very slight increase in Antarctic sea ice (Figures 1 and 2).

Figure 1: Global sea ice extent since 1979. (Image source: Tamino. Data is from US National Snow and Ice Data Center.)
Figure 2: National Snow and Ice Data Center (NSIDC) Antarctic, Arctic, and global (sum of the two) sea ice extents with linear trends. The data is smoothed with a 12-month running average.
Sea ice area data shows the same thing as extent data.
However, some have argued that Antarctic sea ice gain is more important than Arctic sea ice loss because they claim it has more effect on the amount of solar radiation absorbed by the Earth. Is there any truth to this claim?
The Poles Receive More Solar Energy in Summer
First of all, for most of the year higher latitudes receive less solar energy than lower latitudes. But deep in the heart of summer this is no longer true. In fact at the point of midsummer, the poles receive more solar energy than any other place on earth. Here’s the solar insolation as a function of latitude, for various times of year from northern midwinter (southern midsummer) to northern midsummer (southern midwinter) (note: this does not include the correction for varying earth-sun distance, it’s merely to illustrate the latitude dependence at a given time of year):
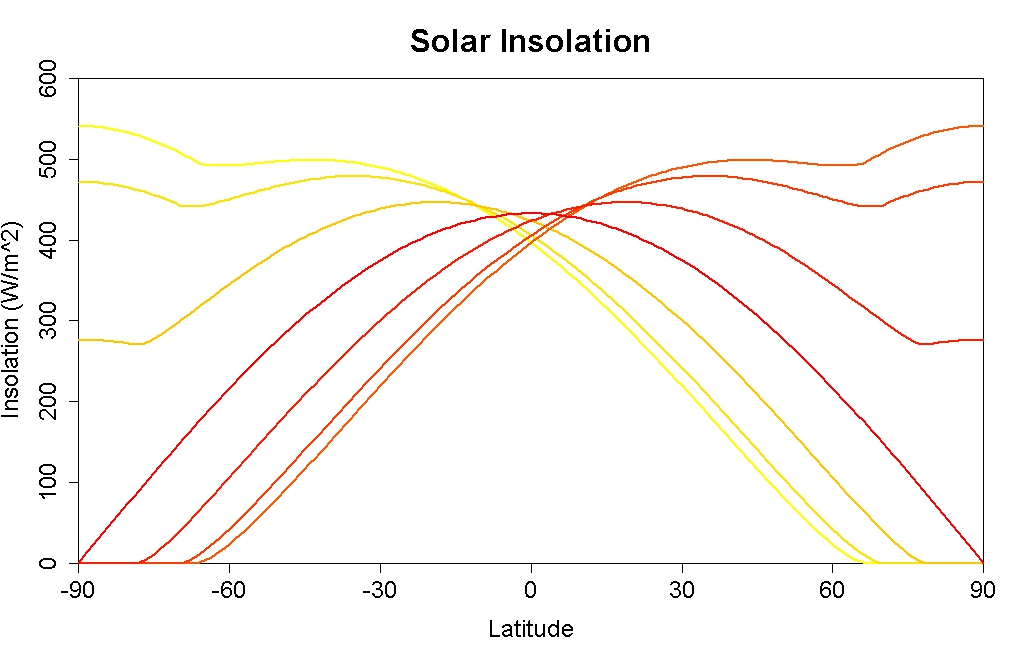
During the summer months, when ice albedo feedback really counts, higher latitudes really do get more solar energy than lower latitudes. When the insolation depends strongly on latitude, with higher latitudes getting much less solar energy, the total insolation is so small that the impact of albedo change is small.
Northern Hemisphere Summer is Weaker but Longer than Southern
Another factor is that earth is farthest from the sun during northern hemisphere summer (when albedo change counts most) but closest to the sun in southern hemisphere summer. That has led some to believe that the impact of albedo change will be enhanced in the southern hemisphere. This is an understandable mistake; in southern hemisphere summer earth really does receive more solar energy per unit of time because we really are closer to the sun. But the rate of travel of the earth along its orbit is inversely proportional to the square of our distance from the sun — exactly the same proportion by which solar energy changes — so the northern hemisphere summer may be weaker than the southern, but it also lasts longer. For total insolation, the two factors cancel each other so at any given latitude, the annual-total solar energy input is unaffected (a fact which was emphasized by Peter Huybers in relation to ice age cycles). So no, proximity to the sun during southern hemisphere summer doesn’t enhance the ice albedo effect.
Let's Do the Math
If we really want to know the relative impact of ice albedo change between hemispheres, the thing to do is: the math.
I took daily values of sea ice area from NSIDC. I modelled the Arctic ice pack as a circle around the pole of the same area, and the Antarctic ice pack as a ring around the Antarctic continent, with the edge of the Antarctic continent as being at latitude 70°S. This is only a crude representation of the geometery of the sea ice packs, but it’s at least correct to first order.
Then I computed, for each day, the sun’s declination (its altitude above or below the celestial equator). I also computed the earth-sun distance so I could apply that correction to the solar insolation. This enabled me to compute the total amount of solar radiation hitting parts of the earth which are covered by sea ice, which I call “sea ice insolation“. I did so separately for the northern and southern hemispheres.
For both hemispheres, sea ice insolation shows a strong annual cycle. So I computed the average total sea ice insolation for each year, for each hemisphere, corrected for earth-sun distance and angle of elevation of the sun. This gives the annual average sea ice insolation in TW (teraWatts). We can then look at the trends in sea ice insolation, to see which pole has lost or gained more in terms of solar energy impacting sea-ice-covered regions.
It’s quite a complicated calculation, so it’s possible I’ve made an error. But the amounts are certainly in the right ballpark, and I’ve done orbital calculations for decades, so I suspect I got it right. The data cover the time span from 1979 through 2011.
And here’s the result: annual average sea ice insolation, together with linear trend lines, for both hemispheres:
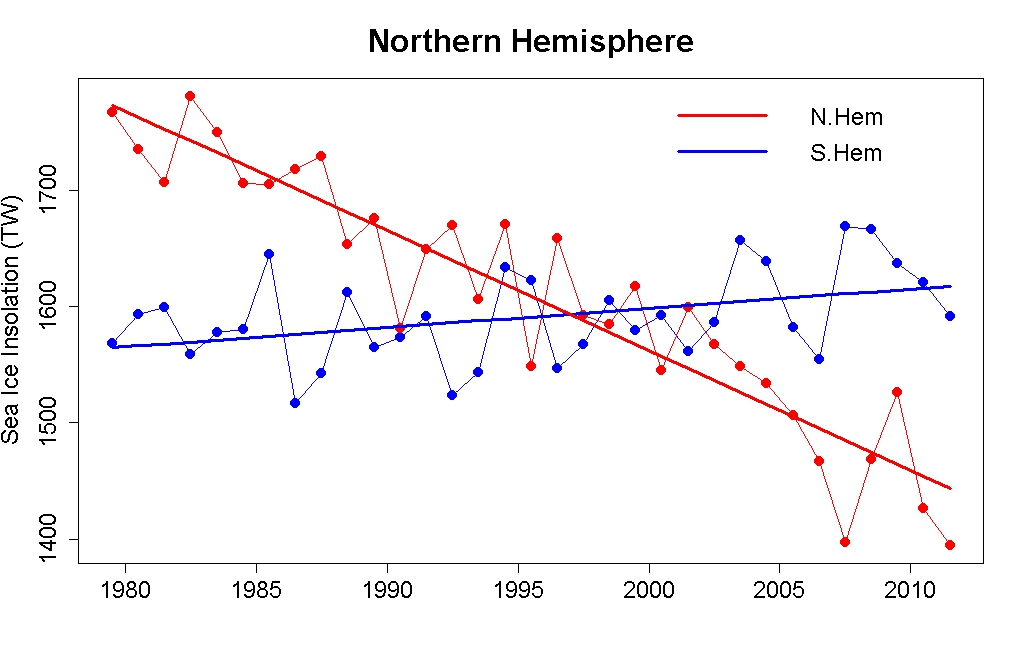
You can see the trends. Clearly. The trend has shown an increase in Antarctic sea ice insolation of about 53 TW, and a decrease in Arctic sea ice insolation of about 329 TW. That’s over 6 times as great.
If we spread 53 TW over the entire earth we get a global average of 0.10 W/m^2. So even if the difference between ice and ocean albedo were equal to 1 in the southern hemisphere (i.e., Antarctic sea ice were perfectly reflective while ocean was completely absorbing) the net global climate forcing would amount to -0.10 W/m^2. But sea ice isn’t perfectly reflecting, not even in the southern hemisphere where the sea ice is often snow-covered, and ocean is not perfectly absorbing. If the top-of-atmosphere (TOA) albedo difference between sea-ice-covered and open ocean areas is 0.2, then the global climate forcing from Antarctic sea ice changes would be about -0.02 W/m^2.
If we spread 329 TW over the entire earth we get a global average of 0.65 W/m^2. If the TOA albedo difference between sea ice and open ocean is 0.2, then the global climate forcing from Arctic sea ice changes would be about +0.13 W/m^2.
And it turns out that 0.2 is not a bad figure for the TOA albedo difference, according to Hudson (2011):
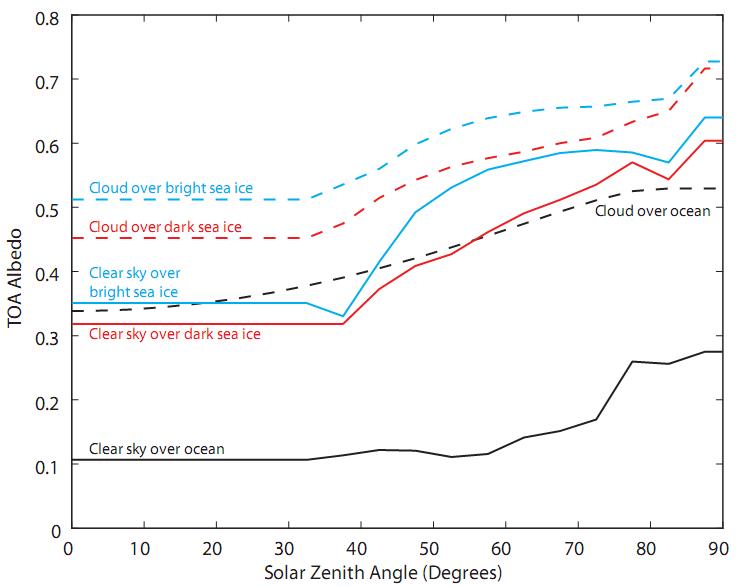
In fact Hudson states that
"Results show that the globally and annually averaged radiative forcing caused by the observed loss of sea ice in the Arctic between 1979 and 2007 is approximately 0.1 W m-2"
so my crude calculation is certainly in the right ballpark. As I said, this is a pretty complex calculation so I may have made an error, but I certainly ended up in the right neighborhood according to Hudson. The combined increased radiative forcing caused by the increase in Antarctic sea ice and decrease in Arctic sea ice from 1979 to 2011 is approximately +0.1 W/m^2.
Last updated on 5 October 2012 by dana1981. View Archives


[DB] This was discussed over at Neven's (starting here). See also Arctic Sea Ice Hockey Stick: Melt Unprecedented in Last 1,450 years, where you will find this graphic (extent being an approximation of relative volumes over time):
The data presented above is outdated by a few years. The combined anomoly of NH and SH sea ice is trending upward since 2007. As electric rates have risen 40% over the last 7 years, justification has thinned more than the ice has.
However, the Arctic ice volume 2014 peak is lower than the 2007 peak, but by a very small amount, far less than 1000 cubic km (PIOMAS). I'm not seeing the Arctic sea ice decrease on the order of 'three times as much as' in recent data. Things are different than in July 2012. This year has seen the remaining Arctic ice exceed seven other recent years just since April 22nd (Charctic), due to slow spring 2014 melt and the remaining Arctic ice is only 5.4% less than this time in 1994. As a comparison, 1994 was a very cold winter as I moved from S. Fla to Indiana at the start of that deadly winter. The temp at my apartment hit -44F without the wind chill on MLK day. I considered the possibility that the cold air over the great plains that day contracted the U.S. such as to have caused the Oakland earthquake that same day. As I recently have read about ocean volume thermal expansion due to surface temp increase, it might not have been so far fetched a thought.
[PS] This moderator is struggling to decide whether you actually cant understand that cherrypicking and short trends are not science or whether you are trolling. You have been called on this before.
Jetfuel @4, let me see...
1) Use of short time span for comparison? Only eight years of a 30 plus year record used. Check!
2) Use of previous record breaking year as start point for comparison? 2007 record year used. Check!
Well, your certainly playing from the denier play sheet for bad science.
Trying to turn an April PIOMAS which is less than the trend value into evidence that the trend is reducing certainly shows gumption, but surely you must know that such unethical distortions of the facts will get called on this site:
[PS] Jetfuel, please ackowledge that you understand Tom's point. If you dont understand, then more explanation is likely to be offered. If we get a "look, squirrel" instead, then your posts will be deleted.
Response @4&5.
The cherry-picked number,Δ(Arctic Sea Ice Volume maximum 2007 & 2014), described as "a very small amount, far less than 1000 cubic km (PIOMAS)" is 750 km3, which over a seven year period and in the units used in the graph @5 represents a trend of -1.07 (1000 km3/Decade). It isn't a very ripe cherry.
The comparison presented @4, that of Arctic Sea Ice loss being allegedly not "on the order of 'three times as much as' in recent data," it is a comparison with Antarctic Sea Ice gain. Antarctic Sea Ice Volumes are not as well understood as their northern equivalents, but Holland et al (2014) suggest an Antarctic Sea Ice Volume trend of +0.3 (1000 km3/Decade) for 1992-2010. Ironically, that is about a third the size of the cherry-picked measure of ice loss in the Arctic.
I do wonder if the attempt by jetfuel@4 to challenge the assertion made in this post (that Antarctic Sea Ice is growing at a much slower rate that Arctic Sea Ice is shrinking) should be batted away innto the long grass simply because of the incompetence of jetfuel to state his case.
It is true that over the satellite record (1979 - to date), the decline in Arctic Sea Ice Area & Extent is roughly three times larger than the increase in Antarctic Se Ice Area & Extent. It is also true that both the Arctic decline and the Antarctic increase - both these trends have shown signs of acceleration over recent years, yet generally the three-to-one ratio remains. And it is true that the acceleration in trends is accompanied by greater variability but this has not resulted in net global Sea Ice area & extent anomalies reaching any unprecedented values* when examined as daily, monthly or quarterly averages, *unprecedented taken as values over the last decade, there being variability evident with such periodicity.
However, recent Net Global Sea Ice area & extent do start to show unprecedented values* when Annual Averages are examined. This results mainly from the Antarctic anomaly showing a rising trend over the last two years. While this remains presently a short-term phenomenon, the mechanisms behind the growth of Antarctic Sea Ice area & extent are known to be the product of Antarctic regions with increasing sea ice cover and other Antarctic regions with decreasing sea ice cover. The net Antarctic anomaly is the result of two far larger values that presently come close to cancelling each other out. Such a cancellation cannot be relied on. One of the mechanisms (for increase or decrease) could easily come to dominate the anomaly in future decades, as may have been the case prior to the satellite era. Indeed, Fan et al (2014) argue quite convincingly that the start of the satellite data (1979) likely coincides with a shift from significant Antarctic summer (DJF) ice loss over the period 1950-78.
Thus, while the comments by jetfuel are based on cherry-picking nonsense, and while the Net Global Sea Ice area & extent has been in decline over the satellite era (1979 - to date), predicting a continuation of that decline is potentially foolhardy as future trends, in particular Antarctic Sea Ice cover, remain uncertain.
Is the scale on the Antarctic Sea Ice Extent graph in Figure 2 correct? I thought that Antarctic sea ice was up around the 20 million sq km mark. Thanks.
Rett,
The data in figure 2 is a 12 month average, not the maximun. The Antarctic sea ice maximun (this year) was just over20 million km2. Sea ice was only that high for about one week. Sea ice has dropped to about 18 million km2. The yearly average is lower than the maximum is. The graph is also from last year so it does not include the most recent data.
The yearly average is more informative than the maximum because it tells us about what is happeing the entire year. A graph of all the data can be found here (the graph is area not extent so the maximun this year is 17 million km2. The graph of the Antarctic is about half way down the page.)
I got into an argument recently with a denier who is convinced the gain of seasonal Antarctic sea ice compensates for the loss of Arctic sea ice, because the increased albedo in the south substitutes for the loss of albedo in the north. I worked up a graphic to show why that doesn't work.
Below is a picture of the Earth in northern hemisphere summer. This is the time that the Arctic ocean under the collapsing northern sea ice is absorbing the most heat from the sun. This is also the time of the greatest extent of Antarctic sea ice, since it is winter in the southern hemisphere. This is the time of year when deniers claim the minor increase in seasonal Antarctic sea ice somehow compensates for the loss of permanent northern sea ice.
The red streak at the top of the picture shows the amount of sunlight falling on the vanishing northern ice cap. The thin red line at the bottom of the picture shows the amount of sunlight falling on the “increased” southern hemisphere sea ice. Both are approximations. In the north, I enclose the entire ice cap, not just the parts that have vanished, because in a very few years the Arctic will be virtually ice-free in the summer. Likewise, I made the southern line about three times thicker than it should be, to allow for three times as much Antarctic seasonal sea ice gain than we’ve seen so far, so that deniers don't think I'm ignoring the possibility of more growth there.
As you can see, the two red patches are not anywhere near the same size. The loss of Arctic sea ice cannot be compensated for by a gain in Antarctic winter sea ice, unless Antarctic winter sea ice begins to reach to Madagascar and to southern Australia.
This graphic is only approximate. It may be more useful (and more complete) to do a series of more carfully-made graphics, starting with polar views that show both the average and the current extent of Arctic summer and Antarctic winter sea ice, and then probably a picture showing where the sun rays fall in September when the Arctic is at its minimum and the Antarctic is at its maximum. Probably also, the final graphic should be from the sun's point of view, showing the vast areas of now-open ocean lit by the sun in the north, and the thin sliver of arc where the Antarctic "increase" is located.
If this does seem to be a useful approach, feel free to either adapt this graphic, or to request the series.
All this ignores, of course, the fact that whatever happens near the South Pole can't possibly undo the changes to northern hemisphere climate (wind and ocean currents, loss of habitat, etc.) that the loss of Actic ice causes.
dcpetterson,
Isn't the situation just the reverse six months later, when it is Southern hemisphere summer? I would think, that if the ice gain in the South were equal to the ice loss in the North there would be no change in albedo fo Earth as a whole over the year.
Rovinpiper @11, not it is not. That is because the Arctic is an ocean surrounded by land, while the Antarctic is land surrounded by ocean. The important effect of that is that while in principle summer sea ice in the Arctic can shrink to zero, thereby exposing the entire Arctic ocean with its much lower albedo than sea ice; the Antarctic sea ice shrinking to zero still effectively left the entire polar region above 70 degrees south covered by land ice, and hence maintaining the same albedo. As the Arctic sea ice shrinks will within that 70 degree circle, the consequence is a much larger Arctic impact on seasonal albedo.
This is discussed in the intermediate version of the original post.
Tom @ 12, in a nutshell is this why the Northen Hemisphere is warmer than the Southern Hemisphere?
I've been looking for the simple explanation as to why this is because apparently it was theorised many moons ago but the mechanism for it being so was not quite understood.
bozza @13, there are three different things that could be meant by a claim that the NH is 'warmer than' the SH.
First, it might be a claim that the annual variation is surface temperature is greater in the NH than in the SH, as shown in this chart:
This greater variation results in the seasonal variation in global mean temperatures being in phase with the NH variation, even though the SH in fact recieves more sunlight over the year. The reason for this difference is the relatively low thermal inertia of the NH (which is 39% land) compared to the SH (which is only 19% land).
The same factor is the dominant factor in the more rapid rise in mean hemispheric temperatures in the NH since 1950 (the second possible interpretation), shown here:
Neither implies that the NH is actually warmer than the SH in absolute terms, as a more rapid warming response also implies a more rapid cooling response. In fact, it appears that in absolute terms, the SH is warmer than the NH:
It may be that the very cold Antarctic temperatures more than compensate for the greater extent of tropical warmth in the SH, and the slower loss of temperature with higher latitude. But I have no evidence showing that to be the case.
Regardless, the cause of these differences are complex, including the effect of the positions of landmasses and currents on the location of the Inter Tropical Convergence Zone (which would govern the latitudinal extent of the tropical zone) and the relative ease of heat transport towards the poles in the two cases. Part of the explanation may lie in the circumpolar vortex around Anarctica, which by limitting heat transport to the pole may allow that heat to remain in mid-latitudes in the SH rather than being transported to the pole (or at least above the arctic circle) in the NH.
Ok, so why is the fact that there is land at the South Pole so important? Ice can melt on land, too. Open ocean absorbs heat very well, but what is the rock of Antarctica like? How well will it absorb heat?
Rovinpiper, Arctic sea ice averages less than two meters thick. Antarctic land ice averages more than 1800 meters thick. See the problem?
The really big factor is height. The south pole is at 2700m - making it a much colder place than North pole. Raising the summer temperature from current -29C to say -9C still wouldnt do much melting. Furthermore, arctic ice is constantly moving with combination of wind and currents. Moving ice from somewhere cold to somewhere warm is much more effective at melting than inplace melting. In the antarctic, ice movement is at literrally glacial pace. The oceans also bring in warmer water which thins arctic ice but so far only affects the antarctic margin.
Rovinpiper @15, the coroilis effect leads to circular patterns of motion in air and sea currents because the coroilis "force" is always at right angles to the direction of motion of the wind or sea current, as illustrated below:
Around the north and south poles, this leads to a permanent circumpolar vortex which helps prevent the flow of warm are from the south above the Arctic or below the Antarctic circle. There are differences between them. Specifically:
Because the Antarctic polar vortex is larger, it keeps the warm air further from polar regions. Because it is stronger, it more effectively insulates Antarctica. Further, because the Arctic polar vortex is less stable, it often moves far from its central position with the effect that frigid air is brought into temperate regions, and warm air is pumped into the Arctic.
The difference is stability is a direct consequence of the fact that the Arctic is water surrounded by (very cold in the winter) land, whereas the Antarctic is land surrounded by relatively warm water.
More important than the atmospheric polar vortex are the circumpolar currents found around Antarctica (also caused by the coriolis effect), which limit the ability of warm water from reaching the coastline of Antarctica.
Obviously these circumpolar currents are only able to form because Antarctica is land surrouned by water. In the NH, no such currents form. Instead , the Eurasian landmass diverts part of a tropical current (the Gulf Stream) north, carrying warm water deep into the Arctic ocean. There is also a smaller, seasonal warm current through Berring Strait:
The effect of this is two fold. First the Norwegian Current (the extension of the Gulf Stream) keeps waters as far north as Svalbad unfrozen in winter in the North Atlantic (in current conditions). Second, because the water enters the Arctic ocean at the Norwegian current, it must exit somewhere else, and much of it exits in two cold currents flanking Greenland (part of the reason Greenland has preserved it's ice sheet).
This difference in ocean currents is the primary factor in differences in heat transport to the poles, which in turn is a major factor in the difference between Arctic and Antarctic ice levels.
There are additional factors, including the facts that:
Of the five factors (ie, difference in heat transport plus the four listed above), it is not clear as to their relative importance, although I think the evidence is stronger for the differences in heat transport being most important (and overwelhming that item 4 in the list is the least important).
So, arriving at a simple answer, coriolis effect explains why the nothern hemisphere is warmer than the southern!!?
bozza @19, there is a coriolis effect in the NH just as in the SH, and vice versa. What causes that effect to have different consequences in the SH than in the NH is the different distributions of land and water; which also has other consequences on climate independent of the coriolis effect. So if you want to reduce it to a simple formula; the NH polar regions are warmer than the SH polar regions because the Arctic is water surrounded by land, while the Antarctic is land surrounded by water. Differences in distribution of land and water also explains the more southerly location of the tropical zone, and the slower loss of temperature with latitude in the SH temperate zone relative to the NH temperate zone.
That said, it is a mistake to reduce things to that level of simplicity. When you do, deniers swoop in and pick out a minor factor claiming it was "ignored by climate scientists" and that "it is the real cause". And although those claims are rubbish, depending for their rhetorical effectiveness on people not having had those other factors discussed before hand, by oversimplifying the scientific story we are just setting people up for those pseudoscientists.
I know it would be a massive project, but I respectfully suggest combing through these excellent "rebuttal" pages and updating them. Several were written years ago, and there is more data now.
The arguments haven't changed, but the graphs and text could be updated to reflect newer data. For example, there have been new sea ice record lows since this article was written.
I know deniers who will whine that things have changed since c. 2011, that trends have "reversed", that sea ice is "recovering". It would be useful, for all the rebuttal pages, to update the data to show these denialist arguments to be as senseless as they are.
[JH] Updating the rebuttal articles is a priority activity for the all-volunteer SkS author team in 2016.
The final nail in myth? A study of long term satellite observations shows that increase in absortion of shortwave due to arctic seaice loss is not being compensated by the Antarctic.
The historical Arctic sea ice reconstruction appears anomalous with the Viking settlements in Greenland In the 10th century. Where they settled then is not habitable today due to ice levels. Anybody up to explain how this can be explained?
Joe @23 , best if you give much more detail about what you mean.
The Norse settlement history of Greenland is a complex multi-layered course of events. Temperature played little part (the medieval warming was only about 0.3 degreesC above the background).
Social and geo-political changes were the main determinants of the settlement's ultimate failure. All interesting. But the late stage sea-ice increase [and we don't really know if it was particularly big] would likely have been a very minor "straw" on the camel's back, compared with all the other disincentives that the Greenland Norse settlements were facing.
Joe @23,

Since the Arctic is my pet hobby horse I'll second Eclectic's request.
I assume you must know the drill? Links to authoritative sources to evidence for your claims would be nice to see, if such are available?
"Where they settled then is not habitable today due to ice levels."?
Wikipedia begs to differ: https://en.wikipedia.org/wiki/Hvalsey_Church