


 Arguments


Global cooling - Is global warming still happening?
What the science says...
| Select a level... |
 Basic
Basic
|
 Intermediate
| |||
|
All the indicators show that global warming is still happening. |
|||||
Climate Myth...
It's cooling
"In fact global warming has stopped and a cooling is beginning. No climate model has predicted a cooling of the Earth – quite the contrary. And this means that the projections of future climate are unreliable." (source: Henrik Svensmark)
At a glance
Earth's surface, oceans and atmosphere are all warming due to our greenhouse gas emissions, but at different rates. Some places are also warming much faster than others: parts of the Arctic for example. That variability is partly because other phenomena act to offset or enhance warming at times. A good example are the effects of La Nina and El Nino, an irregular variation in winds and sea surface temperatures over the tropical eastern Pacific Ocean that can influence temperatures and rainfall patterns right around the world.
El Nino causes even warmer years whereas La Nina tends to peg temperatures back to an extent. Thus 2016 – an El Nino year - was the warmest year on record, according to the USA-based National Oceanic and Atmospheric Administration, but other recent years have not been far behind – 2020 and 2019 are in second and third place respectively. The worrying thing is that 2019 only saw a mild El Nino and 2020 was “neutral” - there were neither El Nino or La Nina conditions. And even with a La Nina featuring, 2021 and 2022 were, respectively, still the seventh and sixth hottest years on record.
The year 1998 featured a massive El Nino and consequent temperature spike that was a strong outlier, well above the steady upward trend. That spike and the subsequent return to a more “normal” warming pattern led to claims in the popular media that global warming had “paused” or had even stopped. This was a typical misinformation tactic that, as usual, time has proved wrong. As things currently stand, the top ten warmest years have all been since 2010 and 1998 is nowhere to be seen any more. By modern standards, it simply wasn't warm enough.
Please use this form to provide feedback about this new "At a glance" section. Read a more technical version below or dig deeper via the tabs above!
Further details
In the years following 1998, at the time the hottest year on record, there was a concerted misinformation campaign to convince the public that global warming had variously slowed down, stopped or even that we were entering a period of cooling. Of course, we now know that such claims were nowhere near correct. In today's top ten ranking of warmest years, the year 1998 is nowhere to be seen. It simply wasn't warm enough. So let's take a look at how the claims came about, because they reveal insights into the methodology of those who design and spread misinformation.
The entire planet continues to accumulate heat due to the energy imbalance created through our greenhouse gas emissions. Earth's atmosphere is warming. Oceans are accumulating energy. Land absorbs energy and ice absorbs heat to melt. Year to year ups and downs in these things are simply noise, reflecting variations in how that heat is moved around the planet and what other influences are at work, such as the irregular El Nino Southern Oscillation (ENSO) that can nudge the global temperature one way or another by up to 0.3C. That's why 1998 was such a warm outlier: it coincided with a very strong El Nino. El Nino conditions always warm things up whereas La Nina conditions cool things down (figure 1).
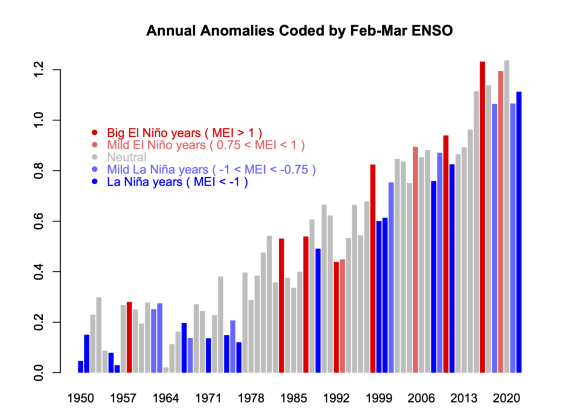
Figure 1: GISTEMP anomalies (with respect to late 19th Century), coded for ENSO state in the early spring - red is El Nino, blue La Nina. Graphic courtesy of Realclimate.
Climatologists routinely use multi-decadal blocks of time when presenting temperature trends for a very good reason. Such blocks allow you to stand back and look at the bigger picture. Due to the noise, taking a much shorter time-span – say just five or ten years – allows you to say anything you like about trends, depending on the particular block you pick.
For example, if you picked a short run of 5-10 years ending in 1998, you could have – if you were so inclined – said, “look how fast it's warming!” Likewise, taking a number of years starting with 1998, you could have made the equally invalid claim that global warming had stopped. And of course, that claim was made, vociferously, in the early-mid 2000s. It was a classic example of cherry-picking: the manifestly unscientific practice of choosing the data that supports the argument one is paid to make on behalf of those who sponsor misinformation campaigns. Once you know about such tricks, you can challenge them yourself. You can ask someone why they showed such a short temperature record when showing a much longer one is the normal practice.
It is difficult but technically possible to filter out the noise described above from temperature datasets. In the paper Foster and Rahmstorf (2011) the authors used the statistical technique of multiple linear regression to filter out the effects of ENSO, solar and volcanic activity (Figure 2). They found that the underlying global surface and lower atmosphere warming trends have in fact remained steady in recent years. There's still noise in there but nowhere near as much. We were still warming all along.
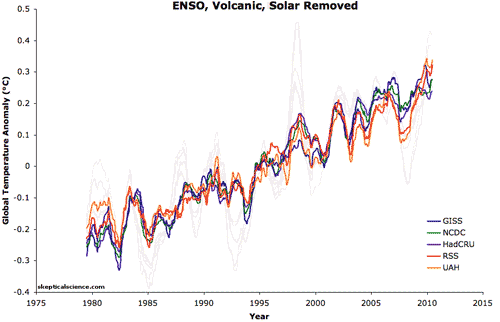
Figure 2: Five datasets of global surface temperature and lower troposphere temperature are shown before and after removing the short-term effects of the El Niño Southern Oscillation (ENSO), solar variability, and volcanic aerosols. A 12-month running average was applied to each dataset.
Last updated on 12 May 2023 by John Mason. View Archives


Climate's changed beforeWhat bothers me in the "Escalator" is the time scale. From 1970 to 2022 the temperatures rise, yes.
But this is not incompatible with a cooling at geological time scales. We may be in a rising part of the curve which will go down and over several 1000s of years the average will show a cooling trend.
The scale of time can be used and the curves can defend both arguments. Therefore the "escalator" is of no use.
The only pure fact in all the climate change saga is that humans are producing greenhouse gasses.
From that fact a whole theory of climate has been built. It is very difficult to say things like that without being insulted today.
[PS] The escalator is counter-argument to "it cooling" every time there is a couple of El ninos. If you want to look at geological timescales please go to this article. In fact there are many tools to tease out other climate forcings. The IPCC reports have excellent chapters on these, summarizing the very extensive scientific literature. If you want to talk about geological timescales, please comment on the article I referenced, not here.
CORK... "But this is not incompatible with a cooling at geological time scales."
What's important to understand is that warming or cooling, on whatever scale, is due to physical processes, most of which are at least fairly well understood by researchers.
The Escalator graphic is demonstrating there are inherent variations in the surface temperature trend. This makes sense when you understand that short term changes surface temperature is a function of energy going into and coming out of the earth's oceans.
The Escalator graphic is presented to explain how "skeptics" will use very short trends in global temperature to claim the "globe" has stopped warming, when nothing could be further from the truth.
The earth, on the whole, is rapidly warming primarily due to increasing atmospheric concentrations of greenhouse gases. That fact is true regadless the short term rate of warming at the surface.
CORK to "Response".
Thank you for your comment.
I had actually read "What does past climate change tell us about global warming?" extensively a few months ago and the idea that the warming anomaly of the last 150 years may not show up on a graph at a different scale of time for the future climatologists of year 22023 was scratching my at my patience slowly.
If the warming of the last 150 years is really a global warming trend it will be seen, even at a larger scale of time in 20 000 years, but at the scale of time used for today's events which is about a 1cm for 100 years it may be given an importance it may have not.
In a nutshell, and aknowledging that I do not think that measuring temperatures alone can confirm a human made global warming, I beleive that the hockey cross graph is counter productive in trying to open minds.
Cork @328 :
Your actual message is not at all clear. You seem to be saying that global warming (or cooling) cannot be assessed by measuring temperatures ~ and at the same time, global warming does not exist unless it shows out clearly on a graph of temperature/time (of any scale).
That sounds more Lewis Carroll than common sense. And so I must deduce that you are not explaining yourself at all well.
Please clarify what you mean.
Eclectic @329
My apologogies for sounding confused. English is not my native language.
"You seem to be saying that global warming (or cooling) cannot be assessed by measuring temperatures":
The anomaly of the temperatures of the last 150 years may just be an anomaly.
How can we be certain that anomalies of temperature did not occur a million year ago or before, when the only sparse data that we have for these times are estimated by proxi?
We compare averaged estimated data (of the geological times) to the measures of today. That does not make sense to me.
CORK @ 330:
I see. You're in the group of people that say "how could we possibly know what happened in the distant past?
The simple answer to why the current warming is due to human emissions of CO2 is "physics". We do have information on past climates through geology - combined with understanding the physics involved. We know what physics can and has affected climate in the past, and we know that those processes do not explain the current warming - unless you also include the effect of CO2.
But as the moderator told you in comment 327 - this is getting off topic for this discussion. The moderator pointed you to the thread on past climates. Another post you may benefit from reading is the one on the Empirical evidence that humans are causing global warming.
Bob Loblaw @331
I am not part of a group, thank you.
I'm going to Past Climates. Apologies.
Bob Loblaw @331
The simple answer to why the current warming is due to human emissions of CO2 is "physics". We do have information on past climates through geology - combined with understanding the physics involved. We know what physics can and has affected climate in the past, and we know that those processes do not explain the current warming - unless you also include the effect of CO2.
Yes, I know all this.
That's exactly my point: explain Climate change to the wider public with that type of information. Not with hockey cross curves that can easily be criticised.
Now, good bye.
CORK @ 332:
You don't need to join a group to be part of it. You don't even need to be aware that your actions and viewpoints are shared with a larger group.
@33:
The hockey stick is one of many forms of evidence that tells us the current warming is unusual. Like anything else, it can easily be criticized by the uniformed. Should you wish to discuss the hockey stick, this thread is the place to go.
Cork @330 : I would answer slightly differently from Bob Loblaw ~ and I hope I may give my answer here in this thread, for the sake of continuity.
English language has horrible spelling, and an overly-rich vocabulary (which can be useful for nuances of meaning, as well as for the artistic appeal of literary style). Nevertheless the English language, like most other languages (possibly excepting Japanese? ) can also be used in a simple effective manner - like a hammer - to convey ordinary meanings.
Cork, my protest was not against your literary style, but against the ideas that you wrote.
For example, your sentence: "The anomaly of the temperatures of the last 150 years may just be an anomaly." There are technical scientific meanings of "anomaly". Here it is not clear what you mean by an "anomaly" ~ but you seem to be using the word anomaly in its ordinary Oxford Dictionary sense of: "irregularity, deviation from the common or natural order, exceptional condition or circumstance".
If you meant that sort of anomaly . . . then yes, the sudden steep temperature rise in the last 150 years, is certainly an anomaly.
Permit me to answer your question this way ~ by this example :- You, Cork, are walking on a sandy beach; you are alone and no-one is in sight. The sand is pure and white. And then you see a gold coin lying on the beach. The gold coin is an anomaly. You know that there is an explanation for this anomaly ~ someone has dropped the coin there (it did not get there without a mechanism causing a coin to be present).
Likewise, we know the mechanism of rapid rise of CO2 producing the anomalous modern spike in temperature.
Our proxy records of temperature a million or ten million years past, are "smoothed together" over thousands of years, and will not show a sudden short spike (as rapid as our modern spike). Perhaps there were some (few) sudden spikes in ancient geological times ~ but, like the gold coin on the beach, there would need to be a mechanism which produced a spike. And our knowledge of geology and physics tells us that such spike-mechanisms must have happened very rarely.
The important point is that we now have a modern anomaly ~ a rapidly rising temperature, and we know it will continue to rise (since we know the mechanism). And we must tackle this problem. [My apology for this long answer : but I can be more verbose, if you wish ! ]
In the last GIEC report a difference is made between CO2 records in geological times: C02 would raise 1000 years after the spike in temperature (melting of ice and erosion of sediments etc... = delayed release) and CO2 records in recent times, CO2 increasing 50 years before a spike in temperatures. And they insist that both phenomenons occur at the same time of course and may feed each other.
Over the last 150 years, the spike in temperatures occurring after a spike in CO2 would be very bad news indeed.
Cork @336 ,
Merci , for your Cedric Ringenbach reference link, on the other thread ("Climate's Changed Before" = Most Used Climate Myths No. 1. )
Ringenbach's concerns over the contradiction of temperature/CO2 lag . . . are greatly discussed on Most Used Climate Myths No. 12 ~ which is accessed on the top left corner of this page (which you may already be aware of).
Oui, merci.
[PS] As previously stated, this is off-topic. You are welcome to post comments on the relevant threads and you have indicated that you have in fact looked over the "Climate's changed before" thread. If you want to continue that discussion and dispute the debunking of this and other papers offered there, then do it on that thread not here. Offtopic comments get deleted.