Climate Science Glossary

Term Lookup

Enter a term in the search box to find its definition.

Settings

Use the controls in the far right panel to increase or decrease the number of terms automatically displayed (or to completely turn that feature off).

Term Lookup

Settings


All IPCC definitions taken from Climate Change 2007: The Physical Science Basis. Working Group I Contribution to the Fourth Assessment Report of the Intergovernmental Panel on Climate Change, Annex I, Glossary, pp. 941-954. Cambridge University Press.

Home Arguments Software Resources Comments The Consensus Project Translations About Support

Twitter Facebook YouTube Mastodon MeWe

RSS Posts RSS Comments Email Subscribe


Climate's changed before
It's the sun
It's not bad
There is no consensus
It's cooling
Models are unreliable
Temp record is unreliable
Animals and plants can adapt
It hasn't warmed since 1998
Antarctica is gaining ice
View All Arguments...


Username
Password
New? Register here
Forgot your password?

Latest Posts

Archives

Global cooling - Is global warming still happening?

What the science says...

Select a level... Basic Intermediate

Empirical measurements of the Earth's heat content show the planet is still accumulating heat and global warming is still happening. Surface temperatures can show short-term cooling when heat is exchanged between the atmosphere and the ocean, which has a much greater heat capacity than the air.

Climate Myth...

It's cooling

"In fact global warming has stopped and a cooling is beginning. No climate model has predicted a cooling of the Earth – quite the contrary. And this means that the projections of future climate are unreliable." (source: Henrik Svensmark)

To say we're currently experiencing global cooling overlooks one simple physical reality - the land and atmosphere are only one small fraction of the Earth's climate (albeit the part we inhabit). Global warming is by definition global. The entire planet is accumulating heat due to an energy imbalance. The atmosphere is warming. Oceans are accumulating energy. Land absorbs energy and ice absorbs heat to melt. To get the full picture on global warming, you need to view the Earth's entire heat content.

Church et al. (2011) extends the analysis of Murphy et al. (2009) which calculated the Earth's total heat content through to 2003. This new research combines measurements of ocean heat, land and atmosphere warming and ice melting to find that our climate system continued to accumulate heat through to 2008.
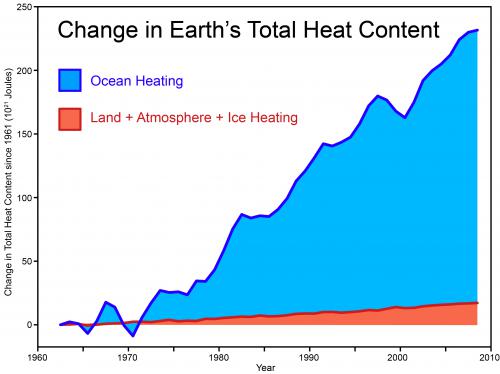

Figure 1: Total amount of heat from global warming that has accumulated in Earth's climate system from 1962 to 2008, from Church et al. (2011).  Also see this graphic that shows the ocean heating in two layers, 0-700 meters and 700-2000 meters deep.

A look at the Earth's total heat content clearly shows global warming has continued past 1998. So why do surface temperature records show 1998 as the hottest year on record? Figure 1 shows the heat capacity of the land and atmosphere are small compared to the ocean (the tiny brown sliver of "land + atmosphere" also includes the heat absorbed to melt ice). Hence, relatively small exchanges of heat between the atmosphere and ocean can cause significant changes in surface temperature.

In 1998, an abnormally strong El Nino caused heat transfer from the Pacific Ocean to the atmosphere. Consequently, we experienced above-average surface temperatures. Conversely, the last few years have seen moderate La Nina conditions which had a cooling effect on global temperatures. And the last few months have swung back to warmer El Nino conditions. This has coincided with the warmest June-August sea surface temperatures on record. This internal variation where heat is shuffled around our climate is the reason why surface temperature is such a noisy signal.

Figure 1 also underscores just how much global warming the planet is experiencing. Since 1970, the Earth's heat content has been rising at a rate of 6 x 10²¹ Joules per year. In more meaningful terms, the planet has been accumulating energy at a rate of 190,260 gigawatts. Considering a typical nuclear power plant has an output of 1 gigawatt, imagine 190,000 nuclear power plants pouring their energy output directly into our oceans. Our climate is still accumulating heat. Global warming is still happening.

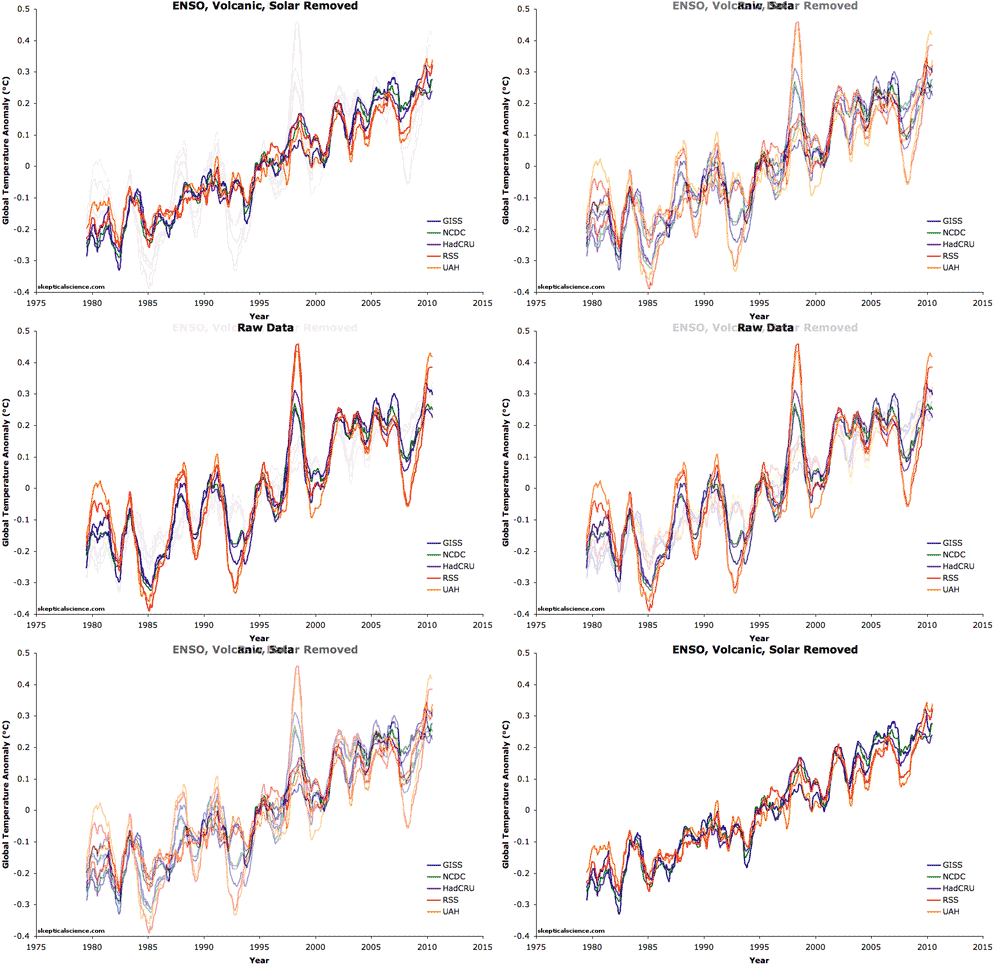
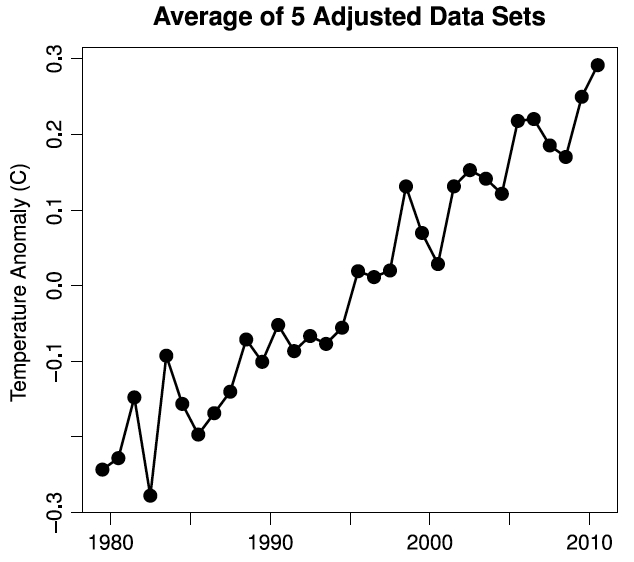
Moreover, even if we focus exclusively on surface and lower atmosphere temperatures, the warming continues.  Foster and Rahmstorf (2011) used multiple linear regression to filter out the effects of the El Niño Southern Oscillation (ENSO), and solar and volcanic activity (Figure 2), and found that the underlying global surface and lower atmosphere warming trends have remained very steady in recent years (Figure 3).

before/after filtering

Figure 2: Five datasets of global surface temperature and lower troposphere temperature are shown before and after removing the short-term effects of the El Niño Southern Oscillation (ENSO), solar variability, and volcanic aerosols.  A 12-month running average was applied to each dataset.

figure 8

Figure 3: Average of all five data sets (GISS, NCDC, HadCRU, UAH, and RSS) with the effects of ENSO, solar irradiance, and volcanic emissions removed (Foster and Rahmstorf 2011)

intermediate rebuttal written by LarryM


Update July 2015:

Here is a related lecture-video from Denial101x - Making Sense of Climate Science Denial


Last updated on 5 July 2015 by pattimer. View Archives

Printable Version  |  Offline PDF Version  |  Link to this page

Argument Feedback

Please use this form to let us know about suggested updates to this rebuttal.

Related Arguments

Further reading

Update

On 21 January 2012, 'the skeptic argument' was revised to correct a minor formatting error.

Denial101x video

Here is a related video lecture from Denial101x - Making sense of climate science denial

Comments

1  2  3  4  5  6  7  8  9  10  11  12  13  14  Next

Comments 1 to 25 out of 338:

  1. Not only does this site have depth and clarity, you're a model of how to present facts without demonizing those with contrary views. Thanks!
  2. Thank you for a website that provides information without a political agenda. I would like to understand the global warming debate without feeling like I am being manipulated by someone with a political agenda and most web-sites seem to promote an agenda for one side or the other. Thanks.
  3. It is worth looking at fig 6 in Trenberth's paper...it shows ocean heat content derived from 4 sources; GODAS, JMA, ECCo-GECCO & ECCO-GODAE. Two data sets show an increasing trend in OHT and two show the beginning of a steep decline. You can download the ECCO report from http://www.ecco-group.org/pdfs/reports/report44.pdf and compare it with the graphs from GODAS ( Google Meridional Overturning Circulation Simulated by NCEP GODAS...quick view). GODAS seems to show warming is essentially confined to the North Atlantic..the tropics and N. pacific show no trend, whilst the S pacific, S. Indian and S. Atlantic show steep declines since around 2006. So which do we believe??
  4. i'm new to this and i'm a skeptic. however, i'll admit that the planet is still warming. using satellite data from UAH and RSS, if you look at the past decade or so including 1998, it shows a cooling trend. however, if you remove the 1998 el nino freak year, the planet is still warming at a similar rate to pre-1998.
  5. Great work, just a slight niggle: "Considering a typical nuclear power plant has an output of 1 GigaWatt, imagine 190,000 nuclear power plants pouring their energy output directly into our oceans." A decent sized nuclear power plant is 1 GWe, which at a 33% thermal efficiency, is close to 3 GWt. 190 TWt of energy going into the ocean each year is closer to the heat output of 65,000 1 GWe nuclear power plants.
  6. If the ocean has warmed to this extent, it must surely have expelled many millions of extra tonnes of CO2 into the atmosphere. Has this new stream been detected at Mauna Loa? And does it advance the expected date for reaching the fateful 450ppm?
  7. I'm a first time visitor to this site and I'm impressed. (Understanding any of the science of global warming from the general press is futile!) I'll offer an answer and a question here: Australis: Just because the ocean has absorbed so much heat does not not mean that its temperature has increased a lot. That is because water has a high specific heat capacity. A few degrees of warming does imply that water could hold (at maximum) less CO2; however its CO2 content is largely a function of the equilibrium with the atmosphere. As atmospheric CO2 concentrations rise, the oceans will continue to absorb more CO2 despite their increasing temperatures. (Once they get close to carbonated water as we find in soft drinks, then a few degrees of temperature change could make a big difference! :-P ) And now my question: Figure 1 could also be used to advance the idea that the oceans have a tremendous ability to buffer us (on land) from global warming, and that while things may change, the consequences may be overstated. I know there are potential holes in that reasoning, but I'd appreciate links to science addressing the extension of this topic to the potential impacts. Thanks!!
  8. Hello, this is my first comment on this page. My question: Wouldn't it be possible that the heat contet of oceans rise even after radiative forcing has stopped changing? I would assume that the "response time" of oceans to global warming is much longer than that of the atmosphere because of the drastic differences in their heat capacities.
  9. tulkki, regarding lag: Appetizer 1: It’s the sun, but skip down to the section "Ocean Thermal Inertia." Note that there is a ten-year lag from solar increase. Not 50 years. Appetizer 2: It’s the ocean. Main Course: How we know global warming is still happening
  10. ''The atmosphere is warming'' My understanding is that is not warming enough to be able to confirm that an increased greenhouse effect is causing global warming. Also it's not warming enough in the right area which is supposed to be in the Troposphere at around 10km. Has this suddenly changed? Also regarding ''Oceans are accumulating energy'' Some 3,000 scientific robots that are plying the ocean have sent home a puzzling message. These diving instruments suggest that the oceans have not warmed up at all over the past four or five years. That could mean global warming has taken a breather. Or it could mean scientists aren't quite understanding what their robots are telling them But Josh Willis at NASA's Jet Propulsion Laboratory says the oceans are what really matter when it comes to global warming. In fact, 80 percent to 90 percent of global warming involves heating up ocean waters. They hold much more heat than the atmosphere can. So Willis has been studying the ocean with a fleet of robotic instruments called the Argo system. The buoys can dive 3,000 feet down and measure ocean temperature. Since the system was fully deployed in 2003, it has recorded no warming of the global oceans
    Response: Josh Willis is right. Over 90% of global warming goes into the oceans. Some studies of upper ocean heat (using the "3000 robots" that comprise the Argo network) have shown cooling over the last few years during a time when the Pacific has transitioned from El Nino to La Nina conditions. However, when the Argo data is examined to greater depths, down to 2000 metres, it's seen that the ocean is still accumulating heat (von Schuckmann 2009):

  11. John Cook: Comparing the OHC results from the: 1)Upper 700 meters : 0.089 Wm^−2 (data source:http://climexp.knmi.nl/daily2longer.cgi, and the trend obtained in EXCEL) 2)Upper 2000 meters: 0.77 ± 0.11 Wm^−2 It is clear that the heat was sequestered in the Deep Oceans by the Termohaline Circulation, and that explain why the SST warming trend was near zero between 2003 and 2008. From this numbers is clear that if the Termohaline Circulation Shut Down then a BLAST OF HEAT will occur in the Upper Ocean and Atmosphere. Is there any current Climate Model of how much the warming will accelerate if the Termohaline Circulation Shut Down?
  12. IPCC projections disproved. As a result, CO2 has nothing to do with global warming.
  13. selti, you are wrong about the IPCC projections being disproved. See Comparing IPCC projections to observations. If that's not detailed enough for you, click on the link that's in that post, to Tamino's related post.
  14. #13 Tom Dayton How could I be wrong as I used the data without any spin. Here are the data for the mean global temperature anomaly for the Hadley center. Year=>anomaly (deg C) 2005=>0.47 2006=>0.42 2007=>0.40 2008=>0.33 And the chart itself is from IPCC 2007 WG1-AR4. I am not wrong. The IPCC projections are deadly wrong.
  15. There is no global warming that is taking place at the moment. Here is a chart for the mean global temperature anomaly from the Hadley center. The above graph shows a linear warming of 0.44 deg C/ Century, and superimposed on this linear warming there is an oscillating component that moves up and down about the linear trend line. The linear warming of 0.44 deg C/ Century is only 0.004 deg C/ year. As a result, this linear warming is insignificant when looking at mean global temperature trends at the moment. To look at mean global temperature trends, this linear warming of 0.004 deg C/ year can be removed by de-trending the anomaly, which gives the oscillating global temperature anomaly pattern. This pattern shows global cooling and warming phases of about 30 year duration, and the current trend is global cooling until 2030. There is no global warming that is taking place at the moment.
  16. selti, the only thing your graph shows is that a linear trend from 1880 is not adequate to describe the actual temperature trend, let alone prove the existence of a periodic oscillation. Indeed, there's no cycle. Although in some (rare) cases it is possible to do a statistical-only analysis of physical phenomena, it needs to be done appropiately.
  17. #16 Riccardo There is a cycle! The cycle is approximate 30 years of warming followed by 30 years of cooling. Cooling phase from 1880s to 1910s. Warming phase from 1910s to 1940s. Cooling phase from 1940s to 1970s. Warming phase from 1970s to 2000s. And the current cooling phase from 2000s to 2030s. No more spin please. The data is cyclic.
  18. selti, your link "The IPCC projections are deadly wrong" is to an IPCC chart whose ranges of model runs (the shaded areas) and the observed data (the black dots and line) go up only to 2005. The black line for HADCRUT3 observed temperatures smoothed has been extended beyond that not by the IPCC, but by someone who modified (doctored, faked, falsified, as in Elvis with Bigfoot) the graph but adding an unsmoothed line! Perhaps the added black dots after 2005 really are the observed anomalies, but the line's extension is not smoothed across the dots! The resulting and false impression is that the smoothed line dove after 2005. The actual smoothed line makes a much shallower dip after 2005, especially if you add 2009 data. If you want to look at smoothed data then you must smooth it all the way from 1990 through 2008. If you want to look at unsmoothed data then you must look at unsmoothed data across all years, by ignoring the black line and just looking at all the black dots starting in 1990 and going up through 2008. If you want to draw a line from dot to dot you must do so for all the dots starting in 1990, not just starting in 2006. You must also look at either the line or the dots within the range of projections (the shaded areas) beyond 2005. That is shown on RealClimate in the post Updates to Model-Data Comparisons. Guess what? Observations are within the bounds of the projections!
  19. #18 Tom Dayton What I am comparing is the data after 2005. For all the data points after 2005, the actual anomaly measured observations are BELOW the anomaly projections with CO2 restricted at the 2000 level: Year Measured (deg C) Projections (deg C) 2005 0.47 0.45 2006 0.42 0.47 2007 0.40 0.48 2008 0.33 0.52 As a result, the IPCC projections are utterly wrong.
  20. #18 Tom Dayton What I am comparing is the data after 2005. For all the data points after 2005, the actual anomaly measured observations are BELOW the anomaly projections with CO2 restricted at the 2000 level:
    Year Measured (deg C) Projections (deg C)
    2005 0.47 0.45 2006 0.42 0.47 2007 0.40 0.48 2008 0.33 0.52
    As a result, the IPCC projections are utterly wrong. Are you asking you me to believe you and deny my own lying eyes?
  21. selti: Look at the forest, not the individual trees.
  22. #21 Tom Dayton. Sooner than later, it will be established that CO2 driven global warming is the greatest scientific stuff up of all times. The stuff up is caused by assuming the temperature rise from 1970 to 2000 was unprecedented. Actually, as shown in this oscillating anomaly, this rise in temperature is similar to those at the end of 1880s and 1940s. Once the oscillating anomaly reaches its maximum it reverses and the cooling phase starts.
  23. selti, i'm afraid you didn't even bother to look at how a cycle is define and identified from the links i gave you. Indeed, statistics is no joke, just looking at a couple of up and downs does not define a cycle. It looks like you are following a pre-defined idea and do not care of contrast it with science. Do you have any physical _and_ statistical reason to claim that there is a cycle, other than looking at a couple of up and downs?
  24. "How do we find out what's happened from 2003 until now? Unfortunately, there is no time series (that I know of) of the planet's total heat content up to present time." Information from Sydney Levitus, Geophysical Research Letters, 2009 shows that for past few years the heat content of the oceans has not been rising (rising sea level in that period can be accounted for by runoff; not temperature.) This is what Trenberth and Latif have been referring to. Basically the books don't balance. I appreciate that not everyone places a high faith in satellite measurements, but they all say that the earth has been absorbing more energy during that time. If so, it has to show up somewhere and the mystery is that it hasn't. Latif seems to think it's in the oceans. Probably more sensible than any other alternative. But he acknowledges that we don't understand enough about the natural forcing elements. To me this also raises serious doubts that we really can get a true average measurement of ocean heat content. To those of us who believe that scientific skepticism is healthy, it would seem to be a mistake to conclude that we know the earths total heat content is still rising without looking for alternative answers to the mystery.
    Response: Levitus' data covers only the upper ocean heat which shows more variability than the total ocean heat. Measurements of ocean heat down to 2000 metres deep show that the oceans are still accumulating heat.
  25. Doug Cannon, in your comment i found two different concepts mixed arbitrarly, short versus long term variability. If, with Tremberth, we can't say where the heat has gone on a sesonal or yearly basis, the same does not apply to longer periods. You are not allowed to do this extrapolation. Even worst, you cannot conclude that "we don't understand enough about the natural forcing elements." unless by "enough" you mean, for example, the timing of next El Nino and its strength or the like. Skepticism is definitely healthy and is at the very core of the progresses of science; misinterprenting or disregarding what is known is not.

1  2  3  4  5  6  7  8  9  10  11  12  13  14  Next

Post a Comment

Political, off-topic or ad hominem comments will be deleted. Comments Policy...

You need to be logged in to post a comment. Login via the left margin or if you're new, register here.

Link to this page


The Consensus Project Website

THE ESCALATOR

(free to republish)


© Copyright 2024 John Cook
Home | Translations | About Us | Privacy | Contact Us