Climate Science Glossary

Term Lookup

Enter a term in the search box to find its definition.

Settings

Use the controls in the far right panel to increase or decrease the number of terms automatically displayed (or to completely turn that feature off).

Term Lookup

Settings


All IPCC definitions taken from Climate Change 2007: The Physical Science Basis. Working Group I Contribution to the Fourth Assessment Report of the Intergovernmental Panel on Climate Change, Annex I, Glossary, pp. 941-954. Cambridge University Press.

Home Arguments Software Resources Comments The Consensus Project Translations About Support

Twitter Facebook YouTube Mastodon MeWe

RSS Posts RSS Comments Email Subscribe


Climate's changed before
It's the sun
It's not bad
There is no consensus
It's cooling
Models are unreliable
Temp record is unreliable
Animals and plants can adapt
It hasn't warmed since 1998
Antarctica is gaining ice
View All Arguments...


Username
Password
New? Register here
Forgot your password?

Latest Posts

Archives

Billions of Blow Dryers: Some Missing Heat Returns to Haunt Us

Posted on 23 September 2010 by Doug Bostrom

"The heat will come back to haunt us sooner or later..." --Kevin Trenberth, referring to our inability over the past 5 years to locate half a watt per square meter per year of energy accumulated on Earth as a result of anthropogenic warming of the planet, approximately half of the expected warming signal.

It's a sad fact that while Earth's oceans are expected to absorb the vast majority of anthropogenically induced imbalance of the global energy budget, our physical observations of the caloric state of the deep ocean are conspicuously sparse when compared to daily remote sensing revisitations enjoyed by research subjects amenable to orbital remote sensing platforms. In some ways our instrumentation of such far-flung places as Mars and Venus is better than what we deploy here on Earth in the abyssal depths. While we have solid theoretical grounding for predicting storage of excess heat in the ocean, without the means to directly measure and accurately quantify this effect we're left missing not only heat but also a useful means of testing and validating predictions of climate sensitivity to forcing.  

As our technical capacities have risen to the challenge of dealing with an environment arguably more hostile to instrumentation than near-Earth orbital space, oceanographers at last are enjoying some of the same physical and scientific advantages as those long enjoyed by scientists working with space-based remote sensing platforms. The semi-autonomous Argo array represents a huge leap forward in our understanding of the characteristics of the upper ocean. With respect to anthropogenic climate change, of late we've been treated to increasingly dense and accurate measurements of upper ocean heat content, greatly refining our ability gather this important data.

Unfortunately the present Argo implementation is depth-limited and we thus still have no automated systems in place for data retrieval from the slightly over one half of the ocean inaccessible to robotic probes. For this majority of ocean volume we still must rely on hardy investigators "going down to the sea in ships, that do business in great waters." We landlubbers wondering about "missing heat" and suspecting it may be found in the ocean can only be patient as we wait for salt-crusted mariner scientists to return to shore and write up their results.

The main reason for lamentation of  "Trenberth's Travesty" is the declining upward pace over the past 5 years of the portion of ocean heat content (OHC) we're readily able to measure. We know that sea level rise (SLR) is principally caused by both thermal expansion of the oceans and water mass contributed by continued melting of terrestrial ice. Terrestrial ice alone cannot account for the continuing sea level rise we see in the face of the slackened pace of upper ocean warming.  Juxtaposing continuing sea level rise  against OHC we don't observe, we're left with a substantial technical mystery, an inability to "close the budget" of SLR as well as an inability to specifically account for the final destination of heat we know is accumulating on the planet ( Willis 2008 ). Failing the unlikely emergence of some new mechanism able to cause SLR, we may say with reasonable confidence that continued SLR can at least partially be attributed to accumulating OHC we can't directly "see," but merely saying so is no substitute for direct measurements.

Now we may say some significant progress has been made in tracking down "missing heat." In Journal of Climate Sarah Purkey of the University of Washington and NOAA's Gregory Johnson  report on an ambitious project to quantify heat being stored in the abyssal ocean ( Warming of Global Abyssal and Deep Southern Ocean Waters Between the 1990s and 2000s: Contributions to Global Heat and Sea Level Rise Budgets ). By revisiting abyssal stations included in the World Ocean Circulation Experiment (WOCE) conducted in the 1990s, about 20% of Trenberth's famous "missing heat" appears to have been tracked down, found to be slowly traveling north from the Southern Ocean.

While integrating these new measurements into the global heat budget does not entirely close our observational gap, by producing their results Purkey and Johnson have crisply demonstrated how vast amounts of heat may have been left out of the budget for the simple reason of previously being invisible. Their work is also a compelling case for improving our capability to routinely measure with less extraordinary effort the majority of ocean volume we're presently forced to ignore when accounting for accumulation of heat. Finally, it seems reasonable to conclude that these measurements bolster our confidence in SLR as a proxy for increasing OHC. 

Purkey and Johnson's abstract: 

We quantify abyssal global and deep Southern Ocean temperature trends between the 1990s and 2000s to assess the role of recent warming of these regions in global heat and sea level budgets. We compute warming rates with uncertainties along 28 full-depth, high-quality, hydrographic sections that have been occupied two or more times between 1980 and 2010. We divide the global ocean into 32 basins defined by the topography and climatological ocean bottom temperatures and estimate temperature trends in the 24 sampled basins. The three southernmost basins show a strong statistically significant abyssal warming trend, with that warming signal weakening to the north in the central Pacific, western Atlantic, and eastern Indian Oceans. Eastern Atlantic and western Indian Ocean basins show statistically insignificant abyssal cooling trends. Excepting the Arctic Ocean and Nordic seas, the rate of abyssal (below 4000 m) global ocean heat content change in the 1990s and 2000s is equivalent to a heat flux of 0.027 (±0.009) W m–2 applied over the entire surface of the Earth. Deep (1000–4000 m) warming south of the Sub-Antarctic Front of the Antarctic Circumpolar Current adds 0.068 (±0.062) W m–2. The abyssal warming produces a 0.053 (±0.017) mm yr–1 increase in global average sea level and the deep warming south of the Sub-Antarctic Front adds another 0.093 (±0.081) mm yr–1. Thus warming in these regions, ventilated primarily by Antarctic Bottom Water, accounts for a statistically significant fraction of the present global energy and sea level budgets. 

In an interview, coauthor Gregory Johnson expressed the amount of heat identified in this study in amusingly prosaic terms: the newly located reservoir of energy is akin to what would be liberated by loading every man, woman and child on Earth with five 1,400 watt hairdryers each and running those appliances continuously for the 20 year interval between measurements. 

Purkey and Johnson's results, mapped:


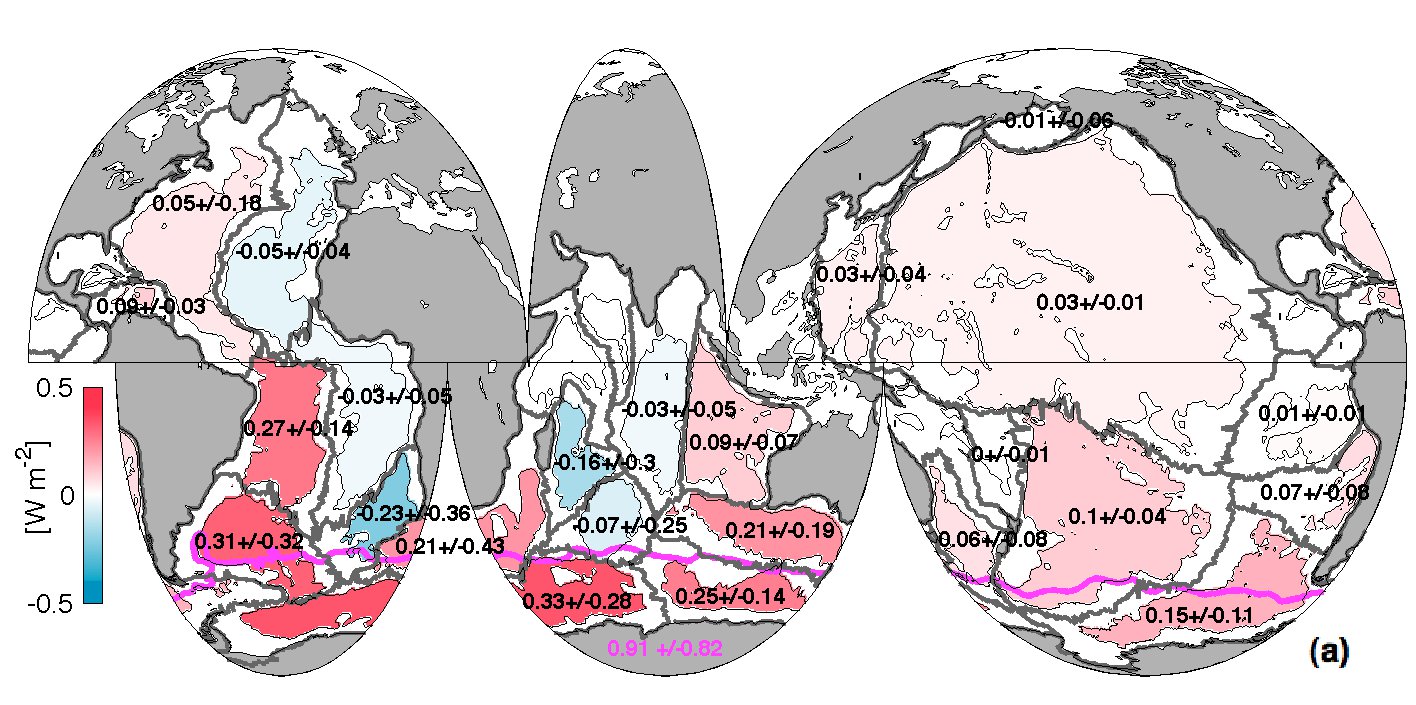
"Mean local heat fluxes through 4000 m implied by abyssal warming below 4000 m from the 1990s to the 2000s within each of the 24 sampled basins (black numbers and colorbar) with 95% confidence intervals and the local contribution to the heat flux through 1000 m south of the SAF (magenta line) implied by deep Southern Ocean warming from 1000–4000 m is also given (magenta number) with its 95% confidence interval." (Purkey and Johnson, 2010)

How can Antarctic Bottom Water (AABW) influence abyssal temperatures so far north of the Antarctic? To understand this, it's helpful to grasp the huge role in deep ocean circulation played by the Southern Ocean and the Antarctic. AABW is derived from enormous quantities of chilled, relatively saline and thus dense water sinking at the extreme south of the globe, in Antarctic waters. This mass of dense water is relatively free to travel north, first plunging off the Antarctic continental shelf and then hugging the bottom as it displaces warmer water. AABW is steered by bottom topography and Coriolis forces and only ceases moving and thus influencing abyssal temperatures when it has reached equilibrium density with surrounding water. Even after traveling some 60 degrees north of its source, density differences are still large enough to drive substantial amounts of AABW past the circulation barrier imposed by the equator, thus permitting diminished but still measurable circulation effects of AABW to be measured in the abyssal depths of the Northern Hemisphere. 

A pair of illustrations of Antarctic and Southern Ocean circulation may be helpful in understanding the process of AABW transport.  

 
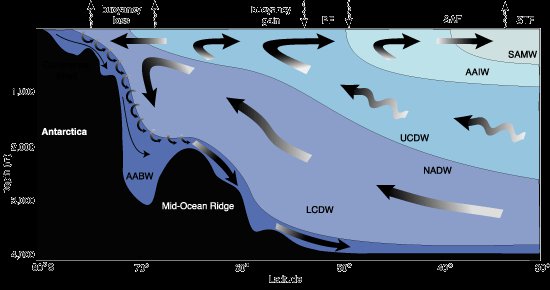
"South (left) to north (right) section through the overturning circulation in the

Southern Ocean. South-flowing products of deep convection in the North Atlantic are converted into upper-layer mode and intermediate waters and deeper bottom waters and returned northward. Marked are the positions of the main fronts (PF – Polar Front; SAF – Sub-Antarctic Front; and STF – Subtropical Front), and water masses (AABW – Antarctic Bottom Water; LCDW and UCDW, Lower and Upper Circumpolar Deep Waters; NADW – North Atlantic Deep Water; AAIW – Antarctic Intermediate Water and SAMW – Sub- Antarctic Mode Water)" (Figure 1.9, SCAR "Antarctic Climate Change and the Environment" )

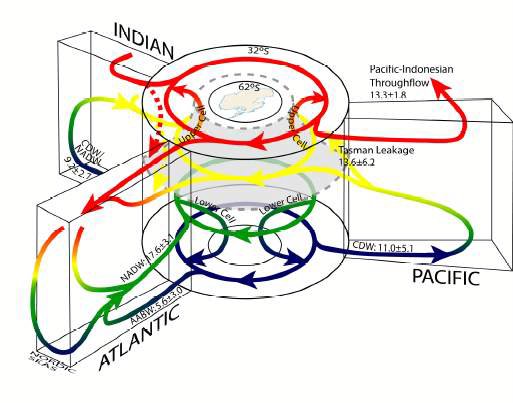
Role of Southern Ocean in global circulation ( Lumpkin and Speer, 2007 ) 

One might wonder, if AABW circulation is driven partly by the relative density of water chilled in the Antarctic, won't distribution of this water change as deep waters warm in response to heating by AABW circulation, thus robbing AABW of some of its physical transport impetus? This does seem to be the case; for instance, the interface between AABW and North Atlantic Deep Water (NADW) has deepened over the past few decades and as well there are indications of diminished abyssal circulation in regions of the North Pacific influenced by AABW, as would be expected in a scenario where density gradients are diminishing ( Johnson 2008Kouketsu 2008 ). Numerous other variations in circulation behaviors controlled by thermally induced density variances may be found in Purkey and Johnson. Taken together, these indicators are broadly consistent with changes in the thermal regime of the deep ocean connected with  AABW and its source. 

It's important to note that to a greater or lesser extent the Southern Annular Mode (SAM) plays some role in controlling changes observed in Purkey and Johnson, not to the exclusion of secular changes outside of the SAM but significant nonetheless. Complications abound in forming an exact assessment of the proportionality of natural versus forced variations; the SAM itself appears to be in a process of adjusting to two anthropogenic influences, ozone depletion and greenhouse gas proliferation. 

Beyond shedding enlightenment on a specific research topic, Purkey and Johnson's work suggests some improvements we could make in the level of urgency we attach to exploring our planet. NOAA is working on upgrading our ability to sample deep and abyssal ocean water via robotic instrumentation.  As is so often the case, the pace of instrumentation improvements is set in part by budgetary limitations involving amounts of money small in the grand scheme of things. Purkey and Johnson show beyond doubt how vital better observational ability is when it comes understanding our role in shaping the climate; we're effectively blind to enormous changes in the physics of our planet because we won't make paltry expenditures for better "optics," a lamentable and unnecessary condition.  Our instrumentational inability to closely track climate change is a general problem; it's truly odd that such a important research topic so crucial to public policy should find itself lacking the equipment to quantify changes nearly everybody agrees present us with multi-trillion dollar risk and decision choices and outcomes. 


Officially Off-topic: A Salute to Oceanographers

In terms of effective inaccessibility and remoteness, Earth's oceanic abyssal depths have aptly been compared unfavorably to extraterrestrial space.

For researchers investigating Earth's climate, orbital space is in some ways a far friendlier environment than the oceans. Instruments aboard satellites allow researchers to collect their data while lounging in shirtsleeve comfort, facing nothing more dangerous in the daily routine than slipping and falling while taking a morning shower.

Oceanographers often must wrest their primary information from the ocean, at personal risk, conducting their observations from the pitching, rolling decks of ships with course and speed set for instrument deployment as opposed to comfort and safety, directly exposed to the uncaring vagaries of fickle weather and heavy machinery. Errors in procedure, equipment or vessel failures or even inclement weather may exact the ultimate penalty on oceanographers seeing to the meticulous collection of data, career hazards not faced by many other scientists investigating climate-relate phenomena. 

Quite apart from the kinetic drama of working from small ships on the surface of such storied locales as the notoriously stormy Southern Ocean, the sea is also extraordinarily costly in terms of the personal investment of time required to wrest every few hundred kilobytes of data from the cold dark of the bottom. After dealing with a commute of thousands of miles to their laboratory enviroment, scientists are rewarded with brief spurts of information separated by long intervals of plodding, akin to "crossing the ocean at a jogging pace" as NOAA's Gregory Johnson expresses the matter. 

For all these reasons, it's worth pausing a moment in appreciation of the fanatical dedication and perseverance needed to collect data of the kind used to produce Purkey and Johnson's paper. The graphs and maps casually flung out in little essays such as the one above inadequately express countless thousands of cold and dripping hours spent in hostile conditions far from hearth and home. True enough it's an all-volunteer army, but recognition of this effort is still due.

0 0

Printable Version  |  Link to this page

Comments

1  2  Next

Comments 1 to 50 out of 78:

  1. Bering strait flow is probably too small to include in that wonderful image but I think it should be a two-headed arrow.
    0 0
  2. I wonder, with the ice packs breaking up in the north, if the now more open passages might be allowing new colder currents to flow south within the upper levels of the oceans. Think of cold fresh melt water spreading over the surface while the original warmer saline water is pushed down deeper. This might explain why we see less warming in the upper oceans than we expect. Just thinking out loud.
    0 0
  3. Nice job, doug. Very interesting stuff.
    0 0
  4. Excellent job Doug. Thanks for this. Have to "digest" the content before commenting on the science.
    0 0
  5. There are several cooling / flat periods over the last 100 years of ocean temperatures, so surely this is an ocean cycle or sunspot affect or la nina, and surely its been identified?
    0 0
  6. The relevance of this paper is to total ocean heat content (OHC). Plenty of cycles to move heat around within the ocean without changing total OHC. (I'm not lost on calling it heat either). We barely have adequate measure of OHC now let alone anything remotely useful covering the last 100 year. If we did however, I would expect to periods of static and cooling because changes in solar and aerosols should have affected it. Climate is not single factor.
    0 0
  7. I love the title! Unfortunately, the article is both long and dense, so I didn't finish it -- and am wondering how many in the target audience will finish it.
    0 0
  8. Yes, excellent, informative post. First class. I'm back to wondering about how the Pacific Decadal Oscillation might interact with deep sea thermohaline circulation... mixing dynamics? Any info?
    0 0
  9. MattJ #7 said: "I love the title! Unfortunately, the article is both long and dense, so I didn't finish it -- and am wondering how many in the target audience will finish it. " ~~~~~~~~~~~~~~~~~~~~~~~~~~~~~~~~~~~~~~~~~~~~~~~ That is why ScepticalScience folks are writing the basic version explanations as well. Also, don't forget - sometimes, one just needs the words to explain the situation.
    0 0
  10. Articles like this one, Matt, are like some books on our shelves. Even if we have read the whole thing, it's always instructive to return and reread with more understanding. It's terrific, Doug. And we should all echo your sentiments about the fanatical dedication of people prepared to take such risks for the benefit of science. Gratitude to all of them.
    0 0
  11. I happened to work for a few days on a oceanographic ship in the much warmer and calm mediterranean waters. We had a simple task, take an instrument left at the bottom (2000 m) back home. The operation plan was simple, distributed to all of us printed on paper it was about a single page. The weather was fine and the sea smooth, i thought it was going to be almost a couple of days out at sea on vacation. It turned out to be the hardest 36 hours of continuos work of my life. When the instrument was finally on board, we were so tired that no one could eat or take a shower. Still wearing our wet clothes we hung over the deck for a long while drinking coffee. I commented that everything went wrong but my collegues laughed at me and said "welcome to oceanography!" Thank you Doug for reminding me this experience.
    0 0
  12. Excellent article. A real addition to the blog. Sea level rise is like the shadow cast by the heat, finding a reasonable portion of that missing heat is a real big break.
    0 0
  13. Riccardo, ~36 hours happens to be the longest I've ever worked in a single shift, too! In my case (ironically!) standing in the middle of an old landfill outside of Houston, Texas, servicing instrument packages being sent down a prospective oil well. Stinky, muddy, hot, w/mosquitoes. Driller did not want to believe hydrocarbon show at the "wrong" place in the hole. An early lesson for me on how seriously stupid it is to burn petroleum after working so hard to get it. "Crude," so to speak. Regarding parts of this heat distribution being cyclic, as I mentioned in the post it's probably the case that some of what's being measured is a natural feature, as natural as anything can be at this developing stage of the disruption game. It's even remotely possible that by some chance the -entire- apparent signal is down to some cyclic behavior. We don't know for sure; more measurements will help to resolve the proportionality of influences. To get the full picture here, I highly recommend reading Purkey & Johnson's paper itself; my post is an absurdly compressed synopsis of the publication and is as much as anything a general remark on how ill-equipped we are to scrutinize what lies shortly past the end of our collective noses. P&J's paper on the other hand is a model of circumspection and caution. It's an education all by itself on the general topic of Southern Ocean circulation as well as providing an excellent list of references for becoming better acquainted with the subject of the Southern Ocean's influence on the rest of the planet. Read it completely twice before leaping to conclusions, that's the best course to set. For my own part, I see a monotonous refrain in comments to the effect of "it's natural." To believe that this finding reflects only a natural process means expanding and then continuing to bear the burden of an already terminally cumbersome and awkward caveat. Choosing to interpret this enormous bulge of heat as being unrelated to AGW as usual requires that one simultaneously believe a myriad of -other- things are also coincidentally entirely in keeping with predictions arising from some fairly simple physical principles we've set in motion. Long ago this chain of coincidences became conspicuous and has since reached the point of being far beyond the realm of probability worth the investment of our faith. I'm not the sort to buy even a single lottery ticket so maybe I'm not the best judge of these things. MattJ, it -is- long. I struggle with my bloviation; so much to say, so little of other people's time in which to say it.
    0 0
  14. doug_bostrom #Original post "One might wonder, if AABW circulation is driven partly by the relative density of water chilled in the Antarctic, won't distribution of this water change as deep waters warm in response to heating by AABW circulation, thus robbing AABW of some of its physical transport impetus?" I am certainly wondering at this mechanism Doug. Chilled denser water slides down deep off Antarctica, travels north and warms the deep water up to the Equator. One would have thought it would have mixed and cooled such water. The amounts of SLR and OHC increase from this mechanism seem to be small. "Excepting the Arctic Ocean and Nordic seas, the rate of abyssal (below 4000 m) global ocean heat content change in the 1990s and 2000s is equivalent to a heat flux of 0.027 (±0.009) W m–2 applied over the entire surface of the Earth. Deep (1000–4000 m) warming south of the Sub-Antarctic Front of the Antarctic Circumpolar Current adds 0.068 (±0.062) W m–2. The abyssal warming produces a 0.053 (±0.017) mm yr–1 increase in global average sea level and the deep warming south of the Sub-Antarctic Front adds another 0.093 (±0.081) mm yr–1." 0.027 + 0.068 W/sq.m = 0.095 +/-0.071W/sq.m Dr Trenberth's TOA imbalance is 0.9W/sq.m of which he can account for about 0.55W/sq.m with wide error bars. Of the 0.35W/sq.m 'missing' the above analysis (0.095) accounts for about 27% - again with wide error bars. A total contribution 0.146mm/yr of SLR is tiny compared with the current trend of 2.1 - 2.5mm/yr. Oceanographers have a tough job - as a sailor myself I know what a heaving deck in a 50 knot storm is like. Permanent tethered buoys reporting the oceans at regular coincident times is the ideal we should be financing - not technical fantasies like CCS.
    0 0
  15. Ken, yeah, and thanks for pointing that out, I did a poor (incomplete) job with explaining. It's a bit more complicated than what I suggested, there are several thing going on. One problem is that I left out the "haline" part of "thermohaline circulation." I'll fix the paragraph after pondering on it a bit. I have to disagree w/you on the relative magnitude of the heat located in P&J 2010. 0.09 W/m2 is in itself a substantial fraction of Trenberth's gap and as well is an indicator of how "missing" does not automatically imply "does not exist." But I'm repeating myself.
    0 0
  16. I also ought to lighten up my dismal perspective on instrumentation by mentioning NOAA's plans to equip a subset of Argo buoys for deep operations as well as their scheme to deploy some lurking benthic samplers that will run on the bottom for an extended period of time before emerging to report back.
    0 0
  17. If the change in heat measured were due to natural cyclical processes you would expect that some areas would go down in heat content while others went up. This would be the case unless the process was very long. If it was long we would not see a large effect like what has been observed. Perhaps the few areas where heat content went down were due to a long term mechanism. The fact that most areas went up suggests a common mechanism--AGW. Doug, excellent post as per your normal stuff. If people find two pages too long to read they can just read the introduction and the conclusion.
    0 0
  18. Since the launching of the USS Nautilus in 1954, nuclear submarines have plied the depths of the world’s oceans. My working assumption is that these vessels collected a wealth of information about the temperature of the lower layers of the global ocean system. I also acknowledge that the data collected by the fleets of nuclear submarines is highly classified. Notwithstanding the classified nature of the data, wouldn’t it make sense for the IPCC to establish a special committee to discuss this matter with the governments of those countries with nuclear submarine fleets? Perhaps there is way for the data to be made available without compromising national security concerns. The stakes are high!. It’s worth a try.
    0 0
  19. Doug Bostrom - Excellent article, it's extremely informative. I have to admit I was stunned to hear that part of the Antarctic Bottom Water (AABW) actually reaches the Northern Hemisphere. Given the time frame of the Trenberth missing heat, are there indications of changes in circulation over the last decade that might be increasing transfer of heat to the bottom waters, away from what is currently measured by the ARGO program?
    0 0
  20. Badgersouth at 04:05 AM on 24 September, 2010 Since the launching of the USS Nautilus in 1954, nuclear submarines have plied the depths of the world’s oceans = = = = = = = = = = = = = = = = = = = = = = = = = = The maximum operating depth of the Los Angeles class is usualy given at around 200m. Very very shallow operation compared to the depths of the ocean.
    0 0
  21. @Dorlomin: I didn't realize that the maximum operating depth of a nuclear submarine was that shallow. Has the US Navy shared with climate scientists the temperature data that has been collected by nuclear submarines operating in the Arctic Ocean? For obvious reasons, the Argos buoys have not been deployed there.
    0 0
  22. Yes, some Arctic data from the US Navy has been carefully released. If I recall correctly, Al Gore was involved in convincing them to do it. Indeed military subs don't operate very deeply. They're optimized for their military missions, which only require that they can hide below the thermocline, not go super deep. However, one can assume that they can go deeper than the military publicly admits. The following link claims 300m max operating depth with likely hull collapse at 450m (again, somehow I suspect that hasn't been precisely tested with a billion+ dollar boat, so it's probably conservative, but it reinforces the point that another term for max operating depth is "never-exceed depth"). http://www.fas.org/programs/ssp/man/uswpns/navy/submarines/ssn688_la.html
    0 0
  23. Apparently the Seawolf class can go deeper The Ohio class is probably in-between.
    0 0
  24. GFW: I do recall that the US Navy released data about the thickness of the Arctic sea ice collected from nuclear subs, but I do not recall anything about ocean temperatures.
    0 0
  25. No one has mentioned this yet but I'm assuming this has implications for Dr Pielke's recent statement that "global warming has stopped" while referring to OHC.
    0 0
  26. Re: Badgersouth, GFW FBM's and attack subs are indeed designed for near-surface ops. Newer class subs will have a classified capability beyond that publicly revealed. "Research" vessels (not necessarily nuclear) exist with deeper dive capabilities. Temperature, pressure and salinity data are all acquired during normal sounding operations (to get an accurate corrected depth) and should all have a time-stamp with a GPS accuracy-equivalent lat/long. I utilized a number of sounding datasets that I was able to pass San Board review & incorporate in various mapping products for the military (classified & unclassified) and the merchant marine (unclassified). While there thus exists extensive datasets with good spatiotemporal resolution, security constraints will probably keep it from full utilization for OHC research purposes. A FOIA request from a connected Congressman or Senator, properly worded to degradate the true resolution and comprehensiveness of the datasets, could be used to obtain coverage to fill in any "gaps" in the Argo grid. I'll close with this: every US sub commander is intimately acquainted with the story of the Thresher. The Yooper
    0 0
  27. KR not to simply punt, rather because it's so complicated and I don't really know how to answer your question, probably the best way to start tracking down changes in circulation would be to dig into the P&J paper's references. In particular you might want to check Orsi's On the meridional extent and fronts of the Antarctic Circumpolar Current (full text, PDF) and follow citations of that paper forward in time.
    0 0
  28. HELP! In this posting and commnet thread, ocean heat content is expressed in W m–2. In the posting and comment thread re Dr. Roger Pielke and the "missing heat", ocean heat content is expressed in Joules. Why the use of two different measures? What's the crosswalk between "W m-2" and "Joules."
    0 0
  29. Re: Badgersouth (28) My understanding is that Joules is a measure of power per unit time, while W m-2 is used to describe units of solar irradiance (the energy falling on a unit area over a unit time). Not quite the same thing. Try here. Looks like it might be what you want. But then, maybe nobody knows... The Yooper
    0 0
  30. Yooper, Joules is a measure of energy in the SI system. Watts are Joules per second, the measure of power consumption (think 100 watt light bulb). Watt/m^2 is a measure of energy per unit time spread out over an area. In this context, that is often called flux. Thus 100 Watts/m^2 represents the power consumption of a 100 watt bulb spread out on a surface area of one square meter.
    0 0
  31. @ Daniel Bailey & muoncounter: Thanks for chiming in. I knew the basics. I still do not understand why this article uses Watts/m-2 and the Pielke article uses Joules. Perhaps I am missing something, but it seems to me that any measure of the heat content of the ocean must be done by volume. Watts/m-2 seems related to area only.
    0 0
  32. @Daniel Bailey & muoncounter: n. (Abbr. J or j) 1.The International System unit of electrical, mechanical, and thermal energy. 2.a. A unit of electrical energy equal to the work done when a current of one ampere is passed through a resistance of one ohm for one second. 2.b. A unit of energy equal to the work done when a force of one newton acts through a distance of one meter. [After James Prescott JOULE.] Per Answer.com
    0 0
  33. Badgersouth - One Watt is one Joule per second. This means that W/m^2 is the rate that energy arrives on a per-square-meter basis, while summing up all of those Joules over many seconds results in an energy sum that is the accumulated energy. Think of this as in water: as gallons per minute versus total gallons in your swimming pool.
    0 0
  34. KR: Thanks for the explantion. I also found the answer to my question at: http://oceanworld.tamu.edu/resources/ocng_textbook/chapter05/chapter05_01.htm
    0 0
  35. Badgersouth, For the global numbers in this article expressed in W m^-2, multiply by the surface area of the Earth, about 5.1x10^14 m^2 to get from W m^-2 to W (this will be J s^-1). Then if you want to get to Joules over some time period, multiply by the number of seconds in that time period (there are about 3.156x10^7 s per year). Note the time-scale for the estimates in this article is a few decades. Hope this helps.
    0 0
  36. And the waters are cooling as well it seems? http://www.nature.com/news/2008/080430/full/453015c.html
    0 0
  37. Re: Camburn (36) You do realize that the Nature article is from 2008, right? In any case, the study cited as the focus of this post is from 2010, so it seems likely to have more current information. Which shows the deep waters (referenced in the Nature piece) to be statistically significantly warming, not cooling. The Yooper
    0 0
  38. Daniel: Yes, I know that the nature study is from 2008. The current study uses models and salinity as temp proxies. The Wegener study used thermomiters. I think the temp results need to be examined again in about 5 years to see if they are consistent.
    0 0
  39. Camburn, When I read the linked paper they say on page 7 that they use thermometers to measure the temperature, not models and salinity. Can you say where you find them to suggest otherwise? They state they use only high quality temperature data from direct measurements made at least twice in the same location. Possibly the Wegener study used models?
    0 0
  40. Camburn, you've got it a bit backwards, 180 degrees really. In the P&J study salinity itself was derived from CTD: "Salinity was calculated from CTD conductivity, temperature, and pressure data and calibrated to bottle samples standardized with International Association for the Physical Science of the Oceans (IAPSO) Standard Seawater using the 1978 Practical Salinity Scale (PSS-78). Some interesting background information on conductivity-temperature-depth (CTD) samplers here, including dynamic dampness: Conductivity, Temperature, Depth (CTD) Sensors Photos of systems, deployment As to whether P&J employed "models" in their analysis, you probably ought to read more carefully, starting w/section 3 on page 10. The techniques described therein might be described as a model though it certainly does not resemble what most of us understand when thinking of that term. You're of course perfectly free to quibble over the semantic employment of "model" but if you've got a problem with the research you'd do better to show specifically how the authors' methods might be improved lest you convey the impression you're just saying "I doubt it." Fortunately P&J are exactingly detailed in describing their techniques so you should be able to understand and then tell us precisely where they've gone wrong, if indeed they have done so and you've got the skill to make productive remarks.
    0 0
  41. How does this paper answer the question of missing OHC between 2005 and 2010 when fewer than half the stations have readings during that period? And almost all of those have but a single reading? What they've done is extrapolated constant warming over the 20-30 year period of the data beyond that which it was actually measured. Very unconvincing.
    0 0
  42. TimTheToolMan, whether you find it convincing or not is irrelevant. The research shows that there has been warming of the deep oceans. This disproves the (frankly ridiculous to begin with) claims that previous OHC graphs were capturing all ocean warming. We have found significant warming which was not accounted for in previous results... ergo we now know that some of the "missing OHC" is to be found in deep ocean warming. Precisely where everyone who isn't completely ridiculous thought it must be.
    0 0
  43. I dont think you understand the problem CBDunkerson. The claim is that there is OHC increase between 2005 and 2010 and the evidence is not from measurement but from extrapolation from a time when there WAS measured warming. The research doesn't ACTUALLY show warming at all. It assumes it.
    0 0
  44. TimTheToolMan, it shows that the graphs on which the 'no OHC increase from 2005 to 2010' claim are based are wrong. Those graphs would only be correct if there was minimal warming of the deep oceans on a decadal time scale. However, this study proves that is NOT the case. Portions of the ocean below 4000 m have warmed significantly. Thus, the claim that there has been no increase since 2005 is based on data we now KNOW to be erroneous... and the claim is now PROVEN nonsense rather than merely the OBVIOUS nonsense that it was before. No, we do not have a complete time series for every cubic kilometer of the oceans and thus still cannot produce an accurate OHC measurement graph. But we now have conclusive proof that the previous graphs were leaving out a significant amount of heat. Which, of course, was obvious to begin with since we knew that observed sea level rise matched the heat which we knew SHOULD have been generated by observed radiation fluxes... but the measured ocean heat buildup was inconsistent with both.
    0 0
  45. Posted by doug_bostrom on Thursday, 23 September, 2010 at 04:40 AM in amusingly prosaic terms: the newly located reservoir of energy is akin to what would be liberated by loading every man, woman and child on Earth with five 1,400 watt hairdryers each and running those appliances continuously for the 20 year interval between measurements That's about 8.4×10¹² W. As surface of oceans is 3.6×10¹⁴ m2, this newly discovered heat flux is 23 mW/m2. Average geothermal heat flux at ocean bottom, which is usually considered negligible, is four times that much. In other words it would take about twenty thousand years for mankind to increase ocean temperatures by 1°C using hairdryers. Amusing, indeed.
    0 0
  46. Nonsense. Look at the one data point that has two readings in the period of interest. P18. This is the one that they choose to graph in figure 3. You can see what they "want" to show by the way they've trended it back to the early to mid 90's. No zoom in to that graph to see wha
    0 0
  47. ...now zoom in to that graph to see what the data really shows by joining the two known points. And that is a much lower rate of temperature increase over the period. This paper says trends are "evidence". They're just not. Only artual measuments are evidence and they simply dont have enough to say anything about 2005-2010
    0 0
  48. @TimTheToolMan: absence of evidence is not evidence of absence. What the article is about is the fact that the deep ocean *is* warming, which indicates there's lots of room for the "missing heat" to hide, and thus it is erroneous to claim OHC has not increased since 2005.
    0 0
  49. TimTheToolMan is correct that it's overreach (I think, no coffee here yet) for me to convey the impression of P&J's results as crisply explaining the slackening of upper ocean heat uptake in the past few years. However, TimTheToolMan is unambiguously wrong with his remark, "What they've done is extrapolated constant warming over the 20-30 year period of the data beyond that which it was actually measured." In a nutshell, what P&J did was to resample an array of stations covering a vast territory, finding a statistically significant warming broadly encompassing the majority of stations in the interval between samples. That's not an "extrapolation of constant warming," it's a notation that deep ocean heat content in the areas surveyed has increased during the sampling interval. Failing TTTM's explaining errors in P&J's methods and then offering an improved result, he's offering an ineffective means of saying "I doubt it" using a few more words. After that, TTTM's argument goes farther downhill, into the abyss: "The research doesn't ACTUALLY show warming at all. It assumes it." This sort of desperation usually indicates the goring of a sacred ox. BP, here's what the authors have to say about geothermal flux: The local abyssal heating rates outside of the Southern Ocean (Fig. 8a) are comparable to geothermal heating, typically 0.05 W m–2 away from ridge crests, which can have a significant impact on abyssal ocean circulation and water properties (Joyce et al. 1986; Adcroft et al. 2001). However, if the ocean circulation and geothermal heat fluxes are in steady state, this heating should not cause trends in abyssal temperatures. 30 But, if the abyssal circulation were to slow, geothermal influences might contribute to a change in abyssal temperatures and even circulation." BP's remark begs the question (presuming for a moment that some or all of this signal were down to geothermal flux), what would cause abyssal circulation to slow? See Kouketsu, Masuda. The paper really is a model of circumspection in the technical sense of the word, an education if you follow the citations.
    0 0
  50. So far the warming has been far below the 6 ° C rate the scientists want to use for a doubling of CO2. Since we have had 1/3 of a doubling of CO2 we should have had more than 2 ° C warming we haven’t had this. [.7 ° C is the accepted value and less than ½ of that is from CO2 in the best case.] . To get around this scientists have speculated that the ”missing heat” is stored in the oceans ! The problem is that since 2005 both atmosphere and the ocean have been cooling. . http://www.nodc.noaa.gov/OC5/3M_HEAT_CONTENT/ . Some have SPECULATED that the missing heat may be in the deep parts of the ocean but since they haven’t measured to test this speculation they don’t know. This article claims to have found 20 % of it. . The most important and ignored part of the missing heat controversy is when the heat will return. ? The surface area of the ocean is several orders of magnitude greater than the slight polar warming the article seems to find. When will the missing heat return to the surface where it can cause substantial warming ? . Since we are only speculating where the heat has gone and have only speculation about how it got there how can we predict how long it will be until it returns ? Answer: We can’t ! We have a theory of CAGW which DEPENDS upon the “missing heat ” returning in the next 100 years and we don’t know where the heat is and don’t know if or when it will return. Since we cannot find it we cannot measure it so we don’t know much of it exists. . Despite all of this “the debate is over” and we should throw ten’s of trillions of dollars at the nearest politician to make it go away.
    0 0

1  2  Next

You need to be logged in to post a comment. Login via the left margin or if you're new, register here.


The Consensus Project Website

THE ESCALATOR

(free to republish)


© Copyright 2024 John Cook
Home | Translations | About Us | Privacy | Contact Us