


 Arguments


How big is the “carbon fertilization effect”?
Posted on 26 February 2013 by gws
A new paper by Hemming et al. presents physical, best case limits on the (opposing) effects of warming and CO2 on the “greening” of the biosphere. Using the Hadley Center’s general circulation model in connection with an interactive plant response, they show that a doubling of atmospheric CO2 in the model under no other limitations increases global terrestrial net primary productivity (NPP - overall plant growth) on average by 57%, spatially dominant in the tropics. While warming alone decreases NPP, the physiological effect of higher CO2, on average, more than compensates for the losses globally. The new study uses an innovative “perturbed physics ensemble” (PPE), similar to ensemble weather forecasting, to study how quantitatively and spatially relevant the results are. However, as critically important nutrient limitations and potentially important biome shifts were excluded from this first study, the results are of limited relevance as they represent only a best case scenario.
Global Warming and the Carbon Cycle
As carbon dioxide levels in our atmosphere keep rising, they do not only affect climate, they also alter physical and biological processes that factor in atmospheric CO2 concentrations as a significant component of carbon cycling. The two most important such processes are the exchange of CO2 between the atmosphere and the ocean, and between the atmosphere and the terrestrial biosphere.
The latter process, known as a major part of the the terrestrial carbon cycle, consists of many individual steps and sub-processes of various complexity, which makes the field of terrestrial carbon cycle research one of the most heavily researched fields of the geosciences. It comes, therefore, maybe as no great surprise that the general public has only a limited understanding of the importance of carbon cycling, and that contrarians seeking to confuse and sow doubt among the public frequently cherry-pick only one aspect of the carbon cycle, the “carbon fertilization effect”.
“CO2 is plant food”
The effect may have been most prominently introduced by the CO2-is-plant-food-meme in a congressional hearing in March 2009, which served to demonstrate again how important accurate scientific information is. The contrarian argument goes like this:
CO2 is needed for plant growth, thus more CO2 will lead to more plant growth, and hence to a “greening” of the Earth. Ergo, more CO2 is good for Earth.
There are multiple reasons why such a gross simplification of the role of atmospheric CO2 in the terrestrial carbon cycle is short-sighted and strongly misleading. First of all, there is no real-world situation, in which only CO2 increases, all else remaining equal. And second, those other effects of increased atmospheric CO2, namely increased temperatures and altered moisture regimes, generally have adverse effects on growth.
SkS has addressed the meme at various points, prominently here, and recently here. However, the importance of the terrestrial biosphere’s reaction and any possible feedbacks to the atmospheric CO2 increase is part of much ongoing research. Rightfully so, because humanity critically depends on the terrestrial biosphere, such as for food production and clean water just to name two obvious aspects. How our biosphere reacts to warming and higher atmospheric CO2 will ultimately define how catastrophic we can expect our global CO2-experiment with the climate to be. So wouldn’t it be good to know more about how much “greening” to expect and what it means?
NPP and CO2 fertilization
All land plants carry out green leaf photosynthesis, the process of acquiring and converting atmospheric CO2 initially into simple sugars and from there into all other carbon-containing plant matter. Next time you look at that bush or tree in your yard, realize that about 50% of its dry mass is carbon, once part of the atmosphere in the form of CO2. Over the course of each growing season, i.e. when ambient temperatures allow for active photosynthesis, plants accumulate carbon out of the atmosphere and store it, they grow. The net growth over a year is called the Net Primary Productivity, or NPP. Globally, it is estimated to have been around 60 Petagram (Pg, 1015 g) carbon in the 1990s, balanced by an equal amount or carbon returned to the atmosphere via (heterotrophic) respiration. Much of that respiration is occurring from degrading plant material in soils, meaning respired carbon entering the atmosphere is “older” than the newly stored carbon, and the biosphere (plants and soils) itself acts as an intermediate storage reservoir for carbon cycling in and out of the atmosphere. But as humans also appropriate a large amount of global annual NPP for food and products, some carbon returns faster.
Because the first step of photosynthesis is the diffusion and (biological) absorption of atmospheric CO2 into a leaf, increasing CO2 surrounding that leaf will initially speed up the photosynthetic uptake. In other words, the initial photosynthesis steps can be treated like a first-order process, in which the rate of uptake of CO2 is a function of CO2 abundance itself. Thus the fertilizer analogy: You feed it more, it grows more. However, and this is the first major culprit, this dependence of uptake on abundance is not linear but drops rapidly with increasing CO2, ultimately flatlining above 1000 ppm CO2. The second major culprit, or better say group of culprits, is that atmospheric CO2 is not the only factor affecting photosynthesis and plant growth. Plants need many nutrients, and water, for optimal growth. Unless these nutrients, such as nitrogen or phosphorous acquired out of the soil, are provided in amounts increasing proportionally to the supply of CO2, no continued fertilization effect of CO2 can be sustained.
Calculating NPP changes
It is impracticable to measure carbon cycling rates on a global basis accurately. While the global atmospheric CO2 monitoring network allows us to estimate how much atmospheric CO2 is removed by the terrestrial biosphere annually, that amount only represents the difference between NPP and respiration, and does not show a correlation with atmospheric CO2 (cf. discussion by the Global Carbon Project).
Because there are so many factors affecting annual terrestrial NPP, atmospheric CO2, air temperature, nutrient and water availability, season length, seasonal temperature development, air pollution and other anthropogenic interferences to name a few, it is very complicated to provide a reliable estimate from knowledge of all relevant processes and their dependencies on physical and biological parameters. Nevertheless, the last decade has shown a flurry of global modeling efforts that combined climate modeling with terrestrial biosphere modeling. The present paper makes an important step forward as it tries to address why past findings have at times identified a larger or smaller fertilization effect, and sometimes even net carbon losses from the biosphere.
Similar to ensemble forecasting in weather research, where a base set of input parameters to the forecast is varied within physically reasonable boundaries to create an ensemble of forecasts that most often describes reality more accurately then each single forecast itself, the researchers used a base set of physical variables in their climate model to create a series of globally gridded ensemble (equilibrium) climate and associated NPP projections, with or without allowing for the physiological effect of CO2 on photosynthesis. The latter allowed them to distinguish between the effects of warming itself on NPP (adverse) and that of warming and atmospheric CO2 on NPP (favorable). The perturbed physics ensemble, PPE, was used to gauge how robust the NPP results were among the two drivers, climate and CO2 in pre- and post-industrial [CO2] worlds, meaning whether the effect, if any, could have arisen through random uncertainties in the climate model parameters themselves represented by the PPE spread.
Figure 1 (also in original): Ensemble average NPP (kg C m−2 yr−1) from the RadPhys simulations with both the effects of plant physiological forcing and radiative forcing/physical climate feedbacks, simulated with pre-industrial atmospheric [CO2]. Note: The authors erroneously used "per square centimeter" instead of the correct "per square meter" in their graphs and text; 1 kg m−2 yr−1 is equal to 10 metric tons (t) ha-1 yr-1 or 4 t per acre per year.
Mixed news for the tropics
Most of global NPP is accumulated in the tropics, Figure 1, a result consistent with all prior work on global NPP. The tropics are “lush” and became more so under doubled CO2 in the model. While warming caused NPP losses throughout the tropics in the model (driven by temperature effects on autotrophic respiration), the physiological effect of CO2 dominated the net, Figure 2.
Figure 2 (original Fig. 3a): Average changes in NPP (red: −0.2 to −0.3, dark green: 0.6 to 0.7 kg C m−2 yr−1) between pre-industrial and doubled [CO2] for the RadPhys (both warming and physiology) sub-ensemble.
However, the standard deviation of the PPE was also high in several regions of the tropics, Figure 3, prompting the authors to state
“In these locations, NPP is particularly sensitive to the specific choice of model parameterisations, such that even the sign of the NPP response could change according to the parameterisations adopted.”
So while there appears to be a robust signal that tropical NPP will increase as a result of increasing atmospheric CO2, the spatial forecast is mixed.
Less good news in mid- and high latitudes
Outside the tropics, in the major food production regions of the northern hemisphere, the model's verdict is less encouraging. The model’s NPP increases were of similar magnitude than the PPE standard deviation, Figure 3, and the authors highlighted larger uncertainties of warming than CO2 on expected NPP changes.
Figure 3 (Fig. 7a in original): Spatial differences between the average NPP changes and the standard deviations of the RadPhys (both warming and physiology) sub-ensemble. Yellow to light green represent neutral, i.e. −0.2 to 0.2 kg C m−2 yr−1, blueish colors represent positive (i.e. significant NPP increases), orange to red colors negative values (i.e. insignificant NPP increases).
Ultimately, the authors concluded that
“… these results indicate that the direction of the global average NPP response to doubled [CO2] is likely to be positive, regardless of the values of the model parameterisations perturbed in this study.”
Insofar, one can hope that, and there is broad scientific consensus, that there will indeed be a small amount of “greening” from increased atmospheric [CO2]. However, stressed at several points in the manuscript, the above scenario is for a situation where the basic composition and structure of the global terrestrial biosphere does not change under doubled [CO2] and where nutrient limitations do not matter. As the primary nutrients nitrogen and phosphorous are key limiting factors in many ecosystems, particularly in the tropics, we can expect that real-world NPP increases as a result of doubling [CO2] will be much lower than the ensemble average of 57% the authors calculated. And we expect that similar studies addressing this issue will be published in the coming years.
An additional word of caution
Model NPP in GCMs is generally an equilibrium value. It does not tell us anything about transient carbon fluxes, such as those triggered by fires, floods, heat waves or droughts, extreme events that are expected to increase in frequency as warming progresses. As the (devasting) effects of the US drought since 2011 are becoming more and more apparent, it is clear that even potentially large increases in crop yields cannot be sustained in an increasingly extreme weather world. Especially heat waves, e.g. the Europe-wide heat wave in 2003, can cause widespread plant mortality and crop yield drops that are expected to cause regular food security issues in the second half of the century.
Summary
- Doubling atmospheric CO2 is likely going to cause some "greening" of the terrestrial biosphere globally under equilibrium conditions, especially if factors such as water and nutrient availability do not become limiting
- Likely, much of the greening will manifest itself in the tropics, not in mid-latitudes; warming negates much of the CO2 effect
- Limiting growth factors are common throughout the terrestrial biosphere, thus the calculated "CO2-only" effects represent a best case scenario
- Equilibrium conditions are a model construct not accounting for transient developments, particularly short-term weather extremes with the potential to eliminate long-term gains
Deborah Hemming, Richard Betts, Matthew Collins:
Sensitivity and uncertainty of modelled terrestrial net primary productivity to doubled CO2 and associated climate change for a relatively large perturbed physics ensemble,
Agricultural and Forest Meteorology, Volume 170, 15 March 2013, Pages 79–88, http://dx.doi.org/10.1016/j.agrformet.2011.10.016


Interesting. Did the original paper discuss the findings of Nitrogen constraints on terrestrial carbon uptake: Implications for the global carbon-climate feedback (Link) from back in 2010? Wang and Houlton found that the increased temperatures were likely to seriously reduce fixed nitrogen, especially in the tropics, so that the overall global availablity of fixed nitrogen was likely to drop.
Another instance of serendipity...
On the same day that gws posts this excellent article about the relationship between future food production and CO2 concentrations in the atmosphere, Justin Gillis posts Feeding Ourselves on a Warming Planet on the New York Times' Green Blog.
The Gillis article summarizes the findings contained in a working paper, Climate Impacts on Agriculture: A Challenge to Complacency? by Frank Ackerman and Elizabeth A. Stanton of Tufts University.
This is good news. However, as stated "atmospheric CO2 is not the only factor affecting photosynthesis and plant growth". So far, we have massive pine beetle die-back in the Western and NorthWestern U.S. We have 'once-in-500-year' droughts in the Amazon occuring twice in ten years. We have a Russian heatwave that spiked global wheat prices. We're in the third year of drought in the U.S. breadbasket. Live coral acreage is tanking. Clearly, something that is currently CO2-limited is going to be very happy in the near future. What does that mean for us? It may be a little like celebrating flu outbreaks on behalf of the viruses.
Truly, "atmospheric CO2 is not the only factor affecting photosynthesis and plant growth".
We know that the increasing CO2 is coming from burning fossil fuels. Another consequence of burning either fossil fuels or biofuels is the increase of NOx and Ozone in the troposphere - which has really serious impacts on all growing plants, from smallest to largest.
I don't think this study means much at all. The stuff that is supposed to be getting greener - is also going to be getting deader!
.
Two points worth remembering are that plants have evolved: 1. In conditions of climate stability and 2. at locations best suited to their survival.
Increased CO2 concentration promotes plant growth but it also promotes climate change characterized by extreme heat, drought and precipitation events which plants, particularly food crops, can not handle. Further, the frequency of those events is expected to increase with regional warming, making the best locations for plant growth at present unsuitable for their growth in the future. Food production is particularly vulnerable to a warmer more volatile climate because increased heat diminishes crop yield.
There is a tendency among some commentators to overlook the fact that elevated CO2 promotes both crop and weed growth and that the latter competes with crop plants for limited water and soil nutrients, both of which are impacted by rising temperature.
It is easy to assert that “we can adapt” to changing climate conditions by developing heat tolerant food crop varieties but quite another thing achieving it. New varieties must also be able to produce increased yield while using less nutrients to do so and be able to simultaneously tolerate drought, higher rainfall and increased resistance to insects. Bit of a tall order!
In Figure 1 caotion, you said:
I think this is a typo: ha = 10 000m2, therefore it should be 10 000kg or 10 metric tons.
To put the fertilisation effect in a proper context, it would be interesting to know how much of the increased fertilisation effect calculated by this study is currently happening with 40% CO2 increase since preindustrial. We know the fraction of anthropogenic C imbalance uptaken by ocean invasion and by the NH terestrial biosphere (from emissions - Mauna Loa measures and the isotopic footprint of C fluxes), so I think the direct comparison of the existing perturbation of AT carbon cycle and the carbon cycle predicted by this study is possible. Does anyone know of such comparison and can cite some numbers?
Chriskoz - it's still a controversial topic. Clearly land-based plants (mostly trees) are drawing down a sizeable chunk of human CO2 emissions, but is this due to forest re-growth in the tropics, former Soviet Union countries, and China, or is this the fabled fertilization effect?
thanks for the comments
angliss @1: the Wang paper you mention was not cited, however, the authors are well aware of nutrient limitations and have emphasized that their model does not account for them. Future work is supposed to take this additional step.
keenon350 @4: check out http://aspenface.mtu.edu/ ; ozone is indeed a major culprit, and we tend to underestimate its impact because we are not aware of how much more NPP we could actually get with low to very ozone abundances (<10 ppb), because those do not exist any more in the real world (background now typically is already >30 ppb).
chriskoz @6: numbers in caption fixed. In the paper they actually calculated a lower than contemporary NPP for pre-industrial [CO2], which they attributed "in part" to the lower [CO2]. But to address your question: I would not call the science on this "controversial", but rather "complex". At a particular study site where in-depth research allows studying local carbon cycling as a function of local climate, nutrient availability, and other factors, one may tease out a CO2-fertilization effect, and FACE projects were designed to particularly address the CO2 effect. But in a global model where local conditions are blended by averaging over time, space, and ecosystem type, I think one cannot hope to resolve the numerous drivers such that an accurate picture emerges everywhere. You may get it right for a mature boreal forest but not the African savanna or vice versa. However, the models are of course informed by results from the flux network and other measurements, so they will become more accurate over time, also because more ecosystem flux measurements are now in place in a larger variety of ecosystems than 10-20 years ago. Nevertheless, the models are mostly for guidance of what to expect under different scenarios.
Thanks gws.
To recap my understanding, together with some numbers. Looking at this Carbon Cycle picture and figures 1 (NPP at preindustrial CO2 280ppm) and 2 (dNPP per doubled CO2 to 560ppm, let's call it "NPP sensitivity" or dNPP) above, I deduce:
- NPP 60Pg (or 60Gt) per 150Mkm2 (land surface area) means 0.4kg/m2 and that is the average value on Figure 1
- It's hard to eyeball the average NPP sensitivity from Figure 2 but it looks as "green" as Figure 1, then in the order of 0.2-0.4kg/m2, therefore average NPP sensitivity could result in a staggering doubling of 57pG NPP flux shown on carbon cycle and drawing that +204Pg from the atmosphere pretty quickly. That conclusion sounds incredible, prodived that fertilisation effect has hard limits and levels out in most autophytic species. I would not expect that dNPP could have such potential (in the ideal conditions of abundance of water & other nutrients). Perhaps I read Figure 2 incorrectly or my calculations are wrong.
- How much of that red 2.4Pg "Land sink" flux shown on Carbon Cycle picture is due to dNPP, remians highly uncertain.
chriskoz, some more explanation:
gws,
Nice and comprehensive response, especially useful link to the global carbon project paper, thank you very much. Indeed I cannot wait for the analysis of the new Le Quéré paper...
Moved from another thread.
Dave... "Due to the temperature dependence of Henry's Law, a 1°C increase in temperature slows CO2 uptake by the oceans by about 3%."
Where do you come up with this 3% figure?
Here's a graph for the Henry's Law Constant.
Dave... Your reference to the inset on FAQ 5.1 is comical at best.
It states exactly what I'm telling you, as did the other bits I posted.
You were making the claim that natural sinks were removing more of our emissions, and that is not the case by any stretch of the imagination. And the caption you posted goes on to say...
How can you not understand this? Take note that AR6, though it's the most current IPCC report, came out nearly two years ago, and the report is relying on data and research that was completed well before even that.
The most recent papers are saying that, yes, that CO2 fertilization effect is now waning.
High economic costs of reduced carbon sinks and declining biome stability in Central American forests
Rising Temperatures Can Negate CO2 Fertilization Effects on Global Staple Crop Yields: A Meta-Regression Analysis
Tropical Forests’ Carbon Sink Is Rapidly Weakening – Crucial for Stabilizing Earth’s Climate
Once again, in your own citation the language is clear.
The "observations show" means they are already seeing this happening, and that is based on research that's at least half a decade old.
I wrote elsewhere, "Due to the temperature dependence of Henry's Law, a 1°C increase in temperature slows CO2 uptake by the oceans by about 3%."
In reply, Rob asked, "Where do you come up with this 3% figure?"
From Weiss (1974), an approximate relationship is (as summarized by Pro-Oceanus):
To get the "3%" figure, you can plug in suitable values, or you can look at a graph, like this one: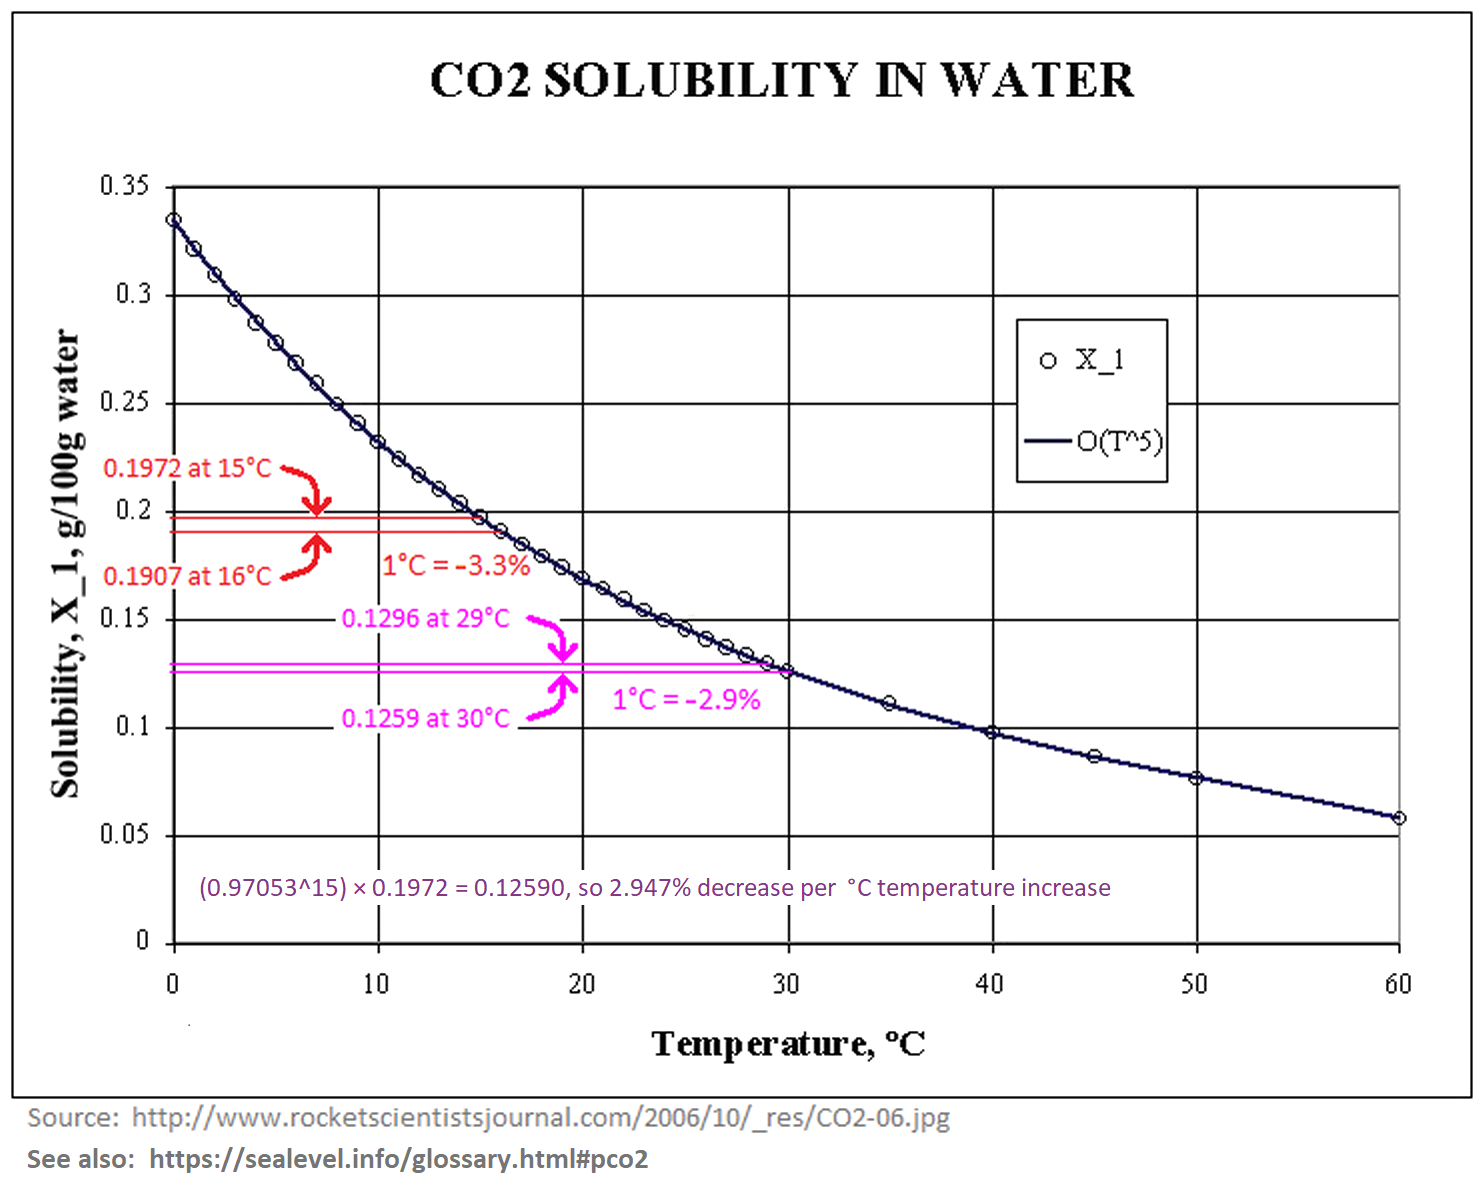
Before we dig into your equation, can I ask why your Y-axis is an order of magnitude greater than the Pro-ocean graph?
Dave... Perhaps also think about what this chart represents. It's saying the solubility of CO2 falls as temperature increases. That means when temperature rises more CO2 remains in the atmosphere leading to more warming.
I believe this is the same effect that amplifies warming from orbital patterns to produce glacial-interglacial events.
If I'm correctly interpreting what you're claiming, it seems you're saying that warming oceans will take up more CO2, which would be inverse to the actual effect of CO2 solubility.
Rob @ 16:
daveburton's graph is using different units from the Pro-ocean one - g/100g, rather than mole/kg-atm.
Before going down this Henry's Law rabbit hole, note that the uptake of CO2 in water is not solely related to the solubility of CO2 in water. The CO2 rapidly dissociates into ions that combine with the calcium carbonate present in sea water.
There is an excellent series here on ocean acidification:
OA Not OK part zero lists all the individual posts.
Part 15 mentions how solubility of CO2 depends on the presence of other ions.
...but there are many parts to the series. Each individual part is small, so going through them is worthwhile.
Dave... Going back to read what you previously wrote. (sigh)
You stated, "Some people point to that little orange box and say that greening has ceased."
No, I don't think anyone is pointing to your little orange box, nor are they using the original graph to make such a determination. This was a predicted result long before that graph existed. The determination of whether it's occurring is based on other observations related, I believe, primarily related to ongoing deforestation, changes in land use, etc.
You also stated, "This recent study quantifies the effect for several major crops. Their results are toward the high end...[etc]"
If you actually read more than just the abstract of that study you find this on page 3:
That directly confirms for you what I've been saying. (You really do need to read the full papers.)
It does seem that you're claiming CO2 uptake falls with increasing temperature. But it's unclear to me how you think this plays into the conclusion that CO2 levels would "quickly normalize" over the course of 35 years. Research tells us that's not the case.
Persistence of climate changes due to a range of greenhouse gases
Rob, in answer to your first question, Bob is correct: they use different units.
Both the graph and the "plug in suitable values" calculation (above) are for freshwater, but that hardly matters. CO2 is noticeably less soluble in saltwater, but the effect of temperature on CO2 solubility is nearly identical. Here's the same calculation with salinity 35 (typical seawater), for a 1° temperature increase (from 288K to 289K):
1 - ( (e^( -60.2409 + (93.4517*(100/289)) + (23.3585* ln(289/100)) + 35 * (0.023517 - (0.023656*(289/100)) + (0.0047036 * (289/100)^2)) )) / (e^( -60.2409 + (93.4517*(100/288)) + (23.3585* ln(288/100)) + 35 * (0.023517 - (0.023656*(288/100)) + (0.0047036 * (288/100)^2)) )) ) =
Bob is also correct that ocean chemistry is more complicated than that, in part because most of the dissolved CO2 immediately dissosiates into various ions. Here's a good resource on ocean chemistry:
http://www.molecularmodels.eu/cap11.pdf
What's more, in the oceans, biology generally trumps chemistry, and that is certainly true for CO2 uptake. Some people think that the capacity of the oceans to take up CO2 is limited to surface water by ocean stratification. But that's incorrect, beause the "biological carbon pump" rapidly moves CO2 from surface waters into the ocean depths, in the form of "marine snow."
The higher CO2 levels go, the faster that "pump" works. Here's a paper about it:
https://www.science.org/doi/reader/10.1126/science.aaa8026
Once carbon has migrated from the ocean surface to the depths, most of it remains sequestered for a very long time. Some of it settles on the ocean floor, but even dissolved carbon is sequestered for a long time. For instance, it is estimated that the AMOC takes about 1000 years to move carbon-rich water from high latitudes to the tropics, where it can reemerge. That is obviously far longer than the anthropogenic CO2 emission spike will last.
Due to the temperature dependence of Henry's Law, a 1°C increase in temperature slows CO2 uptake by the oceans by about 3%. That's a slight positive feedback: more CO2 in the air increases water temperatures, which slows ocean uptake of CO2. But it is very minor, because a 50% (140 ppmv) rise in atmospheric CO2 concentration accelerates CO2 uptake by the oceans by 50%, which obviously dwarfs 3%. That's the main reason that ocean uptake of CO2 continues to accelerate despite the temperature dependence of Hanry's Law.
Dave... The fundamental fact that you disputed is that oceans take up about half of our emissions. It's a fact that has been clearly stated in the citations both of us have presented.
You also claimed CO2 concentrations would quickly come down (normalize) once we stop emitting it. This is also not correct unless you're using "normalize" to mean "stabilize at a new higher level". But they're not going to stabilize back to 300ppm.
Rob wrote elsewhere, "greening is now turning into 'browning.' ... fertilization [has now been] overwhelmed by other effects... In other words, the greening has now stopped," and here, "You were making the claim that natural sinks were removing more of our emissions, and that is not the case by any stretch of the imagination.""
Here's AR6 WG1 Table 5.1, which shows how natural CO2 removals are accelerating:
https://www.ipcc.ch/report/ar6/wg1/downloads/report/IPCC_AR6_WGI_Chapter_05.pdf#page=48
Here it is with the relevant bits highlighted:
: 2.0 ⇒ 2.6 ⇒ 2.9 ⇒ 3.4 PgC/yr")
https://sealevel.info/AR6_WG1_Table_5.1.png
Or, more concisely:
https://sealevel.info/AR6_WG1_Table_5.1_annot1_partial_carbon_flux_comparison_760x398.png
(Note: 1 PgC = 0.46962 ppmv = 3.66419 Gt CO2.)
As you can see, as atmospheric CO2 levels have risen, the natural CO2 removal rate has sharply accelerated. (That's a strong negative/stabilizing climate feedback.)
AR6 FAQ 5.1 also shows how both terrestrial and marine carbon sinks have accelerated, here:
https://www.ipcc.ch/report/ar6/wg1/downloads/report/IPCC_AR6_WGI_Chapter05.pdf#page=99
Here's the key graph; I added the orange box, to highlight the (small) portion of the graph which supports your contention that, "greening is now turning into 'browning.' ... fertilization [has now been] overwhelmed by other effects... In other words, the greening has now stopped."
https://sealevel.info/AR6_FAQ_5p1_Fig_1b_final2.png
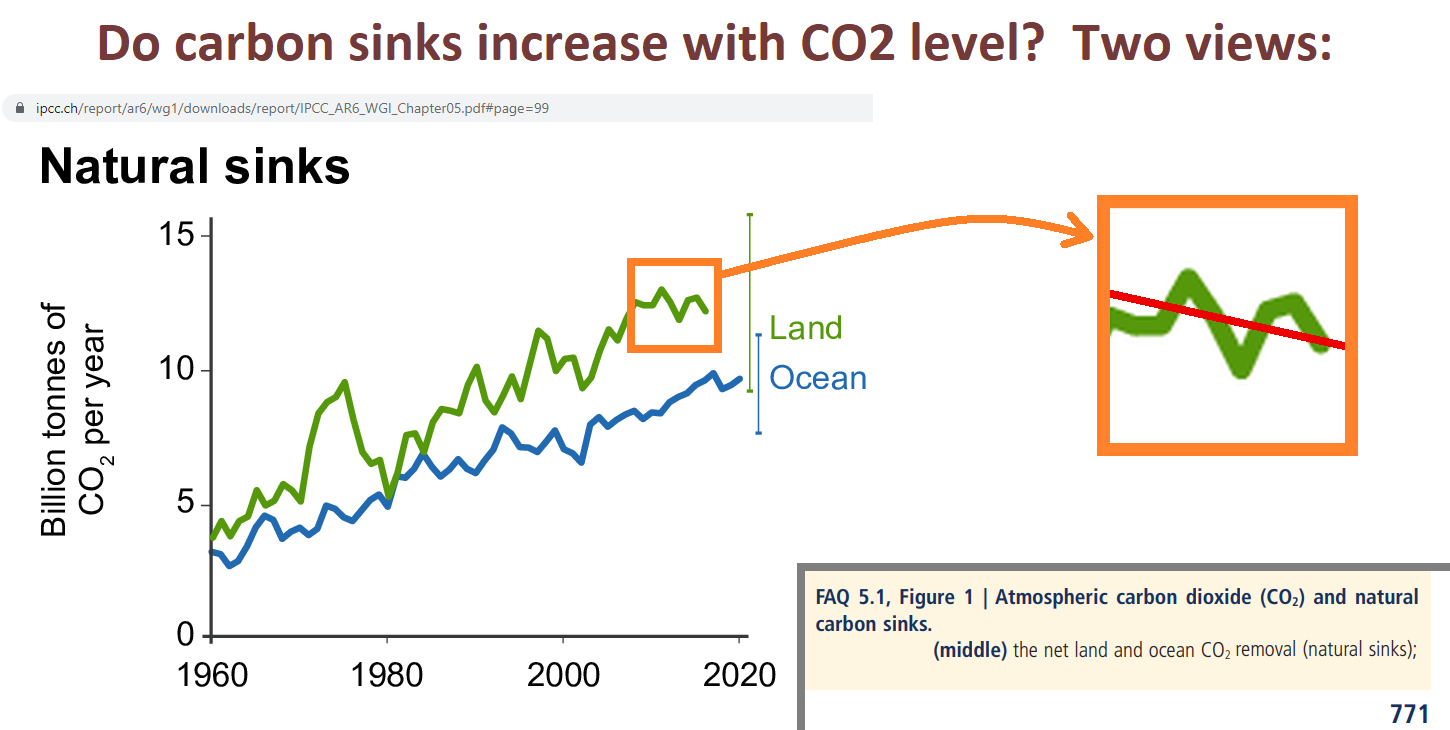
Here's the caption, explicitly saying that natural removal of carbon from the atmosphere is NOT weakening:

The authors did PREDICT a "decline" in the FUTURE, "if" emissions "continue to increase." But it hasn't happened yet.
What's more, the "decline" which they predicted was NOT for the rate of natural CO2 removals by greening and marine sinks, anyhow. Rather, if you read it carefully, you'll see that that hypothetical decline was predicted for the ratio of natural removals to emissions.
What's more, their prediction is conditional, depending on what happens with future emissions ("if CO2 emissions continue to increase").
Well, predictions are cheap. My prediction is that natural removals of CO2 from the atmosphere will continue to accelerate, for as long as CO2 levels rise.
The "fraction" which they predict might decline, someday, doesn't represent anything physical, anyhow. (It is one minus the equally unphysical "airborne fraction.") Our emission rate is currently about twice the natural removal rate, so if emissions were halved, the removal "fraction" would be 100%, and the atmospheric CO2 level would plateau. If emissions were cut by more than half then the removal "fraction" would be more than 100%, and the CO2 level would be falling.
I wrote elsewhere, "This recent study quantifies the effect for several major crops. Their results are toward the high end, but their qualitative conclusion is consistent with many, many other studies. They reported, "We consistently find a large CO2 fertilization effect: a 1 ppm increase in CO2 equates to a 0.4%, 0.6%, 1% yield increase for corn, soybeans, and wheat, respectively.""
If you recall that mankind has raised the average atmospheric CO2 level by 140 ppmv, you'll recognize that those crop yield improvements are enormous!
Rob replied, "If you actually read more than just the abstract of that study you find this on page 3: 'Complicating matters further, a decline in the global carbon fertilization effect over time has been documented, likely attributable to changes in nutrient and water availability (Wang et al. 2020).'"
Rob, I already addressed Wang et al (2020), but you might not have seen it, because the mods deemed it off-topic and deleted it. Here's what I wrote:
Rob, it's possible that your confusion on the greening/browning point was due to a widely publicized paper, with an unfortunately misleading title:
Wang et al (2020), "Recent global decline of CO2 fertilization effects on vegetation photosynthesis." Science, 11 Dec 2020, Vol 370, Issue 6522, pp. 1295-1300, doi:10.1126/science.abb7772
Many people were misled by it. You can be forgiven for thinking, based on that title, that greening due to CO2 fertilization had peaked, and is now declining.
But that's not what it meant. What it actually meant was that the rate at which plants remove CO2 from the atmosphere has continued to accelerate, but that its recent acceleration was less than expected. (You can't glean that fact from the abstract; would you like me to email you a copy of the paper?)
What's more, if you read the "Comment on" papers responding to Wang, you'll learn that even that conclusion was dubious:
Sang et al (2021), "Comment on 'Recent global decline of CO2 fertilization effects on vegetation photosynthesis'." Science 373, eabg4420. doi:10.1126/science.abg4420
Frankenberg et al (2021), "Comment on 'Recent global decline of CO2 fertilization effects on vegetation photosynthesis'." Science 373, eabg2947. doi:10.1126/science.abg2947
Agronomists have studied every important crop, and they all benefit from elevated CO2, and experiments show that the benefits continue to increase as CO2 levels rise to far above what we could ever hope to reach outdoors. Perhaps surprisingly, even the most important C4 crops, corn (maize) and sugarcane, benefit dramatically from additional CO2. C3 plants (including most crops, and all carbon-sequestering trees) benefit even more.
Rob also quoted the study saying, "While CO2 enrichment experiments have generated important insights into the physiological channels of the fertilization effect and its environmental interactions, they are limited in the extent to which they reflect real-world growing conditions in commercial farms across a large geographic scale."
That's a reference to the well-known fact that Free Air Carbon Enrichment (FACE) studies are less accurate than greenhouse and OTC (open top container) studies, because in FACE studies wind fluctuations unavoidably cause unnaturally rapid variations in CO2 levels. So FACE studies consistently underestimate the benefits of elevated CO2. Here's a paper about that:
Bunce, J.A. (2012). Responses of cotton and wheat photosynthesis and growth to cyclic variation in carbon dioxide concentration. Photosynthetica 50, 395–400. doi:10.1007/s11099-012-0041-7
The issue is also explained by Prof. George Hendrey, here:
"Plant responses to CO2 enrichment: Much of what is known about global ecosystem responses to future increases in atmospheric CO2 has been gained through Free-Air CO2 Enrichment (FACE) experiments of my design. All FACE experiments exhibit rapid variations in CO2 concentrations on the order of seconds to minutes. I have shown that long-term photosynthesis can be reduced as a consequence of this variability. Because of this, all FACE experiments tend to underestimate ecosystem net primary production (NPP) associated with a presumed increased concentration of CO2."
Rob wrote, "It does seem that you're claiming CO2 uptake falls with increasing temperature.""
That is correct for uptake by water. Or, rather, it would be correct, were it not for the fact that the small reduction in CO2 uptake due to the temperature dependence of Henry's Law is dwarfed by the large increase in CO2 uptake due to the increase in pCO2.
Rob wrote, "But it's unclear to me how you think this plays into the conclusion that CO2 levels would 'quickly normalize' over the course of 35 years" and also, "You also claimed CO2 concentrations would quickly come down (normalize) once we stop emitting it. This is also not correct unless you're using 'normalize' to mean 'stabilize at a new higher level'."
Perhaps you've confused me with someone else. I said nothing about CO2 levels "normalizing."
I did point out that the effective half-life for additional CO2 which we add to the atmosphere is only about 35 years. I wrote:
The commonly heard claim that "the change in CO2 concentration will persist for centuries and millennia to come" is based on the "long tail" of a hypothetical CO2 concentration decay curve, for a scenario in which anthropogenic CO2 emissions go to zero, CO2 level drops toward 300 ppmv, and carbon begins slowly migrating back out of the deep oceans and terrestrial biosphere into the atmosphere. It's true in the sense that if CO2 emissions were to cease, it would be millennia before the CO2 level would drop below 300 ppmv. But the first half-life for the modeled CO2 level decay curve is only about 35 years, corresponding to an e-folding "adjustment time" of about fifty years. That's the "effective atmospheric lifetime" of our current CO2 emissions.
Rob wrote, "Dave... The fundamental fact that you disputed is that oceans take up about half of our emissions."
That reflects two points of confusion, Rob.
In the first place, our emissions are currently around 11 PgC/year (per the GCP). The oceans remove CO2 from the atmosphere at a current rate of a little over 2.5 PgC/year. That's only about 1/4 of the rate of our emissions, not half.
More fundamentally, the oceans are not removing some fixed fraction of our emissions. None of the natural CO2 removal processes do. All of them remove CO2 from the bulk atmosphere, at rates which largely depend on the atmospheric CO2 concentration, not on our emission rate. If we halved our CO2 emission rate, natural CO2 removals would continue at their current rate.
Because human CO2 emissions are currently faster than natural CO2 removals, we've increased the atmospheric CO2 level by about 50% (140 ppmv), but we've increased the amount of carbon in the oceans by less than 0.5%, as you can see in AR5 WG1 Fig. 6-1.
Sorry, this got kind of long. I hope I addressed all your concerns.
Daveburton @22 ~ Please explain more of your first chart [ IPCC's decadal Carbon Flux Comparison 1980-2019 ].
The natural sink flux figures there are indeed broad brush, to be sure ~ but they show a rather steady proportionality to the total carbon emissions. # The land sink shows about 30-35% of total emissions, while the sum of land & ocean remains around 55-60% . It may not be statistically significant ~ but the proportion actually reduces as the emissions increase over the last 3 decades.
In other words, as the decades progress, the natural carbon sink flux in absolute terms rises with the rising emissions ~ but does not show a proportional increase.
The corollary of that is: looking back in time ~ as the atmospheric CO2 level decreases, the size of the natural sink flux decreases also. Daveburton, this directly contradicts your hypothesis of "if emissions were halved ... atmospheric CO2 level would plateau."
[B] Papers such as Zhu et al. 2016 [Nature Climate Change] and the Charles Taylor & Wolfram Schlenker one (not peer-reviewed) you mention above . . . point out the multifactorial complexities in assessing the relevance of greening & browning (of vegetated land) where measured by Leaf Area Index (seen per satellite). Very difficult to come to a substantive conclusion of value ! While the nutritive components of some food crops may reduce slightly as CO2 rises . . . nevertheless, it is (as you state) beyond argument that higher CO2 benefits overall crop yield & plant mass.
However, Daveburton ~ and I presume that this has been pointed out to you many times before ~ the other CO2/AGW concomitant effects of increased droughts /floods /heat-waves can be harmful to crop yields in open-field agriculture. [And especially so for the staple crop of maize.]
Eclectic wrote, "Daveburton @22 ~ Please explain more of your first chart [ IPCC's decadal Carbon Flux Comparison 1980-2019 ]. The natural sink flux figures… show a rather steady proportionality to the total carbon emissions."
Glad to. Any two things which steadily increase are thereby correlated. There's only a possibility that the relationship might be causal if there's a possible mechanism for such causality.
There's no possible mechanism by which the rate at which CO2 emerges from chimneys could govern the rate at which CO2 is taken up by trees & absorbed by the oceans, or vice-versa, so the relationship cannot be causal — just as this famous relationship is not causal:
Eclectic wrote, "The land sink shows about 30-35% of total emissions, while the sum of land & ocean remains around 55-60%."
Yes, I usually say "about half," as in, "If our CO2 emissions were cut by more than about half then the atmospheric CO2 level would be falling, rather than rising."
It is important to recognize that the relationship is merely coincidental, not causal.
Eclectic wrote, "as the decades progress, the natural carbon sink flux in absolute terms rises with the rising emissions ~ but does not show a proportional increase."
The rate at which natural processes, such as ocean uptake, uptake by trees and soil ("greening"), and rock weathering, remove CO2 from the air, is affected in minor ways by many factors, but in a major way by only one: the current amount of CO2 in the air.
Our CO2 emission rate does not and cannot affect the natural removal rate, except indirectly, in the long term, by being one of the most important factors which affect the amount of CO2 in the air.
Eclectic wrote, "looking back in time ~ as the atmospheric CO2 level decreases, the size of the natural sink flux decreases also."
That is correct. It will also be correct looking forward in time, when CO2 levels are falling, someday.
Eclectic wrote, "this directly contradicts your hypothesis of 'if emissions were halved ... atmospheric CO2 level would plateau.'"
If you'll allow me to use "halved" as a shorthand for "reduced to the point at which emissions merely equal current natural removals, rather than exceed them," then those two statements are both correct, and perfectly consistent. It's pCO2 (level), not the rate of CO2 emissions, which (mostly) governs the rates of all the natural CO2 removal from the atmosphere.
Of course there are also minor factors which affect the removal rates. For instance, as we've already discussed, a 1°C rise in water temperature slows ocean uptake of CO2 by roughly 3%. Conversely, a rise in air temperature accelerates CO2 removal by rock weathering. (Sorry, I don't have a quantification of that.) But the main factor which controls the rate of CO2 removals is pCO2.
Eclectic wrote, "While the nutritive components of some food crops may reduce slightly as CO2 rises…"
Oh boy, another rabbit hole! That's the Loladze/Myers "nutrition scare."
It is of little consequence. That should be obvious if you consider that crops grown in commercial greenhouses with CO2 levels as high as 1500 ppmv are as nutritious as crops grown outdoors with only 30% as much CO2.
≥1500 ppmv CO2 is optimal for most crops. That's why commercial greenhouses typically use CO2 generators to raise daytime CO2 concentration to well above 1000 ppmv. It is expensive, but they go to that expense because elevated CO2 (eCO2) makes crops much healthier and more productive. (They don't typically supplement CO2 at night unless using grow-lamps, because plants can't use the extra CO2 without light.)
If elevating CO2 by >1000 ppmv doesn't cause crops to be less nutritious, then elevating CO2 by only 140 ppmv obviously doesn't, either.
Better crops yields, due to eCO2 or any other reason, can cause lower levels (but not lower total amounts) of nutrients which are in short supply in the soil. But that doesn't happen to a significant extent when agricultural best practices are employed.
I had an impromptu online debate about the nutrition scare with its most prominent promoter, mathematician Irakli Loladze, in the comments on a Quora answer. If you're not a Quora member you can't read it there, so I saved a copy here. He acknowledged to me that food grown in greenhouses at elevated CO2 levels is as nutritious as food grown outdoors.
Faster-growing, more productive crops require more nutrients per acre, but not more nutrients per unit of production.
Inadequate nitrogen fertilization reduces protein production relative to carbohydrate production, because proteins contain nitrogen, but carbohydrates don't. Likewise, low levels of iron or zinc in soils cause lower levels of those minerals in some crops. So, it is possible, by flouting well-established best agricultural practices, to contrive circumstances under which eCO2, or anything else which improves crop yields, causes reduced levels of protein or micronutrients in crops.
But farmers know that the more productive crops are, the more nutrients they need, per acre. Competent farmers fertilize accordingly.
Or, for nitrogen, they may plant nitrogen-fixing legumes — which benefit greatly from extra CO2.
If you don’t fertilize according to the needs of your crops, negative consequences may include reductions in protein and/or micronutrient levels in the resulting crops. The cause of such reductions isn't eCO2s, it's poor agricultural practices.
The nutrient scare is an attempt to put a negative "spin" on the most important benefit of eCO2: that it improves crop yields.
Eclectic wrote, "it is (as you state) beyond argument that higher CO2 benefits overall crop yield & plant mass."
That's correct. Moreover, agronomy studies show that for most crops the effect is highly linear as CO2 levels rise, until above about 1000 ppmv (which is far higher than we could ever hope to drive outdoor CO2 levels by burning fossil fuels). That linearity is obvious in the green (C3) trace, here:
That improvement is one of several major reasons that catastropic famines are fading from living memory.
If you're too young to remember huge, catastrophic famines, count yourself blessed. Through all of human history, until very recently, famine was one of the great scourges of mankind, the "Third Horseman of the Apocalypse." But no more. This is a miracle!
https://ourworldindata.org/famines
Ending famine is a VERY Big Deal, comparable to ending war and disease. Compare:
● Covid-19 killed 0.1% of world population.
● 1918 flu pandemic killed about 2%.
● WWII killed 2.7%.
● The near-global drought and famine of 1876-78 killed about 3.7% of the world population.
Eclectic wrote, "other CO2/AGW concomitant effects of increased droughts /floods /heat-waves can be harmful to crop yields in open-field agriculture. [And especially so for the staple crop of maize.]"
Well, let's examine those one at a time.
Heat-waves. Overall, temperature extremes are not worsened by the warming trend. Heat waves are slightly worsened, but by less than cold snaps are mitigated. That's because, thanks to "Arctic amplification," warming is disproportionately at chilly high latitudes, and it is greatest at night and in winter. The tropics warm less, which is nice, because they're warm enough already.
1°C is about the temperature change you get from a 500 foot elevation change. (That's calculated from an average lapse rate of 6.5 °C/km.)
On average, 1°C is similar in effect to a latitude change of about sixty miles, as you can see by looking at an agricultural growing zone map. Here's one, from the Arbor Day Foundation:
From eyeballing the map, you can see that 1°C (1.8°F) = about 50-70 miles latitude change.
James Hansen and his colleagues reported a similar figure: "A warming of 0.5°C... implies typically a poleward shift of isotherms by 50 to 75 km..."
1°C is less than the hysteresis ("dead zone") in your home thermostat, which is the amount that your indoor temperatures go up and down, all day long, without you even noticing.
In the American Midwest, farmers can fully compensate for 1°C of climate change by adjusting planting dates by about six days.

Floods. Theoretically, by accelerating the water cycle, climate change could increase the frequency or severity of floods. But the effect is too slight to be noticeable. AR6 says no change in global flood frequency is detectable:
Droughts. Droughts have not worsened. In fact, the global drought trend is slightly down. Here's a study:
Hao et al. (2014). Global integrated drought monitoring and prediction system. Sci Data 1(140001). doi:10.1038/sdata.2014.1
Here's the U.S. drought trend (the bottom/orange side of the graph):
https://www.ncei.noaa.gov/access/monitoring/uspa/wet-dry/0
Not only does climate change not worsen droughts, it has long been settled science that eCO2 improves plants' water use efficiency (WUE) and drought resilience, by improving CO2 stomatal conductance relative to transpiration. So eCO2 is especially beneficial in arid regions, and for crops which are under drought stress.
Maize (corn) has been very heavily studied. Even though it is a C4 grass, it benefits greatly from elevated CO2, especially under drought stress. Here's a study (one of many):
Chun et al. (2011). Effect of elevated carbon dioxide and water stress on gas exchange and water use efficiency in corn. Agric For Meteorol 151(3), pp 378-384, ISSN 0168-1923. doi:10.1016/j.agrformet.2010.11.015.
EXCERPT:
"There have been many studies on the interaction of CO2 and water on plant growth. Under elevated CO2, less water is used to produce each unit of dry matter by reducing stomatal conductance."
Here's a similar study about wheat:
Fitzgerald GJ, et al. (2016) Elevated atmospheric [CO2] can dramatically increase wheat yields in semi-arid environments and buffer against heat waves. Glob Chang Biol. 22(6):2269-84. doi:10.1111/gcb.13263.
However, I agree with you that putting a monetary value on the benefits of CO2 for crops is difficult. In part that's because the price of food soars when it's in short supply, and plummets when it's plentiful. So, for example, if we were to attribute, say, 15% of current crop yields to CO2 fertilization & CO2 drought mitigation, and value that 15% using current crop prices, we would be underestimating the true value, because absent that 15% boost the prices would have been much higher.
The off-topic is strong in this one.
Daniel Bailey @25 ,
Yes, agreed, the off-topic is strong . . . and the copying-and-pasting is strong . . . and the Motivated Reasoning is strong. Twas ever thus, on the Dark Side of the Force ;-)
Daveburton @24 ,
Thank you ~ and you are quite correct about the [magnitude of] reduced nutritive value of crops in some circumstances. I mentioned the matter briefly (as a one-liner) as a reminder that one is dealing with vastly complex biological systems . . . and that one should avoid having a religious fervor for the undoubted benefits of high CO2 for [most] plants.
Daveburton, you get yourself in a tangle by your third paragraph. "No possible mechanism" [unquote] by which a higher CO2 level could cause an increase in natural carbon sink rate? An examiner would quote that as a Howler, to be circulated for the amusement of his fellow markers. # Dave, possibly you were expressing yourself extremely poorly . . . but either way, you go on to contradict yourself in one of your later paragraphs. And you re-contradict yourself in yet another paragraph. [ Is "re-contradict" an English word?]
And then you re-re-contradict yourself soon after.
[ Oy Veh to the O.E.D. ]
Moving on . . . Daveburton, you are looking at the world through a straw. Please look at the whole world, not just the 49-state USA. Droughts /floods /heat-waves already are (and will be) increasingly problematic, thanks to AGW. Unfortunately, the important staple crop maize [yield] is exceptionately sensitive to high and/or prolonged heat-waves. Luckily, other staple crops are "not quite so much" . . . but the plant geneticists have their work cut out for them, to keep up with future changes.
Yes, Daniel, Mr Burton certainly is consistent in wandering off topic in his comments. At least in this case he followed it off the Hansen post, but now he is mixing in CO2 fertilization and drought.
He is also showing his years of experience in picking cherries.
So many of the "CO2 is plant food" argument depend on studies in greenhouses, etc, where other limiting factors are not limited. The SkS post "Plants cannot live on CO2 alone" provides background. That may be a better place to continue this discussion.
As for his drought comments, he has picked a global diagram (figure 5 out of the Hao et al paper he references) that contains absolutely no regional information at all.
Figure 2 from that paper (available online) shows some examples of the regional droughts as detected by their methodology, but the paper does not provide any information about regional trends. The figure (below) does indicate that "global" really is rather global. I suspect that changes in the desert zones (look at the Sahara) or high latitudes have little effect on agricultural productivity.
Mr. Burton's U.S. drought trend also suffers the same failure: ignoring regional trends. It is also purely a precipitation-based wet/dry analysis - not looking at the important temperature effects on drought. And each classification of "very wet/very dry" is solely an indicator of whether each region is wetter or drier than its own regional value - which tells us very little about drought. Quoting from the original source:
A normally very wet area that is only seeing precipitation in its bottom 10 percent will in all likelihood still be getting more precipitation than a normally dry area that is in its top 10 percent. The student that typically gets 85-95% on exams and score 85% on this one still gets a better grade than the student that typically gets 65-75% on exams and scores 75% on this exam.
If you start to look at regional patterns, other features begin to emerge. SkS had a re-post of a 2018 Carbon Brief article that looks at specifics. It gives a good explanation of the factors other than precipitation that need to be considered. When it comes to agriculture, even the "correct" amount of precipitation can be bad if it is at the wrong time. Fields that are "too wet to plough", crops ready for harvest that are rotting in the fields and can't be harvested, etc.
As usual, Tamino does an excellent job of taking data and picking out regional patterns. He did one in 2019, looking at "The West Burns and the East Drowns - so it averages out, right?". Spoiler alert: the two regions show different trends. Borrowing two of his images:
Tamino also had a post in 2018 about US drought patterns. Again, there are major regional differences, with the west (especially the southwest) getting drier, and the northeast getting wetter.
The sort of analysis that Mr. Burton is presenting is the kind of argument that leads one to conclude that the average person has one testicle and one breast.
Follow-ups on the drought discussion should probably be removed from this thread and posts on the 2018 Carbon Brief article repost.
Daniel @25... So is the Gish Gallop.
I am late for this party as many have provided answers and further explored the subject. I will only mention a couple of things from a post further back that was on the wrong thread.
A citation in that post was this article:
pubmed.ncbi.nlm.nih.gov/26929390/
Quotes of interest from the abstract:
"Greatest yield stimulations occurred in the e[CO2 ] late sowing and heat stressed treatments, when supplied with more water."
"There were no clear differences in cultivar response due to e[CO2 ]. Multiple regression showed that yield response to e[CO2 ] depended on temperatures and water availability before and after anthesis."
My main point was that water availability is the major controlling factor.
Another was not peer-reviewed but a "working paper" from a think tank:
www.nber.org/papers/w29320
This paper claims to establish a causal link between agricultural yields and CO2 atmospheric content. They use a six year sample and then attempt to regress backward to the post-war era. I did not bother downloading the pdf so I am not sure about how they controlloed for other factors in the sample and how they integrated the enormous changes in agricultural methods post-war, like increased mechanization fertilizers, pesticides, herbicides, irrigation, etc. They write this interesting snippet: "In a thought exercise, we apply the CO₂ fertilization effect we estimated in our sample from 2015-2021 backwards to 1940, and, assuming no other limiting factors, find that CO₂ was the dominant driver of yield growth..." So the working paper amonts to a thought exercise involving a rather gigantic assumption.
The third included S.B. Idso as an author, possibly of infamous CO2 Science website affiliation (I did not verify that). I could only access the abstract and it mentioned nothing about other factors than CO2, such as water availability.
In post #24, drought is mentioned and Hao et al (2014) is mentioned, with a graph that generated excitement at WUWT come years ago. The data ends in 2012. Looking at more data extending to recent times reveals a different picture, as shown by Rodell and Li (2023) in Nature Water:
www.nature.com/articles/s44221-023-00040-5
Of course, in greenhouses with very controlled conditions and water distributed carefully, concentrations in excess of 1000 ppm give good results, that remains true.
Dave @22... In order to at least attempt to make this a productive discussion I'm going to focus in on one small point. That is the "greening is turning to browning" which you're rejecting with incessent copy/paste Gish Gallop and little genuine engagement.
Please tell me how you square the idea of "Is natural removal of carbon
from the atmosphere weakening? No..." with the above text in bold, taken from the exact same AR6 FAQ 5.1.
Philippe @ 29:
Yes, SB Idso would be that Sherwood Idso. He has been getting things wrong about CO2 and climate change for something like 40 years, since his early claims that surface temperature was not sensitive to CO2 concentration. He made those claims on the basis of "natural" experiments comparing surface temperature variation to surface changes in incoming IR radiation.
His mistake there was to not recognize that the important IR changes are the ones for outgoing IR radiation at the top of the troposphere (earth energy balance), not the surface ones (surface energy balance). It's such a shame, as he was a very good microclimatologist in his early years. He moved big time into the CO2 is fertilizer realm many years ago.
He's listed at Desmog:
and has turned his denial into a family business, including his sons.
Desmog also has a page on the family business:
I am not at all surprised that Dave Burton would find them a useful source of "information".
Thanks for the additional info Bob. Besides the apparent weaknesses I pointed, that paper was also from 1994 so I wasn't going to put too much stock in it...
Philippe Chantreau at 29,
Here is a free copy of the Rodell and Li 2023 paper. The graphs and tables are at the bottom of the paper. The captions are separate from the graphs.
Helpful Michael, thanks.