


 Arguments


Recent Comments
Prev 1242 1243 1244 1245 1246 1247 1248 1249 1250 1251 1252 1253 1254 1255 1256 1257 Next
Comments 62451 to 62500:
-
skywatcher at 13:04 PM on 29 February 2012It's not bad
ShadedX, the problem is that even if temperatures, say, in northern Canada or Siberia became suitable for growing wheat or whatever, or if it starts raining regularly in somewhere currently desertified (not generally forecast, but lets imagine for a moment)... you will not develop the soils required to sustain agriculture or forestry for many hundreds or more likely thousands of years. Soil development (pedogenesis) is a very slow process - a good example is the vegetation successions you see after ice retreat at the end of past glaciations - trees only thrive thousands of years after the first colonising grasses and shrubs. -
skywatcher at 12:54 PM on 29 February 2012It's the sun
ShadedX, coronal Mass Ejection (CME) activity varies with the activity of the Sun in it's approximately 11-year cycle, see for example this SEC plot. The ~2000 peak was reasonably large, and followed by the deepest solar minimum in many decades near 2009. The next peak is forecast to be much smaller, peaking in 2013 or 2014. The cyclicity does not explain long-term global warming, and the past decade has been dominated by the progression from the last solar max to the deep solar min. CMEs themselves have little to do with Earth's climate, except that there are more when the Sun is a bit more active. -
ShadedX at 12:21 PM on 29 February 2012It's not bad
I bet this has already been metioned, but what happens when the ice caps melt? Wouldn't high up northern places become habitable? How about the deserts , which will border the oceans, creating new forests for all. And most of all, wouldn't it be great for microorganisms (especially Archea) to live, therefore giving us new lifeforms that take the place of the old niche of the old lifeform -
ShadedX at 12:16 PM on 29 February 2012It's the sun
And as for you scaddnep, I am not talking about a star's lifetime. -
Camburn at 12:09 PM on 29 February 2012Satellites find over 500 billion tons of land ice melting worldwide every year, headlines focus on Himalayas
Prof P. Body@ 92: Yes, Rob's graphic at 29 would have used the data that supports slide number one of the following site. NODC global ocean heat and salt content You will note that the graph confirms my statement concerning THC of the 0-700M volume of the ocean. The trend of surface sea temperature would also seem to confirm the 0-700M OHC. SST 2003-2012 -
Jose_X at 11:24 AM on 29 February 2012Radiative Balance, Feedback, and Runaway Warming
That WUWT thread was closed, but it does present a number of questions to simpler radiative balance models. The main problem with the article is that it claims to present a model that is better than what climate science uses but it attacks a weak model that is not used by climate science. 2.1 A) The authors fail is to ignore an assumption of the model. Their criticism is thus not accurate. The 1-shell model assumes global surface temperatures are relatively similar. This assumption is why the simple model gets ballpark figures. This assumption implies that diffusion of heat through the atmosphere, wind/advection, and even side-to-side radiation together are highly efficient and help preserve the temperature everywhere on earth within a very "narrow" range. Because of this assumption implicit in the model, convection and 3D radiation need not be modeled explicitly, but their existence is leveraged as it is clearly a requirement for justifying using S/4. While observed temperatures around the world are not all even, these assumptions appear to be acceptable to first approximation. Note that clearly no significant chunk of earth's surface air temperature is near 0 K or near 120 C, the two extremes based solely on sun's irradiance. So the authors ignored this assumption of the model. Were it not that the model *does* consider convection indirectly, the points raised in this section would have merit. Their math is accurate. Although, the cs constant is virtually redundant (doing little beyond adding at least 2 extra irrelevant "significant" digits to a term). Yes, it is true that if you average many temperatures near 0 K as well as a few near 100 C and everything in between (weighted largely towards the low values), you get something rather different and significantly lower than the actual average. [I spent some time making sure the integral was set up properly (that the error from the strips making up the approximating polyhedron to the hemi-sphere did go to zero as the partition sizes got smaller). It was accurate (and I got to practice and gain insight into describing surfaces of integration). To come to that understanding, I first recognized that the outer integral with no phi dependence meant we were going around the circle adding up symmetrical "tangerine peel" slices. The d(cos (theta)) was also expanded to -sin(theta)d(theta), where theta varies from pi/2 to 0. We see that each differential (tiny) rectangle in a peel slice approaches the exact area of the underneath sphere (which looks like a flat plane). This is so because the sin (theta) factor makes sure the differential rectangles nearer to the poles are smaller exactly as dictated by the ratio of the minor circle at that latitude to the major circle at the equator (that ratio being sin(theta)/1). Since a tiny rectangle's % error goes to 0 as it gets teenier, we know the overall sum error also goes to 0 (eg, factor out the %-bounded error of each rectangle being added). With this verified, we return to d(cos (theta)) to enable a painless integration. The actual calculation is essentially K * integral (x^1/4 dx) = K*(4/5)*(x^5/4) to be evaluated from 0 to 1. Note that the dark side of the earth gets zero solar radiation, and this is accurately modeled since the integral approximating limit adds "tangerene peel" slices around only a hemisphere... yet then divides by the full surface area of the unit sphere, 4*pi.] 2.1 B) A few flaws exist in this section. First, we are adding convection to a model that already implicitly accounts for it in the lateral direction. This means that the conductance values given cannot be used since air cannot simply flow up and down at calculated linear rates while also flowing to the sides at possibly comparable rates. [Simple solution is to reduce the conductance value by 10-30%.] Second and most importantly, it fails to account for the gravitational potential energy cost of rising air, that is, for the natural equilibrium lapse rate. This mandates at least that Ta be made dependent on height (another change to the model). The simplest approach here is to set h to the height of TOA, but there are other possibilities (and emissivity would depend on height as well). Ts - Te will not be near zero but to first approx will be near the lapse rate requirements. Third, the equations solve for a steady state value. The equations are essentially devoid of a time dependency so assume S is constant. Since the earth rotates, the equilibrium values may not be reached, or at least S should be modeled as a function of time and other time dependencies should be introduced. [This point may be negligible. I haven't studied this physics, but I wanted to also list some *potential* flaws that have crossed my mind.] 2.1 C) This says very little. Keep in mind that it is criticizing what is known to be a weak radiation model. The model fails to explain the high DLR near the ground, true. One major reason for this is that H2O has a tremendous GHG effect here. A one shell model that is bound by TOA requirements obviously will fail. We would need a minimum of two shells (or a thick shell that has Te1 at the top and Te2 at the bottom). And the bottom layer would need to have an emissivity value to match the higher ghg effect of concentrated H2O. [Hottel, Leckner, and others have measured emissivity values. We can also use Beer Lambert law.] -
Camburn at 10:43 AM on 29 February 2012Radiative Balance, Feedback, and Runaway Warming
Ok....I didn't miss that thread, but I didn't spend much time reading it either. Within a few paragraphs it got so silly that it wasn't worth wasting time on. Somehow, I don't think the Unified Theory of Climate is the deathbed of AGW. I could be wrong, but if I am I promise that I will buy back that bridge I am now offering to anyone who believes this theory. In fact, I will even buy it back at twice the purchase price. And this is one inexpensive bridge. In fact, 100K will make a downpayment on it. Please respond to this offer via this site. IF the site slows down because of the interest in the bridge, just give it time, and I am sure your offer will make it through. Good luck on the bidding. -
DrTsk at 08:40 AM on 29 February 2012Greenhouse Effect Basics: Warm Earth, Cold Atmosphere
KR correct ~0.4% change in area vs. 15% change in pressure -
GillianB at 08:36 AM on 29 February 2012Mythbusting with fewer explosions
I went to the session in Lane Cove's fabulous new library (it's gorgeous!) and found it to be an interesting evening. Most attendees were already concerned about climate change and no diehard deniers were vocal. The format was fun because it promoted active learning by putting the audience in charge. Most of us learnt something new, or were reminded of things we had forgotten. What do I remember 12 hours later? Two things stand out.. I remember John's fridge door analogy that explains why a warmer arctic can lead to a colder Europe. I remember a couple of the graphs... the graph of 20th century temperatures is memorable because of John's explanation for why temps were stable in 1950s and 60s. That's a good example of the point in John's ABC article that it is memorable when a 'knowledge gap' appears and is filled. (John gave industrial sulphate pollution in the 1950s and 60s as the reason. Which leads me to wonder how much MORE warming we would see now if Chinese/Indian industry was clean.) All in all, it was very worthwhile. It's great to see John developing these excellent communication skills. I hope he continues to speak out, and that he can withstand the garbage thrown at effective communicators in this field. -
skywatcher at 08:30 AM on 29 February 2012Greenhouse Effect Basics: Warm Earth, Cold Atmosphere
And Steve Case, perhaps you could educate GallopingCamel (comment #40 on this thread) as to the greenhouse effect operating. GC believes some crackpot theory about gravity he read on WUWT... Very few people, indeed, disagree with the basic radiative forcing properties of CO2 that have been demonstrated for many decades, yet there are still enough to sow all sorts of confusion and misinformation. -
skywatcher at 08:23 AM on 29 February 2012Greenhouse Effect Basics: Warm Earth, Cold Atmosphere
Lovely post Tom, very nicely explained. Steve Case, so you accept the fundamentals of CO2 causing warming (which puts you in a different league to Yogi, who clearly does not think this), but you don't accept the feedbacks. Some reading for you, then. Read the following post, the sixteen peer-reviewed papers that are referenced therein, and the five linked blog posts with further references to the literature: Empirical evidence for positive feedback. If you doubt the evidence presented there, maybe you could comment over there as to why positive feedbacks don't exist. And also then give us your hypothesis as to how we had ice ages... -
Greenhouse Effect Basics: Warm Earth, Cold Atmosphere
DrTsk - Given that the radius of the Earth is ~6350km, and changes in top of troposphere are <1km, effective area changes are a trivial influence. And more than balanced by the fact that lower pressure requires a slightly higher temperature (as there are fewer molecules) to emit the same energy. However, those all represent very small changes in the spectra. -
Kiwiiano at 08:15 AM on 29 February 2012Mythbusting with fewer explosions
owl905: Neville Chamberlain knew damn well what he was up against, he also knew that the British military were woefully wound down and ill-prepared for the inevitable. The "peace in our time" was a charade to give them time to frantically remobilise and rearm. back to the topic.... ;^) -
DrTsk at 07:57 AM on 29 February 2012Greenhouse Effect Basics: Warm Earth, Cold Atmosphere
@11/boba/Kevin As the altitude increases the effective area increases and so the same amount of energy can be radiated at a slightly lower temperature -
scaddenp at 07:55 AM on 29 February 2012Radiative Balance, Feedback, and Runaway Warming
Camburn - it is GC's link unified theory of climate. Spenser has take on it by the way too - see his 30 Dec 2011 article. -
Greenhouse Effect Basics: Warm Earth, Cold Atmosphere
boba, Kevin C - As the effective emission altitude increases, and given that the lapse rate means cooler air at higher altitudes, the amount of energy radiated to space will (initially) decrease. That means less energy leaving the atmosphere, and the climate warms. To a first order approximation, the atmosphere warms enough that the effective altitude is emitting same amount as the incoming energy - so it ends up near the same temperature (although pressure effects play into it as well), radiating away the same energy as before. -
scaddenp at 07:47 AM on 29 February 2012It's the sun
ShadedX - sorry but it doesnt follow. The path for stellar evolution is that heat from the sun will rise very very slowly (and has been doing so through geological time). As fuel is spent, it will expand and eventually engulf the inner planets, including possibly earth. But not for a few billion years. -
Kevin C at 07:41 AM on 29 February 2012Greenhouse Effect Basics: Warm Earth, Cold Atmosphere
boba: I believe that is the case. My crude explanation of the effect is that the increase in CO2 content increases the opacity of the whole column of gas. However the gas gets thinner as you go up, reducing the opacity. At some point the opacity gets low enough that a good proportion of the IR photons can escape without further re-absorption. As the opacity of the whole column increases due to increasing CO2, that height gets higher. I think it must be rather more complex than that though, because the emitted radiation higher up is at a lower temperature. Which means there are different number of photons being emitted in the transparent and opaque bands. I presume that codes like MODTRAN have to deal with that. -
RonManley at 07:40 AM on 29 February 2012Greenhouse Effect Basics: Warm Earth, Cold Atmosphere
It was predicted that one of the fingerprints of climate change would be warming of the troposphere at around 10 km altitude. I did my own analysis a few years ago and showed that this was indeed the case. -
New research from last week 8/2012
keithpickering - Good references. One important point in the discussions of those threads is that a step-change (although easy to fit to the data) is not meaningful unless the underlying physics would include such a step change. The model fit to the data has to make physical sense - and 'step changes' with large instantaneous energy changes really do not. -
Alexandre at 07:05 AM on 29 February 2012Greenhouse Effect Basics: Warm Earth, Cold Atmosphere
Steve Case: don't know if you challenge the accepted climate sensitivity, but denialists claims don't really know many boundaries. They freely wander from denying the warming, to denying the causes, to opposing the policies... and back step 1. One claim can be refuted, but moving goalposts are impossible to catch up with, specially in the attention span available from the broader audience. Like the Denial Tango goes, "I'm skeptical of everything I just don't wanna know". -
keithpickering at 07:03 AM on 29 February 2012New research from last week 8/2012
Regarding Jones and step-change, Tamino has dealt with that pretty convincingly, here, here, and here. Basically, it's pretty easy to show that a step-change model is statistically better than a no-change model. It's a lot harder to show that it's better than linear, or that it's the best possible model. -
boba10960 at 07:00 AM on 29 February 2012Greenhouse Effect Basics: Warm Earth, Cold Atmosphere
Tom Curtis: Thanks for the very helpful information! A related point has been unclear to me for a long time and I wonder if you can clarify it for me. Does the average altitude from which IR radiation is lost to space from the atmosphere depend on the concentration of greenhouse gases in the atmosphere? If so, then how does this affect the overall greenhouse process? There were comments at this site some time ago (too long for me to find them now) that led me to believe that increasing the CO2 content of the atmosphere raises the average altitude from which IR radiation escaped to space. Ever since that time I have wondered how that works (if true), and your post has stimulated me to ask. Thanks, Bob -
scaddenp at 06:59 AM on 29 February 2012Radiative Balance, Feedback, and Runaway Warming
So GC, as a physicist, how "skeptical" have you been of this unpublished work? And how do you reconcile it with say the standard physics of Grant & Petty? -
Alexandre at 06:58 AM on 29 February 2012Greenhouse Effect Basics: Warm Earth, Cold Atmosphere
Nice post, Tom. It's an effective way to explain physics through the knowledge people intuitively already have. -
Eric (skeptic) at 06:51 AM on 29 February 2012Satellites find over 500 billion tons of land ice melting worldwide every year, headlines focus on Himalayas
CBDunkerson, thanks for the info on evaporation. I would argue that is part of the exponential decay of the bulk of excess rainfall measured in river levels (i.e. when the rains return, the preceding evaporation will dictate river levels.) Australia seems to have some fascinating exceptions in some cases being low and flat, I'll have to comment more in that thread. In the meantime here's the Mississippi which I saw in 1993 in St Louis; needless to say it left an impression. http://waterdata.usgs.gov/nwis/dv?cb_00060=on&format=gif_default&begin_date=1993-01-01&end_date=1997-01-01&site_no=07010000&referred_module=sw If the link above works it should show the relatively rapid decay of very large volumes of flow, but also a slow decay, on the order of a year or two from the enormous flood of 1993. I don't know how much of that is rainfall patterns and how much is water storage. But it does reflect both the direct runoff and the indirect evaporation (that lowers direct runoff); both of which lower the amount of water stored. -
Bob Lacatena at 06:40 AM on 29 February 2012Greenhouse Effect Basics: Warm Earth, Cold Atmosphere
1, Steve Case, Not to pile on too much, but... Very few people don't believe in the greenhouse effect. Very few people don't believe the earth is warming. Very few people don't believe that fossil fuels are the cause. Very few people don't believe warming will be bad. Very few people don't believe feedbacks will make it worse. Very few people don't believe that Arctic ice melt is related to warming. Very few people don't believe that... The list goes on and on. That's what is so wonderful about denial. There are so very many delicious flavors to choose from! And you can always couch your own particular passion with "well, yes, of course that's true, but..." And so there is a very, very large denial choir, all singing different songs, out of tune, at the tops of their lungs, and it adds up to inaction and ignorance. So every step along the way the most obvious things must be explained, as clearly and as simply as possible, so that bit by bit the cacophony of that very large and very diverse choir will slowly but surely, member by reluctant member, start to sing the same, harmonious song... and cut the crap and let us get on with the arduous task of fixing the problem rather than arguing about whether or not science is science. -
DrTsk at 06:26 AM on 29 February 2012Greenhouse Effect Basics: Warm Earth, Cold Atmosphere
Steve Case, You are preaching to a very large choir. Very few people disagree that the green house effect operates But the choir must do its job too!! People, like YOGI, elsa, and their cohorts that are spouting their giberrish should be countered strongly and permanently. -
owl905 at 06:19 AM on 29 February 2012New research from last week 8/2012
AGW Observer is an excellent resource site. The draft of the Cohen et. al. is a clue in the puzzle. Right around the fastest warming subsystem on the planet is the Taiga bucking the global trend - Figure 3 after the body. The value is seeing it as a long-term exception and not just the headline maker of a few recent winters. The other early interest-point is the AO influence (Figure S4) - the MERRA re-analysis observation is strong negatives (high pressure) AO trends where the model ensemble reflects the current recordings of slight positive. It has no effect on the Taiga anomaly observation. It will have a strong influence on forming conclusions about the anomaly. -
Phila at 05:41 AM on 29 February 2012Greenhouse Effect Basics: Warm Earth, Cold Atmosphere
Steve Case, You are preaching to a very large choir. Very few people disagree that the green house effect operates Yes, very few people disagree with this. But unfortunately, they're represented in relatively high numbers in "skeptical" circles, which makes this post timely and necessary. Personally, I've debated "skeptics" who didn't know that there's a difference in seasons between the northern and southern hemispheres, and who assumed that snow storms are basically impossible on a warming planet. I've also dealt with "skeptics" who assume that carbon dioxide can't affect the climate because it's heavier than oxygen. And believe it or not, they don't necessarily back off when you point out that atmospheric gases don't form layers based on weight, as evidenced by the fact that we haven't all been asphyxiated. As we've seen again and again, this is what happens when a political movement exploits public ignorance for its own gain: After a while, no fact is too simple or obvious to require a clear explanation. That's why people on the scientific side of this argument have to work so much harder than "skeptics" who can spout any pseudoscientific gibberish that flatters people's prejudices. -
Prof P. Body at 05:39 AM on 29 February 2012Satellites find over 500 billion tons of land ice melting worldwide every year, headlines focus on Himalayas
@ Camburn Could you be a good chap and elaborate on your claim you made earlier that"ARGO data, while short, shows a reduction in THC of the oceans in the 0-700M volume."
Looking at the source you reference (comment 29)"DB@56: Refer to Rob Painting at 29 of this thread. He posted the temperature data of the 0-700M volume."
For the life of my sainted mother, all I see is the graphic Rob P. posted from Roemmich and Gilson 2011, but not any data. If memory serves, Roemmich and Gilson 2011 focus on the Argo 2005-2010 dataset, of which one might construe Rob P's graphic to be representative. Can you share with us the significance testing you used to examine the data from Roemmich and Gilson 2011? I presume you actually went back to the source data itself to make your claim...right? It would be a deucedly tight bit to have the stones to use that, what is it called again? Eyecrometer? In lieu of actual analysis, what? Also, when you impute that there is a reduction, to what are you comparing the 2005-2010 dataset? Because it would seem to either nothing or itself. Naught very scientific of you, old bean. -
Camburn at 05:38 AM on 29 February 2012Satellites find over 500 billion tons of land ice melting worldwide every year, headlines focus on Himalayas
Tom@88: That you for the compliment. Always appreciated. The widget works well for areas that I know about. And I do know the Mississippi watershed veryyyyy well, as well as the Red River Watershed. Greenland is self explanatory. South America is in my farm news eyecromiter daily, as well as Asia because Asia is a large buyer of commodities. Thanks again. -
Camburn at 05:31 AM on 29 February 2012Radiative Balance, Feedback, and Runaway Warming
Chris: Can you post a link to the WUWT thread you are talking about? I go there on occasion, yet seem to have missed that thread. I would like to read what arguement is the deathbed of AGW. Thank you. -
Rob Painting at 05:28 AM on 29 February 2012Satellites find over 500 billion tons of land ice melting worldwide every year, headlines focus on Himalayas
Tom Curtis - "With regard to the overall balance, unfortunately I do not have figures. The graph shown above was prepared by Josh Willis of NASA, who indicated that it at least partially explained the drop in sea level. I assume, therefore, that he has done a balance which shows a net accumulation of surface water in 2010. I am not aware of its having been published' A paper by Carmen Boening (NASA JPL) on this subject should be out soon. Last time I checked she informed me it should be out in the early part of this year. I'll incorporate it into the advanced rebuttal of: Sea level fell in 2010. -
Rob Painting at 05:17 AM on 29 February 2012New research from last week 5/2012
Rob Murphy - I'm writing up a rebuttal to that meme. The temperature of the troposphere has an effect on cloud formation and height - cooler = lower cloud top height, and warmer = higher cloud top height. The details are a lot more complicated of course. As you point out, the trend over the 'noughties' was weak ENSO (La Nina/El Nino) at the beginning of the decade, and strong ENSO at the end. The La Nina centred on 2008 was particularly strong and lasted for 22 consecutive months. So it's hardly surprising the trend over the decade was toward lower cloud height. There's no evidence this is a negative feedback, that's just a 'Chicken Licken' interpretation of the evidence. -
Chris Colose at 05:08 AM on 29 February 2012Radiative Balance, Feedback, and Runaway Warming
It is always amazing to see how many radical paradigm shifts occur at WUWT and yet never get published, appear in any textbooks, or get discussed by the broader community. If WUWT were always right, essentially all sub-disciplines of climate, planetary science, astronomy, etc would need radical revision. Now since most have us have grown up to feel the need to glorify everyone's pet theory and opinions, and that many have a "Galileo" interpretation of how science generally advances, I suspect it won't be good enough to ask people to think about the above paragraph and have some self-skepticism. I also doubt it would be good enough to ask people who believe that sort of stuff to go buy a thermodynamics and radiation textbook, because I'm quite confident they have no interest. Of course, everyone at WUWT have bought into the argument as the deathbed of AGW, just like every other post they out up there, even if those other posts completely contradict that idea (such as Lindzen's post, which recognizes the existence of a greenhouse effect, but thinks sensitivity is very low). The only reasonable comments I've seen on that thread are from Joel Shore, who also co-authored the rebuttal (wuth me, and others) the Gerlich and Tscheuschner nonsense). I defer you to his points because I don't think it's worth discussing much. Needless to say, the article does not understand why convection occurs, or how to apply the laws of thermodynamics. It sort of gives the impression that none of this has been thought of before, yet it forms the foundation of basic atmospheric science and is taught in every undergrad atmospheric science department I know of. -
Satellites find over 500 billion tons of land ice melting worldwide every year, headlines focus on Himalayas
Camburn - Visual assessment of that map will not be reliable. For that you need to actually run the numbers, not the eyecrometer. Lake impoundment, ground water impoundment, ongoing precipitation increasing the water mass despite increased drainage - none of these mass shifts are 'single events' which might then drain, they are part of a pattern of precipitation shifts due to the recent La Nina's. I would look for Willis to publish on the topic. In the meantime, I would take his opinion as to mass shifts to land, as supported by his data, to indicate a partial explanation for recent reductions in SLR. And until/unless you have contradictory global data, that's the best information we have. -
Tom Curtis at 04:35 AM on 29 February 2012Satellites find over 500 billion tons of land ice melting worldwide every year, headlines focus on Himalayas
I must congratulate Camburn on having so advanced an eyecrometer; and congratulate him still further for having the foresight of adding a widget that always allows him to see only what he wants to see. -
Camburn at 04:30 AM on 29 February 2012Satellites find over 500 billion tons of land ice melting worldwide every year, headlines focus on Himalayas
1. It is very obvious when looking at the map above that the excess/deficit water in North and South America basically cancel each other out. 2. Even tho the Northern Area of Greenland is accumulating water, Greenland as a whole is loosing mass. This loss of mass has not slowed down even tho it has snowed more on the northern area. The blue area of Greenland then becomes a net contributor to SLR, not a deficit. 3. According to Tom, Australia is a basin and has very slow run off. I will believe him without requesting documenation, as local knowledge and observations provide 1st hand evidence. 4. The drought areas of Asian and Africa bascially cancel each other out as they are very simliar in magnitude. One a deficit, one a surplus. The only exceptionally wet years appear to have affected Australia, but on a continental basis of other continents, the dry and wet areas appear to cancel each other out. -
Tom Curtis at 04:24 AM on 29 February 2012Satellites find over 500 billion tons of land ice melting worldwide every year, headlines focus on Himalayas
Eric (skeptic) @84, some of the floods of 2010 will have drained very quickly. The Pakistani floods, for example. But except on the coastal fringe, the Australian floods do not. As I have noted elsewhere flood water in Queensland takes 9-10 months to reach Lake Eyre (for the more western waters, and a similar period to reach the mouth of the Murray (for the more Eastern waters). Even the Victorian floods took up to a month to drain away, and probably a couple of months to reach the mouth of the Murray. That is probably atypical, but as the example of the Nile shows, not exceptionally so. It is certainly far from atypical once you include the effect of frozen precipitation not thawing until summer (in some regions) or of dams and the filling of lakes, or in one instance the partial refilling of the Aral Sea. With regard to the overall balance, unfortunately I do not have figures. The graph shown above was prepared by Josh Willis of NASA, who indicated that it at least partially explained the drop in sea level. I assume, therefore, that he has done a balance which shows a net accumulation of surface water in 2010. I am not aware of its having been published. Finally, this will be my last post on surface waters effect on sea level on this thread, where it is significantly of topic. If you want to continue the conversation, may I suggest the thread of my first link. -
CBDunkerson at 04:18 AM on 29 February 2012Satellites find over 500 billion tons of land ice melting worldwide every year, headlines focus on Himalayas
Eric wrote: "I am mostly looking at when the bulk of the water exits through the rivers." The bulk of it doesn't exit through the rivers. Average annual precipitation on land is about 26,000 mi^3 of water. Average annual evaporation from land is about 17,000 mi^3 of water. That leaves ~9,000 mi^3, a little over a third, to be lost through runoff into rivers and other means (e.g. subsurface flow). This assumes balanced flows, which is true for a long term average but not for individual years (such as the recent exceptionally wet years). Also: "There is no doubt, for example, that the bulk of the waters of record floods that you talk about drain very quickly." 'Very quickly' is a meaningless term without some sort of frame of reference. The few months it usually takes for half of the precipitation which falls on land to be removed is indeed 'very quick' on a geological time scale. -
Eric (skeptic) at 03:52 AM on 29 February 2012Satellites find over 500 billion tons of land ice melting worldwide every year, headlines focus on Himalayas
Tom, do the drier areas of earth offset the wetter ones like Australia? Is there anywhere I can get totals? Specific to your arguments above, I am mostly looking at when the bulk of the water exits through the rivers. There is an exponential decay and you and I have to identify which part of the curve we are talking about. The higher the starting point, the faster the decay. There is no doubt, for example, that the bulk of the waters of record floods that you talk about drain very quickly. OTOH, a look at the mighty Mississippi at St Louis shows a few years of higher flow at a time and I need to identify how much of that is a wet pattern and how much is the decay from previous wet periods. -
Tom Curtis at 03:38 AM on 29 February 2012Greenhouse Effect Basics: Warm Earth, Cold Atmosphere
Steve Case @1, I am glad that you are part of that very large choir, and hope you make sure you sing your part when that theory is challenged, as if frequently is, at WUWT and other so called "skeptic" sites. My experience has been, however, that even these basics are challenged frequently and vehemently by many so-called "skeptics", while others who should know better stand idly by, or egg them on. -
Steve Case at 03:30 AM on 29 February 2012Greenhouse Effect Basics: Warm Earth, Cold Atmosphere
You are preaching to a very large choir. Very few people disagree that the green house effect operates and that doubling of CO2 ought to raise the temperature about 1.2°C. Here's what it says in Chapter 8 of the IPCC's AR4: 8.6.2.3 What Explains the Current Spread in Models’ Climate Sensitivity Estimates?- In the idealised situation that the climate response to a doubling of atmospheric CO2 consisted of a uniform temperature change only, with no feedbacks operating (but allowing for the enhanced radiative cooling resulting from the temperature increase), the global warming from GCMs would be around 1.2°C (Hansen et al., 1984; Bony et al., 2006).
-
Robert Murphy at 03:22 AM on 29 February 2012New research from last week 5/2012
Concerning the Davies and Molloy paper; I'm having trouble seeing the data as indicating a negative cloud feedback to global temperature change. Wouldn't such a feedback mean that an increase in temperature would cause a decrease in cloud height, and vice versa? And wouldn't such a feedback be very quick with little lag? Looking at the cloud height graph over the ten year period used, sometimes temperature goes up and clouds go lower, and sometimes they go up and down in tandem. It's also a very short time frame.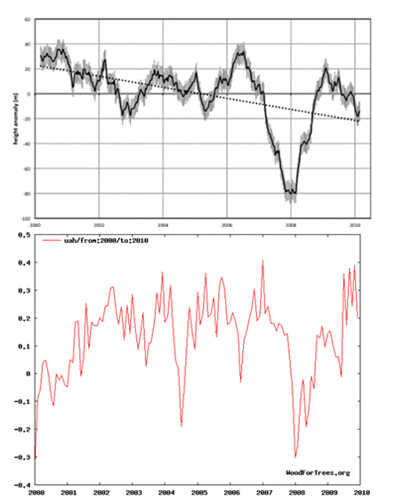 Above is the graph from Davies and Molloy (top) showing cloud cover height anomaly from 2000-2010 and a WoodForTrees graph of UAH temperature anomalies (bottom) for the same period (I didn't perfectly line them up in Photoshop - the bottom graph is slightly offset to the right). Other data sets show similar ups and downs, especially for the second half of the graph.
During the first couple of years, temperature goes up and cloud height decreases. The 2004 dip in temperature doesn't seem to show up in cloud height. In the last few years, temperature and cloud height mostly go up and down together. Look at that big dip in cloud height centered around 2008. Notice that's right at the height of the La Nina, and also that it's the coldest time in the ten year period. How does that support a negative cloud feedback to rising temperatures? I freely admit I'm probably missing something and I realize how dangerous relying on the eye-crometer can be.
I'm also curious as to why 2010 and 2011 (or most of it) were not included. Does it take that long to tabulate the data? The paper was submitted 11/30/2011.
I'm wondering if they are just using the overall trend of decreasing cloud height and the increasing trend in temperature (for some data sets but not all for that time period) and seeing a correlation that doesn't have a causation. I know they do speak candidly of the need for another decade of data to see how cloud height reacts, so they are aware of the possible tenuousness of the link. I've already seen the "Study shows cloud feedback is large and negative" meme pop up on places like WUWT. I'd like to have something to say as a counter.
Above is the graph from Davies and Molloy (top) showing cloud cover height anomaly from 2000-2010 and a WoodForTrees graph of UAH temperature anomalies (bottom) for the same period (I didn't perfectly line them up in Photoshop - the bottom graph is slightly offset to the right). Other data sets show similar ups and downs, especially for the second half of the graph.
During the first couple of years, temperature goes up and cloud height decreases. The 2004 dip in temperature doesn't seem to show up in cloud height. In the last few years, temperature and cloud height mostly go up and down together. Look at that big dip in cloud height centered around 2008. Notice that's right at the height of the La Nina, and also that it's the coldest time in the ten year period. How does that support a negative cloud feedback to rising temperatures? I freely admit I'm probably missing something and I realize how dangerous relying on the eye-crometer can be.
I'm also curious as to why 2010 and 2011 (or most of it) were not included. Does it take that long to tabulate the data? The paper was submitted 11/30/2011.
I'm wondering if they are just using the overall trend of decreasing cloud height and the increasing trend in temperature (for some data sets but not all for that time period) and seeing a correlation that doesn't have a causation. I know they do speak candidly of the need for another decade of data to see how cloud height reacts, so they are aware of the possible tenuousness of the link. I've already seen the "Study shows cloud feedback is large and negative" meme pop up on places like WUWT. I'd like to have something to say as a counter.
-
Tom Curtis at 02:59 AM on 29 February 2012Satellites find over 500 billion tons of land ice melting worldwide every year, headlines focus on Himalayas
Eric (skeptic) @81, the amount of time from rainfall to run off to the sea depends critically on a number of facts of geography which are highly variable across different regions in the world. For example, rainfall in Ethiopia can take half a year to reach the sea even as direct run off due to the shere length of the Nile through which it flows. Rainfall from around Texas, Qld can take as much as a year to reach the mouth of the Murray. That excludes water that enters aquifers. Water entering surface aquifers in central Qld will never reach the sea by drainage. Therefore a simple assumption that rainfall will reach the sea in weeks or a few months at most (as made by Camburn) is completely unwarranted as a generalization. (I am not concentrating on QLD because it is typical, but only because it is familiar.) Furthermore, Camburn's argument that the rainfall would all reach the sea in short duration is premised on the absurd assumption that most of the rainfall occurred at the same time. Because floods are not typically coincident, major flooding in different regions at different times can result in increased global surface water for extended periods. This applies even to individual regions. Victoria experienced major flooding in 2010, record breaking flooding in early 2011, and is now threatened with new record breaking floods. I have elsewhere detailed Queensland's new record for flood effected area in March of 2010, which was smashed in Dec 2010/ Jan 2011 by almost a factor of three, and has been followed up by record breaking flood depths (not extent) in new floods in South West Qld in Feb of this year. My list is not exhaustive for these two states. In the face of records like that, Camburn's argument about runoff times, in addition to failing on its merits, is clearly seen for what it is - an evasion. Finally, all of this debate is beside the point. If you look at the GRACE image @65 above, you will see it is a years worth of data. That is, averaged over a year, Australia had the equivalent of a layer of water 3 to 5 cms across its entire surface. Of course, most of that water was in ground water, or fuller rivers and lakes, and of course in periods of intense flooding. But it is the effect over a year. In the face of that, arguing that water runs of in a week or so so it cannot have a year long effect on sea levels is obtuse, to say the least. -
dunc461 at 02:56 AM on 29 February 2012Climate change models underestimate future temperature variability; food security at risk
Even without the effects of climate change on food production it is going to be a serious problem. Apparently there are 3,411,327,592 acres of arable land and 12,067,879,561 acres of agricultural land which includes arable land, permanent crops and permanent pastures. http://en.wikipedia.org/wiki/Arable_land Per the Oak Ridge National Laboratory there are 3,657,159,639 acres of cultivated and permanent crop land leaving 8,410,719,923 acres of pasture. http://daac.ornl.gov/NPP/other_files/worldnpp1.txt At a world population of 7 billion that equates to 0.52 acres/person of crop land and 1.2 acres per person of pasture . But not all crop land is used to produce food. 388,888,889 acres are used to produce grain for beer. Table 8 below plus http://en.wikipedia.org/wiki/Beer http://cruisenews.net/brewing/ 85,992,673 acres of cotton http://unctad.org/infocomm/anglais/cotton/market.htm#prod and 47,196,385 acres of grapes for wine http://www.wineinstitute.org/files/WorldWineProductionbyCountry.pdf http://www.boutiquewineries.com.au/articles/HowManyGrapesinaBottleofWine.cfm Subtracting this acreage from the total crop land reduces the acres/person for crops to 0.45. The Median UN projection for 2050 is 9.2 billion reducing the numbers with no change in land use to 0.34 and 0.91 acres/person respectively. Based on data from Table 8 http://books.google.com/books?id=vHprLAOlOkYC&pg=PA43&lpg=PA43&dq=what+crops+has+the+highest+caloric+yield&source=bl&ots=pv1C7ha9Kj&sig=UYSqCeS_PYvoWJX40Vthsl1siIM&hl=en&sa=X&ei=dJAmT-f-Luna0QH3gfnbCA&sqi=2&ved=0CDkQ6AEwAw#v=onepage&q=what%20crops%20has%20the%20highest%20caloric%20yield&f=false It takes 0.45 acres of wheat to produce 2000 calories/day and 0.36 acres of rice, 0.26 acres for yams and sweet potatoes and 0.15 for Cassava. Clearly we can feed the projected world population in 2050 if we all become vegetarians or Ovo-lacto vegetarians. Based on a 2000 calorie/day diet, with 550 calories/day (`6 ounces) of protein from equal parts chicken, eggs, pork and beef I estimate the protein for one person would take 1.4 acres, with fruits, vegetables, grain, dairy and oil taking another 0.36 acres. Substituting soybeans for meat would drop the total to 0.39 acres /person. Elimination of dairy would reduce the total further to 0.17 acres /person. There were too many sources used to develop this information to site here. I think I have developed the concept far enough to indicate that there will be strong pressure in the future to convert more land to cropland for food production, with a possible significant increase in carbon emissions, especially if we start using crop land to produce bio-fuels or site solar cells. -
CBDunkerson at 02:56 AM on 29 February 2012Satellites find over 500 billion tons of land ice melting worldwide every year, headlines focus on Himalayas
Eric wrote: "Surface water decays in days." Ummm... you've never seen a lake? Or snow? Technically if they ever 'decay' (by which I assume you mean the mass of water decreases) at all then whatever time frame that takes place in could be measured in "days"... but the '~11,680,000 days' the water of the Great Salt Lake has existed thus far would be a fairly ridiculous method of measurement. It is decaying, and presumably will eventually disappear entirely... but we are talking about alot of days. -
Eric (skeptic) at 02:47 AM on 29 February 2012Postma disproved the greenhouse effect
I think the link in post 53 should be: http://skepticalscience.com/argument.php?p=1&t=55&&a=509#75803Response:[DB] Fixed, thanks!
-
Eric (skeptic) at 02:23 AM on 29 February 2012Postma disproved the greenhouse effect
Thanks Tom. I read that absorptivity and emissivity were equal for an object in thermal equilibrium and figured that covered it. But the arguments I read (pages and pages) talk (vaguely) about physical processes at the surface of the object with individual photons rather than the net amounts of emissivity, absorptivity and energy.
Prev 1242 1243 1244 1245 1246 1247 1248 1249 1250 1251 1252 1253 1254 1255 1256 1257 Next


