


 Arguments


Crux of a Core, Part 3... Dr. Ole Humlum
Posted on 1 April 2011 by Rob Honeycutt
For those of you have read any Greek mythology you probably remember Sisyphus. He was the mortal who challenged Zeus (among many other adventures) and was thus banished for eternity to push an enormous boulder up to the top of a mountain only to have it repeatedly roll down again.
I've taken on a Sisyphean task to locate all the misuses of the GISP2 data from Alley 2000 and put them into proper context. The number of locations I find GISP2 presented as a global proxy on the internet is daunting, but like Sisyphus, I must keep pushing this bolder up the hill.
The Part of Zeus played by...
In this new case I've located Dr. Ole Humlum PhD from The University Courses on Svalbard (UNIS), Norway. He is a professor of physical geography at UNIS.
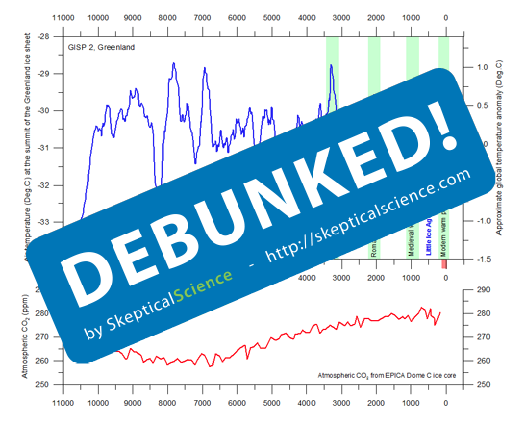
Dr. Humlum runs a website called Climate 4 You where he presents a wide range of data related to paleoclimate. What caught my eye was that Dr. Humlum makes the same mistake that everyone else seems to make. They append the modern instrumental record on the end of the GISP2 data to suggest that current warming is nothing out of the ordinary. But as I've previously pointed out in Crux of a Core Part 1 and Part 2 this is in error. This is comparing one high latitude local proxy (GISP2) with the modern global record.
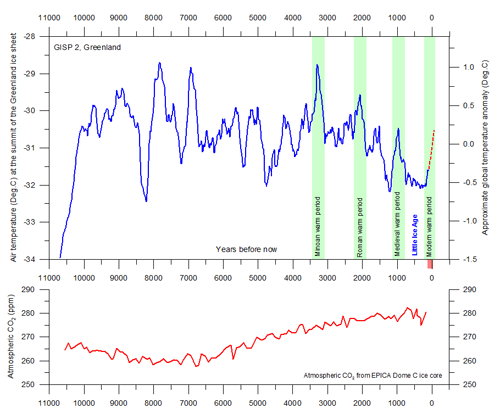
Fig 1 - GISP2 temperature data and EPICA Dome C CO2 data from Climate4you.com
When I located this diagram on his website I wrote a short email to Dr. Humlum pointing out the error of conflating a local record with the global instrumental record and pointed him to Dr. Jason Box's website where Dr. Box shows that the temperature since at the Greenland summit has risen over 2C since the termination of the GISP2 data.
Dr. Humlum kindly responded:
Dear Rob
You are entirely correct; my error. I will change it in a short while.
Thank you very much for pointing this out.
All the best,
Ole
In response Dr. Humlum has, apparently, updated the chart but only to reflect ~1.0C, the lowest estimation contained in Box et al 2009 Greenland Ice Sheet Surface Air Temperature Variability: 1840–2007. With all due respect to Dr. Humlum, I need to put some shoulder behind this boulder and point out that Dr. Box has an additional 3 years of data past 2007 represented on his website that pushes the average temperature change up closer to 2.0C.
The Greenland temperature anomaly for 2010 is 3C above 1855 but the average for the past decade has been 2C above 1855.
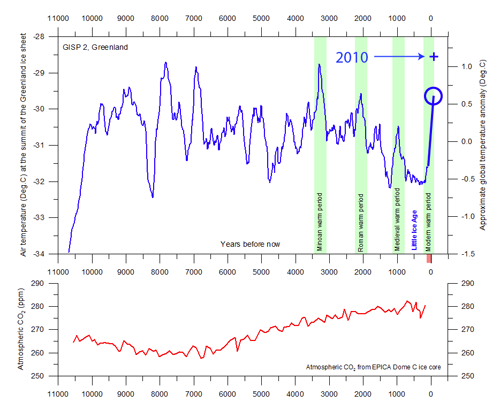
Fig 2 - Climate4you chart updated with current data for the Greenland summit
You can see now that the rise in temperature, comparing local record with local record, shows that there has been a marked increase in temperature at the summit on a scale beyond any other change in the Greenland record except for the known 8.2k year event.
The Mythology Continues
Like any great Greek tragedy the story just keeps going. You'll notice that I've left the EPICA Dome C data in each of these charts, because Dr. Humlum is contrasting the two. Being that CO2 is a well mixed gas in the atmosphere I would suggest that this is also an act of conflating a global record with a local record.
My response is to merely add in the modern record for CO2 concentrations on the EPICA data. Heck, if we're going to add the modern temperature data should we not also be adding the modern CO2 data? It only seems logical.
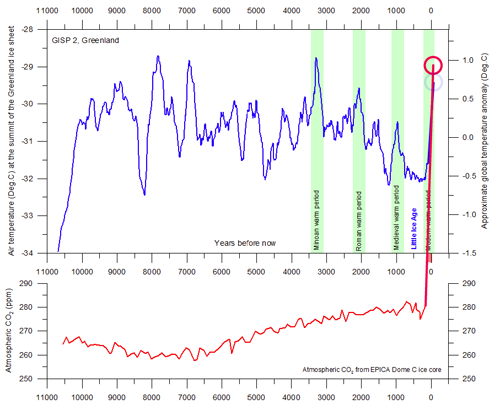
Fig 3 - Climate4you chart with modern CO2 data added
I would venture to guess that the modern record was not added here because, given the scale, it doesn't fit. If we merely rescaled the CO2 data to match the known direct radiative forcing of 1C for a doubling of CO2 (to match the GISP2 chart above it) then the EPICA data through the Holocene would look pretty much like a straight line with a nice little hockey tip at the end.
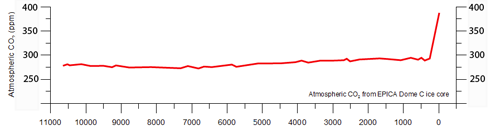
Fig 4 - Adjusted EPICA Dome C data with modern CO2 record appended.
My Hubris...
In the story of Sisyphus he is banished to his task by Zeus for Sisyphus' hubris in his belief that he was more clever than Zeus. Maybe this is my own hubris in taking on each of these presentations of GISP2. In Albert Camus' 1942 essay titled The Myth of Sisyphus he suggests that, actually, Sisyphus is quite happy in his eternal task. Sisyphus, he says, represents the eternal spirit of the human heart.
If you want to know where I am, among other things, you can bet I'm happily browsing the internet looking for another boulder.


 0
0  0
0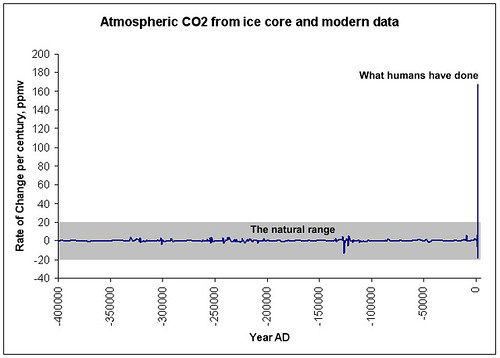
 Humlum comments:
Given the fact that some deniers claim there is a causal connection between the Length of the Day and global temperatures, with changes in the LOD causing changes in global temperatures, it is questionable that there is no discussion of (or mention of) glacial mass balance in the same context.
Looking closely at the LOD signal, it is very plain that there is a seasonal signal. The Earth has a longer day (ie, it spins slower) in the Northern Hemisphere winter. The cause of this is easy to attribute - snow. In the NH winter, large areas of the Earth are covered by a thick blanket of snow. The snow is, in the summer, found in the oceans, but in the winter it is found on land, and hence (on average) at several hundred meters greater altitude. Because of conservation of momentum, this shift of mass slows the Earth's spin, and hence lengthens the day.
The annual trend in changes of the LOD have similar magnitude to the seasonal variations. (The change in the 37 month mean of the LOD from 1972 to 2009 was approximately 0.003 seconds, while the seasonal variation has a range of about 0.0015 seconds.) It is also not a monotonic trend. Therefore whatever the cause, we do not expect the Earth to shed and regain angular momentum, but rather only to shed and regain angular velocity. This means the cause must involve changes in the relative locations of significant masses.
As hinted at above, the larges temperature correlated change in distribution of masses at the Earth's surface is the change in glacial mass balances. As glaciers melt, the melt water finds itself either directly or indirectly in the sea, thus redistributing the mass by up to 10,000 km towards the Earths axis. Because tropical glaciers can be involved in this mass redistribution, the relative size of the effect for a given mass moved should be larger than the seasonal snowfall effect as tropical and subtropical glaciers are further from the Earth's axis of rotation.
Following are the changes in mass balance for non-polar glaciers, and for Greenland. Clearly it would be very difficult to predict the change in the LOD from known changes in glacial mass balance, but it appears to me that the pattern in those changes can be seen as a long term trend driven by loss of mountain glaciers, modulated by the changes in Greenland's mass balance. The changes in Greenland's mass balance are, of course larger than the changes in mountain glaciers in absolute terms, but Greenland is much closer to the axis of rotation.
Humlum comments:
Given the fact that some deniers claim there is a causal connection between the Length of the Day and global temperatures, with changes in the LOD causing changes in global temperatures, it is questionable that there is no discussion of (or mention of) glacial mass balance in the same context.
Looking closely at the LOD signal, it is very plain that there is a seasonal signal. The Earth has a longer day (ie, it spins slower) in the Northern Hemisphere winter. The cause of this is easy to attribute - snow. In the NH winter, large areas of the Earth are covered by a thick blanket of snow. The snow is, in the summer, found in the oceans, but in the winter it is found on land, and hence (on average) at several hundred meters greater altitude. Because of conservation of momentum, this shift of mass slows the Earth's spin, and hence lengthens the day.
The annual trend in changes of the LOD have similar magnitude to the seasonal variations. (The change in the 37 month mean of the LOD from 1972 to 2009 was approximately 0.003 seconds, while the seasonal variation has a range of about 0.0015 seconds.) It is also not a monotonic trend. Therefore whatever the cause, we do not expect the Earth to shed and regain angular momentum, but rather only to shed and regain angular velocity. This means the cause must involve changes in the relative locations of significant masses.
As hinted at above, the larges temperature correlated change in distribution of masses at the Earth's surface is the change in glacial mass balances. As glaciers melt, the melt water finds itself either directly or indirectly in the sea, thus redistributing the mass by up to 10,000 km towards the Earths axis. Because tropical glaciers can be involved in this mass redistribution, the relative size of the effect for a given mass moved should be larger than the seasonal snowfall effect as tropical and subtropical glaciers are further from the Earth's axis of rotation.
Following are the changes in mass balance for non-polar glaciers, and for Greenland. Clearly it would be very difficult to predict the change in the LOD from known changes in glacial mass balance, but it appears to me that the pattern in those changes can be seen as a long term trend driven by loss of mountain glaciers, modulated by the changes in Greenland's mass balance. The changes in Greenland's mass balance are, of course larger than the changes in mountain glaciers in absolute terms, but Greenland is much closer to the axis of rotation.


Comments