Climate Science Glossary

Term Lookup

Enter a term in the search box to find its definition.

Settings

Use the controls in the far right panel to increase or decrease the number of terms automatically displayed (or to completely turn that feature off).

Term Lookup

Settings


All IPCC definitions taken from Climate Change 2007: The Physical Science Basis. Working Group I Contribution to the Fourth Assessment Report of the Intergovernmental Panel on Climate Change, Annex I, Glossary, pp. 941-954. Cambridge University Press.

Home Arguments Software Resources Comments The Consensus Project Translations About Support

Twitter Facebook YouTube Mastodon MeWe

RSS Posts RSS Comments Email Subscribe


Climate's changed before
It's the sun
It's not bad
There is no consensus
It's cooling
Models are unreliable
Temp record is unreliable
Animals and plants can adapt
It hasn't warmed since 1998
Antarctica is gaining ice
View All Arguments...


Username
Password
New? Register here
Forgot your password?

Latest Posts

Archives

Does cold weather disprove global warming?

What the science says...

Select a level... Basic Intermediate

Since the mid 1970s, global temperatures have been warming at around 0.2 degrees Celsius per decade. However, weather imposes its own dramatic ups and downs over the long term trend. We expect to see record cold temperatures even during global warming. Nevertheless over the last decade, daily record high temperatures occurred twice as often as record lows. This tendency towards hotter days is expected to increase as global warming continues into the 21st Century.

Climate Myth...

It's freaking cold!

"Austria is today seeing its earliest snowfall in history with 30 to 40 centimetres already predicted in the mountains. Such dramatic falls in temperatures provide superficial evidence for those who doubt that the world is threatened by climate change." (Mail Online)

Since the mid 1970s, global temperatures have been warming at around 0.2°C per decade. However, weather imposes it's own dramatic ups and downs over the long term trend. So we expect to see record cold temperatures even during global warming. Nevertheless, who hasn't heard someone on a cold day mutter "what happened to global warming?!" It's human nature to remember unusual events: record heat waves and freezing cold spells. Mentally calculating long term statistical trends doesn't come quite as easy as recalling that cold morning a few winters ago or that sweltering heat wave last summer. However, we can learn something about climate trends from those record hot and cold days.

Consider a record daily high to mean that temperatures were warmer on that day than on the same date throughout a weather station's history. As time passes, the number of record high and low temperatures will diminish. This is because as the years roll on and records accumulate, it becomes increasingly difficult to break a record. A new paper (Meehl et al. 2009) examines the record highs and lows since 1950. Figure 1 shows the number of record high temperatures (red dots) and record low temperatures (blue dots). If temperatures weren't warming, we would expect the number of record highs and lows to be roughly equal. Instead, the highs and lows diverge over time with gradually more record highs than lows.
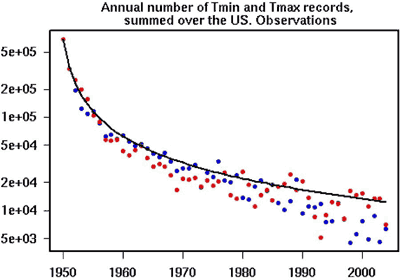

Figure 1: Annual numbers of record high maximum temperatures (red dots) and record low minimum temperatures (blue dots) averaged over the entire US region. Black line is the theoretical values assuming no global warming or cooling.

To examine this further, the ratio of record highs versus record lows were calculated for each year. Figure 2 shows the yearly ratio as black dots. The solid green line is the smoothed trend. During a period of global cooling in the 1960s, there were more record lows than highs. However, when the global warming period began in the 1970s, the ratio of highs to lows began to increase. Over the last decade, daily record high temperatures occurred twice as often as record lows.
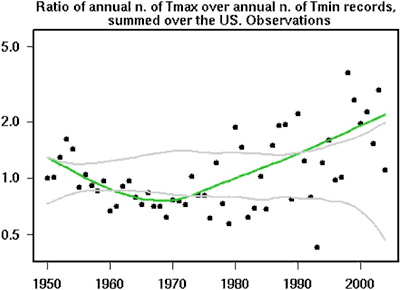

Figure 2: observations of the ratio of record highs to record lows each year (dots), solid line is a smoothed curve fit.

So we see that even during global warming, cold days are expected. However, there's a much greater chance of daily record highs instead of lows. This tendency towards hotter days is expected to increase as global warming continues into the 21st Century.

Intermediate rebuttal written by John Cook

This rebuttal was updated by Judith Matz in September 2021 to replace broken links. The updates are a result of our call for help published in May 2021.

Last updated on 11 July 2015 by MichaelK. View Archives

Printable Version  |  Offline PDF Version  |  Link to this page

Argument Feedback

Please use this form to let us know about suggested updates to this rebuttal.

Further viewing

Climate Denial Crock of the Week - "It's cold. So there's no Climate Change" (January 2009)

ClimateAdam (aka Dr. Adam Levy) has his own way to explaine why this claim is nonsensical:

Further reading

NASA explore this subject in more depth in What's the Difference Between Weather and Climate?

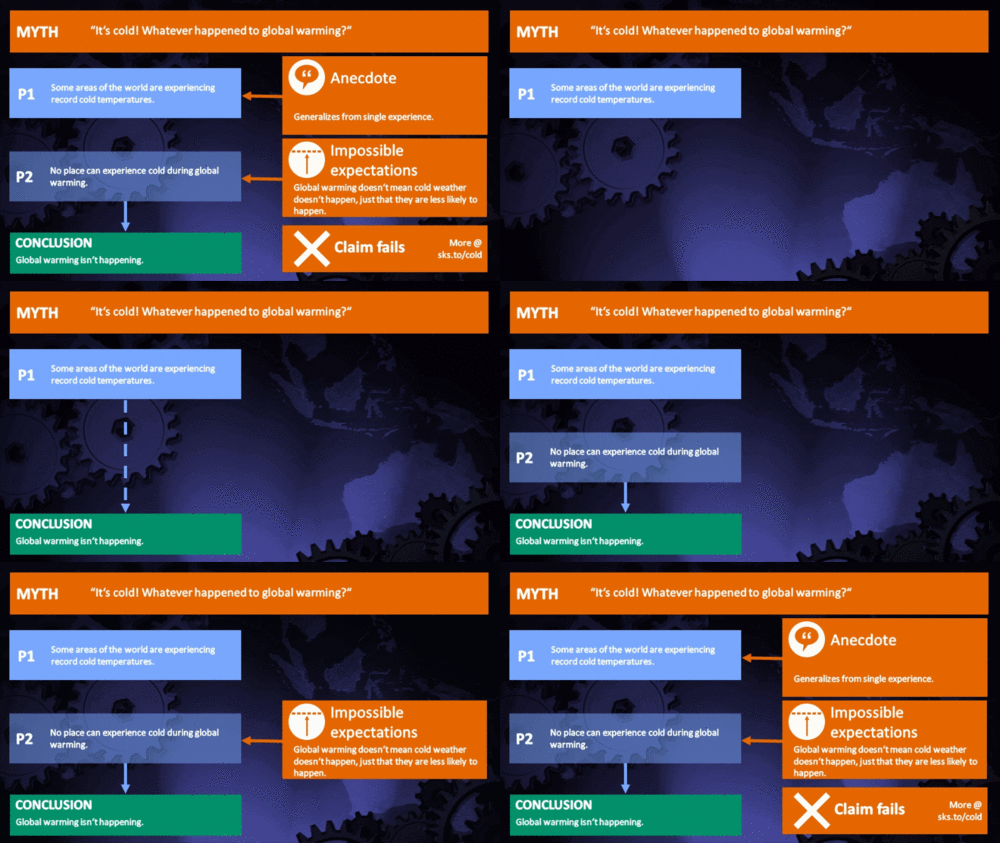
Myth Deconstruction

Related resource: Myth Deconstruction as animated GIF

MD Cold

Please check the related blog post for background information about this graphics resource.

Denial101x videos

Here are related lecture-videos from Denial101x - Making Sense of Climate Science Denial

Comments
1  2  3  4  5  Next

Comments 1 to 25 out of 111:

  1. On this issue, "climate change" is more apt than "global warming". And "climate is weather averaged over time" is more explicit than "weather is not climate." The 'weather' skeptic's defense will be: "They do it too. If there's a warm spell, the believers will say its due to global warming." After years of temperature increases, it is harder for believers to restrain such statements. But they should be restrained. Weather IS variable. In addition, maybe policymakers should just whisper among themselves, about a current event occurring more frequently in a global warming future...to avoid the shortening misquote, that GW caused the event??? WEATHER'S ONE MONTH EFFECT... ...even averaged over a month, local weather anomalies (dynamical fluctuations, more-or-less independent of forced long-term climate change) are much larger than the global mean temperature change of recent decades. Weather fluctuations or 'noise' have a noticeable effect even on monthly-mean global-mean temperature, especially in Northern Hemisphere winter. Weather has little effect on global-mean temperature averaged over several months or more. The primary cause of variations on time scales from a few months to a few years is ocean dynamics, especially the Southern Oscillation (El Nino-La Nina cycle)... Columbia.edu COLD EXTREMES HAVE WARMED MORE... In the last 50 years for the land areas sampled, there has been a significant decrease in the annual occurrence of cold nights and a significant increase in the annual occurrence of warm nights...Decreases in the annual occurrence of cold days and increases in hot days, while widespread, are generally less marked. The distribution of minimum and maximum temperatures have not only shifted to higher values, consistent with overall warming, but the cold extremes have warmed more than the warm extremes over the last 50 years. IPCC AR4 WGI FAQ 3.3 REGIONAL EXCEPTIONALISM FOR GW FUTURE COLD SPELLS..? It is also likely that a warmer future climate would have fewer frost days (i.e., nights where the temperature dips below freezing)...There is likely to be a decline in the frequency of cold air outbreaks (i.e., periods of extreme cold lasting from several days to over a week) in (Northern Hemisphere) winter in most areas. Exceptions could occur in areas with the smallest reductions of extreme cold in western North America, the North Atlantic and southern Europe and Asia due to atmospheric circulation changes. IPCC AR4 WGI FAQ 10.1
  2. RECORD HIGH TEMPERATURES FAR OUTPACE RECORD LOWS ACROSS U.S. ...The ratio of record highs to lows is likely to increase dramatically in coming decades if emissions of greenhouse gases continues to climb... If temperatures were not warming, the number of record daily highs and lows being set each year would be approximately even. Instead, for the period from January 1, 2000, to September 30, 2009, the continental United States set 291,237 record highs and 142,420 record lows... The study also found that the two-to-one ratio across the country as a whole could be attributed more to a comparatively small number of record lows than to a large number of record highs. This indicates that much of the nation's warming is occurring at night, when temperatures are dipping less often to record lows. This finding is consistent with years of climate model research showing that higher overnight lows should be expected with climate change... "One of the messages of the study is that you still get cold days...Winter still comes..." ...analyzed several million daily high and low temperature readings taken over the span of six decades at about 1,800 weather stations across the country....a quality control process at the data center..looks for such potential problems as missing data as well as inconsistent readings caused by changes in thermometers, station locations, or other factors... Meehl et al, ucar.edu Press Release, November 12, 2009
  3. What do you think about Anthony Watts' attempted debunking of the Meehl 2009 report by complaining that it "cherry picked" temp records from 1950 on when 1930 had more record lows than highs? See http://wattsupwiththat.com/2009/11/16/why-ncars-meehl-paper-on-highlow-temperature-records-is-bunk/ It looks to me like Watts is really looking at numbers of record highs and lows and not ratios of highs to lows, but nonetheless it would be nice to see a debunking of the debunking. Overall, it would be even nicer to see a global report on record highs vs record lows to see if the trend Meehl et. al. found in the U.S. is really a global phenomena.
  4. @djb95054 Watts' attempt isn't much of a debunking. Everything he mentions is addressed in the original paper. I mean what do you think is the more robust analysis, a weatherman's report of the records across a few dozen states or the actual record from 2000 stations over decades. See the y-axis above that's 5e+05! 500,000 measurements! Watts' plots show maybe 50 self-reported measurements. The statistical error on that alone is > 10%. Ask Watts to put this in excel and tell us the error on the slope. And he says things like there were 10 lows and 8 highs in 1930s or something like that. Do yourself a favor, read the original paper--you'll find the analysis 5e+05 times more robust.
  5. @rader5 Okay, so the Meehl paper is more robust. I get that. But my question was more about the charge of "cherry picking" data from 1950 on, as opposed to including the 1930's and earlier. Is there a reason the Meehl paper starts in the 1950's?
    Response: The 1950 to 2006 period was chosen because of the decision to use continuous station records. They chose this period to avoid any effect that would be introduced by a mix of shorter and longer records. The final result (the increasing ratio of record high versus record lows) isn't dependent on the start date of 1950.
  6. On the lighter side: Since we had such a cold winter in North America, there was an uptick in the 'all that snow means global warming doesn't exist' hysteria. Bet we won't here much about this: "It’s on the calendar. It’s widely advertised. This year, everybody knows about it but the trees. And they are the central characters in Vermont’s annual maple syrup open house this weekend, when tourists descend on the state to watch trees being tapped and sap being boiled. Sugaring season ended early for many syrup farmers in southern Vermont, sabotaged by unseasonably warm weather." NY Times, 27 March 2010 (http://www.nytimes.com/2010/03/27/us/27syrup.html)
  7. Muoncounter, it's a case of wheels within wheels. Not only are crypto-Communists trying to end our Western lifestyle by confiscating our incandescent lightbulbs, but at the same time the ruthless Canadians are extracting petroleum from tar sands, selling it to us Americans and then tricking us into burning it specifically so more C02 will be released, driving up temperatures, thus pushing the syrup industry north of the Canada-US border. They'll be selling that syrup back to us hungry, desperate pancake eaters later. It's a dastardly plot, one of many.
  8. Redirect from the "new ice age" thread: This is an excellent topic page - and one of the more insidious errors. Our personal experience, and by extension the personal experiences of people we know, tend to have a lot of weight on our judgement. So do more immediate events - what happened last week is more immediate, more forceful in our minds, than what happened a month ago. We also place extreme weight on extraordinary events: a freak snowstorm gets talked about for years, even if the winter in which it occurred was on average pretty mild! So for anyone collecting anecdotes or news stories about extreme weather events - I would strongly recommend looking at the statistics to judge the trends. Individual extreme events tell you very little...
  9. It's unfortunate that the graphs in this post are for the US only. In an attempt to find similar data for the world as a whole, I ran across the website of Maximiliano Herrera, who has compiled data on weather stations that set new high or low records every year since 2002. So far, in 2010 there have been 337 warm records versus 13 cool records. In 2009, the ratio was 80 (warm) to 15 (cool). In 2008, it was 40 (warm) to 18 (cool). In 2007, it was 133 (warm) to 9 (cool). And so on... It would be nice to find a more official or peer-reviewed analysis of this. ------------------------ (Moved from the other thread about impending ice ages, per the moderator's request)
  10. #9: "It would be nice to find a more official or peer-reviewed analysis of this." An interesting review and prediction here, with these words for context: Extreme events, by definition, are on the tail of the probability distribution. Events in the tail of the distribution are the ones that change most in frequency of occurrence as the distribution shifts due to global warming. For example, the "hundred year flood" was once something that you had better be aware of, but it was not very likely soon and you could get reasonably priced insurance. But the probability distribution function does not need to shift very far for the 100-year event to be occurring several times a century, along with a good chance of at least one 500-year event. And a link to Dr. James Hansen - How Warm Was This Summer?
  11. Tom Loeber, instead of pasting loads of links to newspaper/online media articles giving records for anything from one to fifty years, how about links to officially recognised records that are significant, i.e. coldest on record, second coldest, etc. Anything else can be safely ignored. Also, please give a link to an official source that states that England was the "coldest in...140 years". Again, anything else will be a waste of your time. PS It appears you WEREN'T banned, yes ?
  12. I notice that LA international airport reported a record cold temperature recently, so did a number of place in San Diego county. Brazil also recorded an historical record cold. I came across 6 reports all within the last 5 months of record cold in a few countries and that does not go into the first half of this year. I don't readily see that mention of 140 year record cold in England. My mention of it is not that it happened but that I had seen it reported. I think this web site is interesting. Seems the data there is well corroborated. Yes, I was banned. Now, lets see if I still am as I hit the Submit button.
  13. Oops. Here is that site I mentioned "Impacts & Causes of the Unusual Cold, Snowy & Stormy 2009~2010 Winter" http://sites.google.com/site/whythe2009winterissocold/ Well, look at that I am not banned but ask me, if I am not allowed to correct my mistakes and point out data that question assumptions here, does that demonstrate tolerance or open mindedness on the part of this web sites managers?
    Response: You tread dangerous ground here. From the Comments Policy:
    No accusations of deception. Any accusations of deception, fraud, dishonesty or corruption will be deleted. This applies to both sides. Stick to the science. You may criticize a person's methods but not their motives."
    I judge this comment in violation of this, but to allow for you to see this and then have a chance to adjust future comments, will allow it to remain for a while.
  14. Re: Tom Loeber (12, 13) By keeping in mind the Comments Policy when posting (especially the part about posting on the appropriate thread), the vast majority of commenters avoid the Deleted Comments bin. The Yooper
  15. 14: "6 reports all within the last 5 months " Look here, where all entries are accompanied by references. Of the 60 entries for all time high temperatures, there were 27 records set within this decade. Of the 60 entries for all time lows, only 2 record lows were set within the decade. Score: 27-2. How's your open-mindedness doing these days?
  16. I am not denying global warming. I know there are record extreme heat events. That recent spell in Russia was horrible, tens of thousands died. I don't know what is going to happen. Is the tipping point going to be run away global warming? Some 90% of the time for the last million years the earth has been colder than now. The interglacials have been the exception, like minor perturbations. The most stable state appears to be colder than now. I think that finding that melting of the caps immediately preceded glaciation for the last two major swings is interesting. I think I posted it elsewhere, the thread where I think I am still disallowed to post. What is wrong with the Hamaker hypothesis? The noctilucents seem to be a strong indicator that it has merit. Hamaker was apparently unaware of them and yet, their growing in frequency and duration is alarming and greatly supporting John Hamaker's thesis. I think it was Doug who posted a link to a paper purporting to explain how they don't signify any concern of climate change, the one that only used 45 years of their record out of 125 to predict they are basically of no concern. In that paper it also said they have never reached as much extent as when they first appeared. That is totally false. What leads people to give false data, to support the climate change deniers? My understanding is that fossil fuel companies pay millions each year to promote propaganda to keep us from seeking a carbon neutral future. Seen the satellite pictures of the carbon dioxide release we are doing? Who would deny that is not changing the weather, the climate? All in all, I don't know what is going to happen. I do think there is a real possibility that without much warning or set trend, the climate could tip, tip drastically and very possibly to more cold. It appears to be like a higher energy phase state of the planet, triggered by global warming that does not correct itself for perhaps 100,000 years. I don't know. I think any one who says they know what the future holds is not adhering to science. Short term trends do not show tipping, do not show any proclivity for sudden change and yet, such has happened for the planet and they are liable to happen again. I, for one, am concerned enough to have two carbon neutral vehicles, to seek wind and photovoltaics for my electricity production, to farm my own food and live in a place that is recorded as having relatively stable weather right through ice ages. I will leave you to do what you want. I think it borders on being criminal to state you know what is going to happen rather than try to weigh evidence in an attempt to find most likely theories. I wish I were strong enough to get folks off the fossil fuel habit and start respecting this biosphere as our heritage and responsibility but I think we are oh so distracted by the need for money, by the need to make wars to secure the oil and the opium poppies to get more money. We lead a token existence.
    Response: Don't stuff a single comment with multiple topics, when some of those topics are off topic for the particular post at the top of that particular page. We will simply delete the entire comment--even the part that is on topic. You need to pay attention.
  17. Ah, I still can't post in that other thread. I wonder what is wrong with the data on this site that suggests all time record cold was recorded in the following countries during 2010: Cuba, Philippines, Russia, Namibia, Antarctica, Australia, Bolivia from http://www.mherrera.org/temp.htm Maybe I am just interpreting that wrong? I mean, at first, I was thinking I was responding to the claim that record lows didn't happen in countries and then I see the claim appears to have shifted to record lows for within an entire country and not just locations. I just got to leave this alone. I find forums and message boards are not functional in general.
    Response: You are not banned from posting in any threads. You, and everyone else, have your comments deleted when they are off the topic of that particular thread. Most of the threads on this Skeptical Science site are narrowly focused on particular topics. You need to pay attention.
  18. Tom Loeber wrote : "I wonder what is wrong with the data on this site that suggests all time record cold was recorded in the following countries during 2010: Cuba, Philippines, Russia, Namibia, Antarctica, Australia, Bolivia from http://www.mherrera.org/temp.htm" You've virtually answered your own question there ! Those few countries had record lows in one, two or three locations (depending on which country you look at), to give a total of 13 minimum records - none of them all-time records. The rest of the list shown ('Records registered during 2010') are for maximum temperatures (I haven't counted them all but there has to be about 350 of them), and include (unlike the minimums) all-time records. Surely the difference is obvious ?
  19. 17: "I wonder what is wrong with the data on this site that suggests all time record cold was recorded in the following countries during 2010:" Perhaps nothing is wrong with the data, but something is wrong with the approach you've taken. Refer to the key line at the top of this posting: A local cold day has nothing to do with the long-term trend of increasing global temperatures.
  20. Yes, for sure, I see that a vast majority of records are high. I just wonder. The climate is dynamic, not linear. We are changing more than one factor, the concentrations of more than just one greenhouse gas. Should we expect a dynamic system to respond only linearly? If the posts in the URL I just gave are records for locations then why did they miss the all time record low set at Los Angeles International airport this year or the ones in San Diego county or in other countries? In that other thread my messages never post to be deleted. You can see that has led others to cross post here too. If that is not being banned from that thread then I have to seriously consider that this whole endeavor is dysfunctional, it is not working as the moderator suggests.
    Response: Remember that moderation is dynamical, too. Overly-tight moderation constricts the mutual discussion of the science (and provokes questions as to motivations; a no-win scenario). Under-moderation results in chaos. We're human, and as such do the best we can, making allowances for the same by commenters. Keep your comments focused on the post topic and everything should be fine. Also realize that sometimes comments are deleted within seconds of being posted--perhaps before you have a chance to see them. And be sure that after you click the Preview button and verify that your comment appears as you intend, that you then click the Submit button to actually post it.
  21. #20: "Should we expect a dynamic system to respond only linearly?" Who said anything about climate responding linearly? There are multiple inputs (solar variation, GHGs, aerosols, etc) and a complicated output. Hot years, cold years, differential heating from one part of the globe to another: Any understanding of that system requires two things: 1 - we must look at the long term trends, not the daily (or even annual) variation and 2 - we must base our understanding on the work of the scientists who are the experts in these things, not on the vaporings of those who cherry-pick data or see everything through their pre-conceived notions.
  22. I quite agree muoncounter. In considering climate, not just years or tens of years or even thousands of years, we should also consider hundreds of thousands of years as necessary because it shows a repeated oscillation that if not considered could lead to missing cues for worthwhile strategy determination. I find at times experts have been quite mistaken in a major way, a majority of them. I think more important than depending on hear-say and the like, attempt to get a grasp of the data yourself and draw your own conclusions. Always realize we can only hold onto an opinion. Socrates is quoted as having said "True knowledge exists in knowing you know nothing." Thank you for the reasonable comment moderator. I will attempt to post to that other thread again the egregious false claim made in the paper posted on down-playing noctilucents again.
  23. Tom Loeber wrote : "I find at times experts have been quite mistaken in a major way, a majority of them." Do you indeed ? Care to name a few of those times ? Tom Loeber wrote : "I think more important than depending on hear-say and the like, attempt to get a grasp of the data yourself and draw your own conclusions. Quite right, partly, I think. Don't rely on hear-say, definitely (and that includes media reports, etc.) - rather, rely on the experts, the expert studies and the science. Draw your own conclusions if you wish (and there are many so-called skeptics on here who certainly do !), but don't think that your conclusions are as valid as anyone elses, especially if your conclusions go against the conclusions of the science.
  24. Tom Loeber, so some people made daft comments in the past (going back to Columbus's day), therefore you don't trust anyone ? How do you trust even your own conclusions ?
  25. Tom Loeber at 07:22 AM, what I think it actually comes down to is a persons ability or otherwise to think laterally. Many of the examples in your links are of people demonstrating inability to think laterally. Whilst most people like to think that they are lateral thinkers, unfortunately the education process most people pass through tends to reinforce the logical thinking processes, some institutions I have observed even actually discourage lateral thinking. At lot depends on the staff at the institution, there are only so many "inspirational" educators around, many are the tried and proven "sloggers" that follow the logical processes that teaching by the book demands. The climate change debate is an excellent example where the reliance on peer reviewed papers and the necessity for all processes to be reduced to an equation to explain the physics involved leaves little room for lateral thinkers, especially amongst those who are students of the subject.

1  2  3  4  5  Next

Post a Comment

Political, off-topic or ad hominem comments will be deleted. Comments Policy...

You need to be logged in to post a comment. Login via the left margin or if you're new, register here.

Link to this page


The Consensus Project Website

THE ESCALATOR

(free to republish)


© Copyright 2024 John Cook
Home | Translations | About Us | Privacy | Contact Us