


![]() The figure below from the 2013 Intergovernmental Panel on Climate Change (IPCC) report compares the global surface warming projections made in the 1990, 1995, 2001, and 2007 IPCC reports to the temperature measurements.
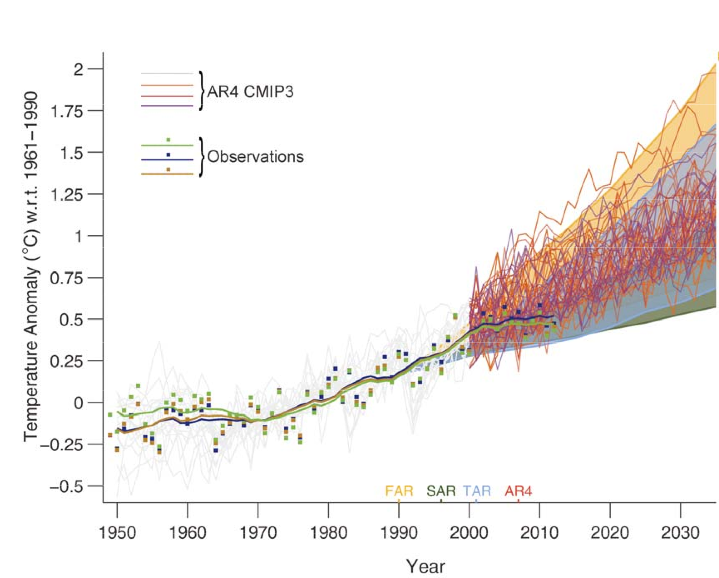
The figure below from the 2013 Intergovernmental Panel on Climate Change (IPCC) report compares the global surface warming projections made in the 1990, 1995, 2001, and 2007 IPCC reports to the temperature measurements.
Enter a term in the search box to find its definition.
Use the controls in the far right panel to increase or decrease the number of terms automatically displayed (or to completely turn that feature off).
|
|
||||
Home
 Arguments
Software
Resources
Comments
The Consensus Project
Translations
About
Support Arguments
Software
Resources
Comments
The Consensus Project
Translations
About
Support
|
||||
|


Latest Posts
|
IPCC model global warming projections have done much better than you thinkPosted on 1 October 2013 by dana1981
IPCC AR5 Figure 1.4. Solid lines and squares represent measured average global surface temperature changes by NASA (blue), NOAA (yellow), and the UK Hadley Centre (green). The colored shading shows the projected range of surface warming in the IPCC First Assessment Report (FAR; yellow), Second (SAR; green), Third (TAR; blue), and Fourth (AR4; red).
Since 1990, global surface temperatures have warmed at a rate of about 0.15°C per decade, within the range of model projections of about 0.10 to 0.35°C per decade. As the IPCC notes,
What about the Naysayers?In the weeks and months leading up to the publication of the final 2013 IPCC report, there has been a flood of opinion articles in blogs and the mainstream media claiming that the models used by the IPCC have dramatically over-predicted global warming and thus are a failure. This narrative clearly conflicts with the IPCC model-data comparison figure shown above, so what's going on? These mistaken climate contrarian articles have all suffered from some combination of the following errors. 1) Publicizing the flawed draft IPCC model-data comparison figureLate last year, an early draft of the IPCC report was leaked, including the first draft version of the figure shown above. The first version of the graph had some flaws, including a significant one immediately noted by statistician and climate blogger Tamino.
In the draft version of the IPCC figure, it was simply a visual illusion that the surface temperature data appeared to be warming less slowly than the model projections, even though the measured temperature trend fell within the range of model simulations. Obviously this mistake was subsequently corrected. This illustrates why it's a bad idea to publicize material in draft form, which by definition is a work in progress. That didn't stop Fox News, Ross McKitrick in the Financial Post, Roger Pielke Jr., the Heartland Institute, and Anthony Wattsfrom declaring premature and unwarranted victory on behalf of climate contrarians based on the faulty draft figure.2) Ignoring the range of model simulationsA single model run simulates just one possible future climate outcome. In reality, there are an infinite number of possible outcomes, depending on how various factors like greenhouse gas emissions and natural climate variability change. This is why climate modelers don't make predictions; they make projections, which say in scenario 'x', the climate will change in 'y' fashion. The shaded regions in the IPCC figure represent the range of outcomes from all of these individual climate model simulations. The IPCC also illustrates the "multi-model mean," which averages together all of the individual model simulation runs. This average makes for an easy comparison with the observational data; however, there's no reason to believe the climate will follow that average path, especially in the short-term. If natural factors act to amplify human-caused global surface warming, as they did in the 1990s, the climate is likely to warm faster than the model average in the short-term. If natural factors act to dampen global surface warming, as they have in the 2000s, the climate is likely to warm more slowly than the model average. When many model simulations are averaged together, the random natural variability in the individual model runs cancel out, and the steady human-caused global warming trend remains left over. But in reality the climate behaves like a single model simulation run, not like the average of all model runs. This is why it's important to retain the shaded range of individual model runs, unlike Bjorn Lomborg in The Australian, Judith Curry in The Australian, Benny Peiser at GWPF, Roger Pielke Jr., David Rose in the Mail on Sunday (copied by Hayley Dixon in The Telegraph), and Der Spiegel, all of whom only considered the model average. This group all made an additional related third error as well. 3) Cherry PickingMost claims that the IPCC models have failed are based on surface temperature changes over the past 15 years (1998–2012). During that period, temperatures have risen about 50 percent more slowly than the multi-model average, but have remained within the range of individual model simulation runs. However, 1998 represented an abnormally hot year at the Earth's surface due to one of the strongest El Niño events of the 20th century. Thus it represents a poor choice of a starting date to analyze the surface warming trend (selectively choosing convenient start and/or end points is also known as 'cherry picking'). For example, we can select a different 15-year period, 1992–2006, and find a surface warming trend nearly 50 percent faster than the multi-model average, as statistician Tamino helpfully illustrates in the figure below. 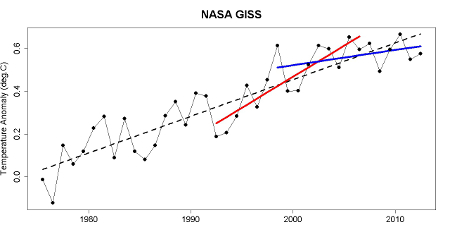 Global surface temperature data 1975–2012 from NASA with a linear trend (black), with trends for 1992–2006 (red) and 1998–2012 (blue).
In short, if David Rose wasn't declaring that global surface warming was accelerating out of control in 2006, then he has no business declaring that global surface warming has 'paused' in 2013. Both statements are equally wrong, based on cherry picking noisy short-term data. IPCC models have been accurateFor 1992–2006, the natural variability of the climate amplified human-caused global surface warming, while it dampened the surface warming for 1997–2012. Over the full period, the overall warming rate has remained within the range of IPCC model projections, as the 2013 IPCC report notes.
The IPCC also notes that climate models have accurately simulated trends in extreme cold and heat, large-scale precipitation pattern changes, and ocean heat content (where most global warming goes). Models also now better simulate the Arctic sea ice decline, which they had previously dramatically underestimated. All in all, the IPCC models do an impressive job accurately representing and projecting changes in the global climate, contrary to contrarian claims. In fact, the IPCC global surface warming projections have performed much better than predictions made by climate contrarians. It's important to remember that weather predictions and climate predictions are very different. It's harder to predict the weather further into the future. With climate predictions, it's short-term variability (like unpredictable ocean cycles) that makes predictions difficult. They actually do better predicting climate changes several decades into the future, during which time the short-term fluctuations average out. That's why climate models have a hard time predicting changes over 10–15 years, but do very well with predictions several decades into the future, as the IPCC illustrates. This is good news, because with climate change, it's these long-term changes we're worried about: 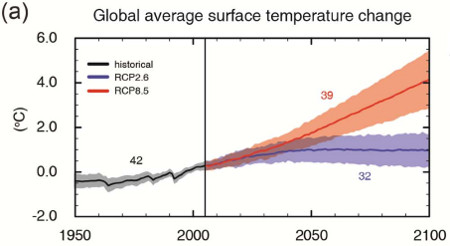 IPCC AR5 projected global average surface temperature changes in a high emissions scenario (RCP8.5; red) and low emissions scenario (RCP2.6; blue).
Note: this post has been incorporated to the rebuttal to the myth IPCC global warming projections were wrong and added to the SkS debunkings of the most popular myths about the IPCC (short URL http://sks.to/ipcc)
|
|


THE ESCALATOR |
|
| © Copyright 2026 John Cook | ||||
| Home | Translations | About Us | Privacy | Contact Us | ||||


I've also been seeing a little bit of a #4) Curve fitting exercises purporting to have better predictive power than IPCC model forecasts based solely on short-term hindcasts with arbitrary parameters. Not many stoop that low to make the IPCC's models look bad, but some do.
Excellent article Dana. It seems so many people fall into the trap of thinking that the temperatures should doggedly trail the inexorable rise of the multi-model mean, failing to realise that every individual model run rises and falls around that line.
I can't see if you link to it above (very probably you do), but for readers I might highlight Foster and Rahmstorf 2011 which elegantly showed what happens when you remove exogenous factors - you end up with the underlying warming signal, still continuing unabated through the past decade. The Kosaka paper you discussed recently shows how including some of that variability leads to an excellent modelling of surface temperatures including the recent surface temp 'slowdown'. And yet deniers still claim the change in surface temperatures is unexpected or represents a model 'failure'...
Keep up the superb work!
Dana, you should really take a look at this.
http://climateaudit.org/2013/09/30/ipcc-disappears-the-discrepancy/
Bottom line however, the models have not done an adequate job, which even the IPCC admits:
Being on the high side 114 out of 117 times is indicative of a bias.
[DB] It is customary to provide a link to the source when quoting.
franklefkin @4, of course it shows a bias. It shows a massive bias that results from a carefully selected start point for observations at one of the largest El Nino's on record. You fail to show that their is any additional bias beyond that in the cherry picked start point, something you need to do before concluding that the models show a bias.
@fretslider: Your comment was deleted because it is sloganneing. Please read the SkS Comment Policy and adhere it.
fretslider - Astounding. You make claims of data distortion by linking to a figure that has in fact been airbrushed and reworked to remove critical data.
Even with the incorrect 1990 baselining, the draft figure 1.4 (seen here) includes a light grey region that shows the range of model variations and the uncertainties in temperature measurements, the expected range around model means due to natural variation. Observations are well within those bounds. McIntyre's reworked figure that you point to above lacks the range of model variations, showing only the range of model ensemble means - see denial tactic #2 in the opening post.
That reworked McIntyre figure (along with other 'skeptics' like Patrick Michaels in Forbes, who edited the figure captioning and falsely claimed: "The very large grey zone is irrelevant to the forecasts that were made") is a clear distortion. I would go so far as to say it is a demonstrable lie about the science on McIntyre's part. Don't be fooled.
I'm seeing a lot of contrarians using the old Spencer/Christy "hunt for the fugitive TMT hot spot" cherry-picked graph comparing 20N to 20S latitude band satellite/balloon readings to the Coupled Model Intercomparison Project (CMIP5) ensemble. This is then implied to challenge the global extents of the models... as stated in the following article:
http://opinion.financialpost.com/2013/09/27/nota-bene-climate-models-vs-actual-climate/
Spencer's original is at his site:
http://www.drroyspencer.com/wp-content/uploads/CMIP5-73-models-vs-obs-20N-20S-MT-5-yr-means1.png
Of course all this conveniently does away with the amplified warming at higher latitudes which all global models must account for. I was initially skeptical about the integrity Spencer's original since it indicates the (dotted line) Mean calculation "Mean USA" which I'd assumed meant data that had nothing to do with equatorial latitudes, but I guess having looked at another citation at Watts' site that was supposed to indicate "US based research". Still, a nasty cherry pick considering how it is being used for exaggerated claims of "none of the models work".
I recognize the TMT hot spot as something of a red herring, as it really seems to be more of a potentially amplified heat capacity at altitude, than uniformly warmed atmospheric layer. It's not the subject of this thread per se, but certain bloggers etc. do seem to be milking this hunt-for the-nonexistent-'signature' for all its worth (which is not a lot) and more.
Thanks for presenting more accurate information here. I'd like to see the missattribution of Spencer's work in the contrarian media, better shown up for what it is.
Bob @3 - McIntyre adds nothing of value whatsoever. His post is basically "I don't understand why the data shifted up." Ever heard of proper baselining? Just goes to show that Tamino is 10 times the statistician McIntyre is, as Tamino figured this out 10 months ago. Also, if you're confused about the proper baselining, then compare the trends! It's easy for a graph to be visually misleading, but the trends don't lie. I literally see nothing of value in McIntyre's post.
franklefkin @4 - as I noted, the fact that climate models don't accurately predict ocean cycles in the short-term is not particularly relevant. We're not especially concerned about climate change in 2020, we're concerned about climate change in 2050 and beyond.
Andrew @8 - I addressed the Christy/Spencer TMT graph here (see Stage 2).
Tom C & Dana1981,
So, right now surface temps are lower than predicted a few years ago. So if we compare in another 15 years, predictions from say 2003, you are saying that those predictions should be lowered because actual temps are lower now. <-snip-> The predictions are what they are. Consider what was said in the AR4:
"
Since IPCC’s fi rst report in 1990, assessed projections
have suggested global average temperature increases
between about 0.15°C and 0.3°C per decade for 1990 to
2005. This can now be compared with observed values
of about 0.2°C per decade, strengthening confi dence in
near-term projections. {1.2, 3.2}
"
(from AR4 SPM pg 12)
In the Article above, DANA1981 quotes a fiqure of
The AR4 report clearly states that the lower end is 0.15 per decade. Regardless of where the baseline occurs, observations are at the very lower limit of predictions.
The report goes on to state "
(also from pg 12)
So unless natural variability has suddenly spiked, natural variability cannot be the reason for the models' over estimate of warming.
[RH] Dial it down just a little.
franklefkin, we can play with short-term trends all day long. What's the trend for 1974-2008? 0.192C per decade, just about where it's expected. The trend from 2008 to present is flat. So what? There are at least three similar periods between 1974 and 2008. Didn't matter much for the overall trend, did it?
It seems like you're digging for approval for a specific message rather than trying to get a better understanding of the science. A period of flatness in the surface trend means what, exactly? Global warming has stopped? Not in the slightest. Global energy storage continues as projected.
So what message are you fishing for? General circulation models suck at projecting short-term GMST trends? Duh. General circulation models suck at projecting long-term GMST trend? Show me. Given everywhere the long-term trend could have reasonably gone (setting aside physics), CMIP3/5 modeling has done a remarkable job of confirming the strength of human-induced warming.
What do you think will happen when the next El Nino pops? We just had the warmest ENSO-neutral June on record. August was close. September, if the dailies are any indication, is going to set a record for ENSO-netural conditions. Ocean heat content has put the pedal to the metal in the last six months. PDO is also negative and has been since 2008. Solar, despite climbing toward the cycle peak, is also weak and has been for the last six years.
Yah, natural variation is putting a damper on things. No reason to rejoice, though. And certainly no basis for claiming that "global warming has stopped" or even paused. Surface warming has been weak since 2008.
What I keep asking people who castigate the models is if they're expecting surface temps to follow the model mean. If so, then they're missing something very fundamental about climate modeling.
Models are never going to be able to predict short term surface temperature trends. That's just a fact. You have to get it into your head that climate modeling is a "boundary conditions problem." It's not about predicting the short term trend. Climate modeling is about estimating the boundaries we expect surface temps to fall for given forcing scenarios.
DSL,
The article is titled "
IPCC model global warming projections have done much better than you think
"
The message is, no they haven't done better than I think!
As expected the fake skeptics are now trying to undermine the models by suggesting that they are a cornerstone of climate science (they recycle this myth frequently). Climate science and theoretical models of how much warming will result from a doubling of CO2 (an arbitrary value, because we will far exceed a doubling of CO2 if fake skeptics get their way) have existed long before the first comuter climate models.
The obvious caveat is, of course, that no model is perfect. Yet models are valuable tools for not only objectively quantifying future climate states, but also for learning more about the workings of our climate system.
The figure below is from the fifth assessment (AR5) report (Fig. TS.9a). As a similar figure above shown by Dana (also from AR5) the models so an uncanny job of simulating the variability of the climate system, but only when one includes anthropogenic forcings in addition to natural forcings.
The other mistake that fake skeptics make is that they insist on comparing temperature trends (or sea-ice trends or ocean heat content trends) over periods of time that are way too short to have any statistical significance or meaning. They do this in a desperate attempt to undermine the models' credibility. However, it is well established that one of the areas that climate models are not good at is replicating the marked interannual variability because of ENSO, aerosols etc, or short-term variability (~<10 years). So they are making a straw man argument.
To illustrate, the Figure below (Box TS.3, Fig.1 from AR5) shows that between 1984 and 1998 the models as a whole were running to cool. In contrast, between 1998 and 2012 the models as a whole have been running too warm. But when one considers a longer period of time (say 1951 though 2012) or even 1979 through 2012 (as one should do), the models do a remarkably good job when compared with observations. The goal here is the long term outlook on a centennial scale.
That clearly indicates that the models are much better than fake skeptics would try and trick people into believeing.
Franklefkin @14,
Don't believe everything that you think.
Memo to deniers:
Your attempts to argue that the accuracy of GCMs undermines the entire body of scientific evidence about climate change is a "Dog that won't hunt!"
Franklefkin: "The message is, no they haven't done better than I think!"
Frank, is observed GMST still within the 95% confidence range of the CMIP3 ensemble? Yes or no?
DSL,
Its a 90% confidence range, and it depends on the data source for the observations.
separate question, CMIP3or5?
franklefkin - I would suggest you look at the draft report itself, where Figure 1.4 is clearly labeled:
Frank, I'll re-post the link I included in the last post: link (hint: click on it). CMIP3, GISS (better coverage), 95%.
"This is why climate modelers don't make predictions; they make projections, which say in scenario 'x', the climate will change in 'y' fashion."
Wait what? It doesn't matter what you call it, predictions or projections. The fact is that scientific models are supposed to accurately predict natural phenomenon: as you stated given x, the outcome will be y. Besides, if a model doesn't make predictions then it's not scientific because it's not falsifiable.
Engineer, you are missing the point "IF X, then Y", notice the "IF". That is the difference between a prediction and a projection, the accuracy of the Y is contingent on the accuracy of the scenario X. Please dial the tone back a bit and try to see the value in the contents of the posts to which you are replying, rather than merely trying to refute them. Projections fit Poppers prescription for what is and what isn't science perfectly well (please let's not get into a discussion of philosophy of science, we have all been there done that, and oddly enough the scientists that make the projections are quite familiar with it).
Engineer, a prediction is understood to be a single best estimate. Climate models don't produce single predictions. You can average all model runs and get the ensemble mean, but the line will not be representative of the science. The variables involved have high-likelihood ranges based on existing research. The result is a projected outcome range, not a single line of prediction. A single line of prediction would be absurd given the complexity of the system.
Engineer -- The models of probability allow us to accurately calculate the chances of a blackjack player winning given a certain dealt hand and dealer card showing, given a particular playing strategy. Averaged over many random hands, this gives the long-run payoff of that strategy, as well as upper and lower bounds on what the player can expect to experience over a given number of hands. However, the models cannot predict WHICH cards will be dealt nor whether the player will win any given hand. Does that mean that the models are wrong or inaccurate, or unfalsifiable? No! It's just that shuffling the deck produces randomness that no model can possibly predict, and predicting what specific cards will be dealt is not the purpose of the model in the first place. Players that employ strategies that such models identify as having the highest payoff will, in the long run, do better than players using other strategies, even though they may will experience runs of losses and other players may will experience runs of wins.
A chaotic natural oscillation such as ENSO acts like a shuffling mechanism, preventing short-term prediction of particular years' conditions (without advance knowledge of ENSO behavior, volcanic eruptions, etc.), but allowing projections about the long-term trend as well as conditional predictions (e.g., if 2014 has a strong El Nino influence, mean surface temp is predicted to be higher than otherwise, given no volcanic eruption). The truly impressive accuracy of recent model hindcasts that are constrained to reproduce past ENSO behavior (which are analogous to predicting the winner of blackjack hands after you know the dealt and showing cards) point to the conditional accuracy of the models and lend confidence to their skill, despite their inability to predict short term randomness.
DSL @21,
The link you have is to a REAL Climate graph that shows 95% of model runs. It is not a 5 - 95% confidence graph. There is a difference.
"Please dial the tone back a bit and try to see the value in the contents of the posts to which you are replying, rather than merely trying to refute them."
I think I'm being misunderstood. My comment was just directed at the statement, "This is why climate modelers don't make predictions; they make projections, which say in scenario 'x', the climate will change in 'y' fashion." I was commenting on a statement that looked like it was arguing differences in the definition of words as a way to gloss over inaccuracies in a model's predictions. I don't want to get into a philosophical discussion, but if a model disagrees with nature then there is something wrong with the model. And that applies to any model.
franklefkin --
@19: Who specified that it had to be 90%?
@26: I think there may some confusion in terminology here. The range containing 95% of model realizations (from the 2.5th percentile to the 97.5th percentile, not -- as you might be thinking -- from the 0th to 95th percentile) corresponds to what is properly called a 95% prediction interval, not a confidence interval. Confidence intervals reflect uncertainty in estimated parameters (e.g., population mean), whereas prediction intervals denote uncertainty in individual observations (e.g., a single sample from the population). Since the behavior of the Earth system only happens once in reality, it should be compared with a model's (or group of related models) prediction interval.
The big difference is that a confidence interval always shrinks with more higher sample sizes (e.g., the estimate of the mean becomes less uncertain), but the prediction interval does not (although the interval boundaries do become more precise with higher sample sizes). Running more model runs will tighten up the confidence interval around the ensemble mean, but will not generally tighten up the prediction interval.
If intervals are based on decent sample sizes, a very large fraction of observations will fall outside the confidence interval (for the mean) but within the prediction interval (for observations).
engineer --
"if a model disagrees with nature then there is something wrong with the model."
Let's say I have a model that simulates the outcome of process of drawing cards from a shuffled deck. I run the model once, and it generates a 3 of diamonds. I have an actual shuffled deck, and draw a 10 of clubs. The model and reality disagree. Is that sufficient information to conclude that something is wrong with the model?
Mammal_E, I think it would be great for you to write a post expanding your explanation of prediction interval versus confidence interval, if it includes some graphs.
I agree with Tom. Mammal_E, you're providing great insight into what are pretty common misinterpretations of what climate modeling is about.
Also, if I'm interpreting your comments correctly, you're saying what I was saying (albeit more precisely than me) about climate modeling being a boundary conditions problem. I'm equating boundary conditions to your statements about prediction intervals.
@Rob Honeycutt -- you interpret my comments correctly. I'll see if I can gin up something that is brief and clear. I see this issue a lot with people misinterpreting population simulations, e.g., projecting the fate of endangered species.
@ Mammal_E
You're dealing with probability which is dependent on the sample size and a sample size of 1 is insufficient. However, if your math dictates that you should get a 10 of clubs 5% of the time but you do the experiment and draw 10 of clubs 20 times in a row off the bat, a probability that amounts to 0.05^20 = 9 * 10^-25 %...then it's probably time to revisit your model. But the key here is that the model is still ultimately judged by nature, which is how it's supposed to be.
It seems you disagree with my statement "if a model disagrees with nature then there is something wrong with the model." Let me ask you this, if a particle is discovered that can travel faster than the speed of light, is Relativity Theory wrong?
Anyone played contract bridge?
So as declarer, I look at my hand and dummy and see that whether we make the contract or not depends on a finess, which depends on the card split in the opponent's hands. And on the basis of the statistics of the split I calculate that I've got an 80% chance of making the contract.
We play it out, and go down on a bad split. Was my calculation wrong? No, it was exactly right. I just got the 20% split. If we were to play the hand 100 times with all the known cards in the same places and the rest distributed randomly, we'd make the contract around 80 times.
Someone else will have to reframe that for poker or blackjack players.
So, climate.
Thought experiment: Imagine a system with a linear component which is varying slowly, and a large chaotic signal overlayed on the top. We can model the physics of the system. But when we run the real system the result we get will contain the linear component, plus a random realisation of the chaos. If we run the real system many times, we can average out the chaotic component and just see the linear part. But if we can only run the system once, we're stuck with that one run.
Suppose we have a perfect model. We run it once, and it also produces the linear response with the chaotic signal on top. We can run it lots of times and average, and we'll see just the linear signal. But that doesn't look like the real run, because the real run has the chaotic part too.
But neither do any of the individual runs of the perfect model look like the real run, because the chaotic component is different.
So even with a perfect model, we can't reproduce the real run either with an individual model run or with an ensemble of model runs. And yet that's with a perfect model, a model which is right.
That's exactly the problem we're facing here. Because weather (or more generally the internal variability) is chaotic.
Nature Climate Change recently published a paper entitled ‘Overestimated global warming over the past 20 years’ by Fyfe, Gillett and Zwiers. The paper compares CMIP5 results with observations and the general conclusion is pretty much summed up in the title. Could SkS please comment on these findings in relation to the discussion here.
I suspect this paper will be used to challenge the utility of climate models in general.
engineer @34... If the surface temps fall off the model mean, that does not suggest the models have a problem. That's what everyone here is trying to convey. What is expected is that surface temps will continue in the general direction of the mean but stay within the bounds of the model runs.
If surface temps started to track outside of the range of the model runs, then that would be an indication something was not being accounted for. But the whole point of the article here is, this is not what's happening. Surface temps are well within the bounds of where the models project they will be.
Everyone,
Please, comments such as
"Let me ask you this, if a particle is discovered that can travel faster than the speed of light, is Relativity Theory wrong?"
are really not helpful. Debating "what ifs" does not address the subject at hand. If one wishes to play that game, then one should also entertain the distinct possibility that temperatures could rise a lot more than theory suggests.
The contrarians here have had the fact that the tempeature observations lie within the uncertainty bounds of the simulations explained to them several times now. Several figures showing the agreement between the models given the bounds of uncertainty have been offered. It has been explained to that no model is perfect-- yet that they insist on using trying to using this to make a straw man argument. Funny too how for contrarians the uncertainty is always biased to the low side.
This sort of behaviour is all too typical of contrarians. No amount of data, facts or explaining will change their "opinion", their "feeling" or their "belief".
While we fiddle, the energy imbalance arising because higher CO2 levels (from human activities) is adding the energy equivalent of four Hiroshima A-bombs a second to the planet's climate system.
Hi Mel @36,
We at SkS are aware of the paper by Fyfe et al.. If you look at their figures and TS.3 Fig. 1 from AR5 that posted above, you will see that the AR5 figure was probably generated by one of the authors of Fyfe et al..
These short-term descrepancies are of little or no consequence for policy makers-- they are concerned with the long-term projections (which have thus far been very accurate). Importantly, Fyfe et al. also acknowledge that in the long-term the models have been almost spot on in predicting the amount of warming (see their Fig. 2).
Studies such as the one by Fyfe et al. are of academic interest and for improving our understanding about the climate system's (and models') intricacies. Fyfe et al. looked at the 1993 through 2012 interval when the models were running cooler than the observations. Here is a science brief on Fyfe et al. that is easier to digest.
Ask yourself this Mel, why are the contrarians making all the fuss about the 1993-2012 window, but are completely silent about the 1984-1998 window when the models were running too cool?
I suspect that you know the answer, it has to do with confirmation bias and fake skepticism.
engineer,
Some contrarians have implied that a single result at odds with a model falsifies the model, which is obviously wrong - like blaming a card-strategy program for not picking a single deal correctly. Your statements are more sophisticated and imply that the situation is instead one of repeated bias, predicting the 10 of clubs 5% of the time but instead getting it 20 times in a row. This card analogy breaks down, though, because there have not been 20 independent runs of the real-world climate. There have not been 117 runs either.
If the climate models made predictions about 117 independent runs of the real-world climate, and temperature estimates were high 114 times, then yes, the models would be wrong. That is not what has happened, though. We have had a single real-world "deal", which has produced surface temperatures within the predicted range. You can observe that process 117 times, or 117000 times, and it does not mean that the model has been falsified unless you choose time points that are truly independent. It is like watching a single bridge hand being played out, noting the progress of the hand 117 times, then saying the card-strategy being played was wrong because it had been tested 117 times and found wanting.
Not only that, as soon as we start to consider the factors that account for the variability (volcanoes, el ninos, etc), we see that the models are basically accurate, and the variables that were part of the unpredictable "shuffle-and-deal" are affecting global surface temperature in agreement with the models.
The ensemble mean does not represent any single model run very well - a fact well known to the modelers, but easily misunderstood by those predisposed to misunderstand. Personally, I think it would be useful if the models gave predicted intervals for "el nino years", "la nina years", and so on. Then we would see that, for the actual "cards dealt", the models have performed well.
@Rob, "What is expected is that surface temps will continue in the general direction of the mean but stay within the bounds of the model runs." I completely agree.
My point of contention was this statement: "This is why climate modelers don't make predictions; they make projections, which say in scenario 'x', the climate will change in 'y' fashion.", which in my opinion (-sloganeering snipped-).
[DB] Your opinion has been voiced before, and addressed by multiple parties. To then repeat said opinion without the added value of new information based in the science is pointless sloganeering. Such sloganeering is a waste of everyone's time here, which is why the practice is listed as banned by this site's Comments Policy.
[JH] Plus, it's a violation of the prohibition against excessive repetition.
Engineer @41... But this is exactly the same thing as what Dana is stating, just using different words.
"Prediction" would be saying stating what the temps will do, which seems to be the view most "skeptics" seem to take toward models. Modelers don't do that. They, 1) make a variety of "projections" based on different emissions scenarios, and 2) the projections say that surface temps will likely run in the bounds of the model runs.
None of that suggests anything about the falsifiability of the projections.
I think it would also be helpful to say climate models say IF you get this forcing, THEN you get this result. They do not however predict what the forcings will be.
Climate models also make no pretense at having any skill at decadal-level surface temperature trends, only on climate trends where most certainly the models can be tested.
@Rob, ok, I think understand what you're saying, but why is this distinction between prediction and projection even necessary? the terms are interchangable. Adding a distinction seems like adding confusion for no reason.. "This is why climate modelers don't make predictions; they make projections, which say in scenario 'x', the climate will change in 'y' fashion." when I read it the first time it seemed like a dodge to the standard of falsifiability. Apparently, I'm the only one that thought that.
engineer: "the terms are interchangable"
No, they are not. If you have a model that states a + b = 12, a projection is saying "if a = 4, then my model says b = 8". An observation that b=14 is not a falsification of the model, if a<>4. A prediction would be to say that a will = 4, and b will = 8.
A series of projections might cover a range of values of a, stating what the model says b will be for each value of a. In modeling terms, this is call a sensitivity analysis - seeing how a change in an input parameter affects an output value, or how sensitive b is to changes in a. If you want to talk about the probability distribution function of output values (e.g., there is a 95% chance of an outcome in range X), then you also need to look at the probability distribution of the input parameters. You can't just take N runs of unknown input distribution and assume that it fits your expectations. At least, not if you are doing good science.
There is a discussion of statistical language at the Australian Bureau of Statistics web site which compares the terms projection and forecast. This may help Engineer get over his apparent belief that the distinction was invented by climate modellers.
"A projection is not making a prediction or forecast about what is going to happen, it is indicating what would happen if the assumptions which underpin the projection actually occur."
In fact, mousing over the underlined word "projection" anywhere on this page brings up a cogent explanation in the upper right of the screen.
I stand corrected. Thanks Mammal_E, and I agree that a post would be a nice thing, though the comment is surely at least halfway there.
On the chart above titled "Global Average Surface Temperature Change" there isn't a clear distinction between RCP8.5 and RCP2.6 until around 2060, which means we could still be arguing for about 45 more years whether the climate is changing per a low emissions or a high emissions scenario, based on model projections. So it seems to me that arguing about exactly how accurate the models are shouldn't be the point to get caught up on.
engineer wrote "I think I'm being misunderstood.". The reason that I suggested that you dial back the tone of the discussion is that quite often it is difficult for individuals to know if they are being misunderstood or whether they themselves misunderstand something. This is a classic example as in my post I explained the difference between a projection and a prediction, but in your reply you ignored this point and return to "but if a model disagrees with nature then there is something wrong with the model. And that applies to any model.". The distinction between a prediction and a projection is very important in this situation because the reason for the disagreement may be because the scenario (the X) is not a sufficiently accurate representation of reality, and that needs to be taken into account.
If you think that someone is using a subtle distinction between words to evade a point, then the onus is on you to do your best to understand the distinction when it is explained to you, rather than just ignore it, which leads the discussion to becoming ill tempered.
I am a big fan of Hanlon's razor ("never attribute to malice that which can be adequately explained by thoughtlessness/stupidity"), which I generalise to "always try to view the intentions of others in the best light that is consistent with the observations". So rather than assume that someone is being evasive, assume there is some subtle point that you don't understand and help them to explain it to you.