


 Arguments


Monckton Misrepresents Reality (Part 3)
Posted on 26 February 2012 by dana1981, Alex C, Tom Curtis
") On 19 July 2011, Monckton debated Richard Denniss, a prominent Australian economist, author and public policy commentator. During that debate, Monckton delivered his usual Gish Gallop, repeating a number of long-debunked myths and misrepresenting climate science research. A few days later, we at Skeptical Science detailed the various Monckton misrepresentations in the debate.
On 19 July 2011, Monckton debated Richard Denniss, a prominent Australian economist, author and public policy commentator. During that debate, Monckton delivered his usual Gish Gallop, repeating a number of long-debunked myths and misrepresenting climate science research. A few days later, we at Skeptical Science detailed the various Monckton misrepresentations in the debate.
Monckton has recently responded to our comments, defending his debate arguments. However, Monckton's defense amounts to little more than additional misrepresentations. As John Cook recently alluded to, we will proceed to examine the mishmash of Monckton misrepresentations that ensued. In his response, Monckton misrepresented scientists' own work (as we saw in Part 1), specific situations (as we saw in Part 2), and reality in general (as we will see here in Part 3).
Monckton Misrepresents IPCC Projections
Monckton originally claimed that the IPCC had said future climate change cannot be predicted. We took issue with this claim, since the IPCC report specifically projects future climate change under various emissions scenarios (Figure 1).
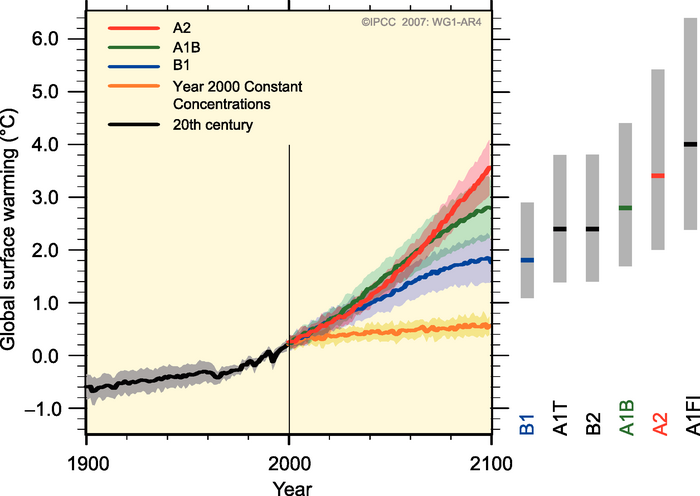
Figure 1: Global surface temperature projections for IPCC Scenarios. Shading denotes the ±1 standard deviation range of individual model annual averages. The orange line is constant CO2 concentrations at year 2000 values. The grey bars at right indicate the best estimate (solid line within each bar) and the likely range. (Source: IPCC).
In his response to us, Monckton provides an argument that is based on quote-mining the 2001 IPCC Third Assessment Report and taking a single sentence out of context - the first sentence in the quote below. The context of the quote is provided in the following sentences (emphasis added):
"The climate system is a coupled non-linear chaotic system, and therefore the long-term prediction of future climate states is not possible. Rather the focus must be upon the prediction of the probability distribution of the system’s future possible states by the generation of ensembles of model solutions. Addressing adequately the statistical nature of climate is computationally intensive and requires the application of newmethods of model diagnosis, but such statistical informationis essential."
In short, the IPCC is saying that we cannot precisely predict the future climate state; however, we can produce a probability distribution of possible future climate states, which is precisely what the IPCC report proceeds to do. Monckton has misrepresented the IPCC report by selecting a single sentence that serves a convenient purpose out of context, and choosing to ignore the text immediately following, not to mention essentially entire sections of the IPCC report where they do indeed detail the probabilities of future climate states from model ensembles.
Monckton Misrepresents Runaway Warming
Monckton claims that the amount of warming that climate scientists expect (~3°C from doubled atmospheric CO2) is based on an "assumption" that climate feedbacks will behave like an electronic circuit. This is incorrect - as shown in Part 1, the IPCC climate sensitivity estimates are based on a wide range of observational data and other lines of evidence.
Monckton also claims that
"A climate subject to the very strongly net-positive feedbacks imagined by the IPCC simply would not have remained as stable as it has."
This is the myth "positive feedback means runaway warming." The concept is incorrect, as Chris Colose recently explained with great clarity. In short, a system with positive feedbacks will not be as efficient at changing its outgoing longwave radiation (OLR) in response to forcings (like changing sunlight or CO2). Therefore, a higher surface temperature change must result in order to accomodate the necessary change in OLR to re-establish planetary energy balance. There are situations in which the OLR cannot increase enough to match the amount of sunlight that Earth absorbs in which case a runaway greenhouse can be triggered; however, Earth is nowhere near this state of affairs (Figure 2).
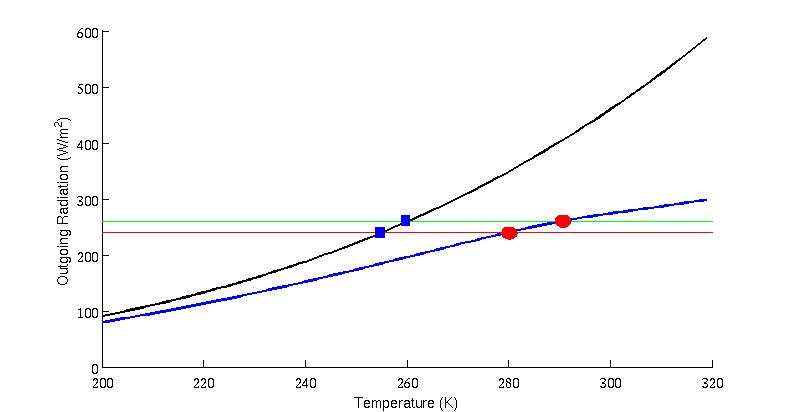
Figure 2: OLR vs. surface temperature for a blackbody (black curve) and an atmosphere with CO2 and a water vapor feedback (blue curve). The horizontal lines give two values for the absorbed incoming solar radiation, and the colored shapes give possible equilibrium points. On the trajectory where water vapor exists, sensitivity is enhanced because the temperature difference between the two red circles (as sunlight goes up) is greater than the difference between the two blue circles.
As Chris explains,
"There is in fact a negative feedback that always tends to win out in the modern climate. This is the increase in planetary radiation emitted to space as temperature goes up. Positive longwave radiation feedbacks only weaken the efficiency at which that restoring effect operates."
Monckton neglects this effect in his misrepresentation of the potential for a runaway greenhouse effect, which is not triggered by the moderate climate sensitivity of the IPCC report (2 to 4.5°C surface warming for doubled CO2).
Monckton Misrepresents Expected Global Warming
After attempting to defend his use of the Central England Temperature record as an accurate representation of global temperature in his recent blog post (it is not), Monckton attempts to use the value to estimate the transient climate response (TCR), which is defined as the immediate temperature response when atmospheric CO2 levels double. Or more specifically, as defined by the IPCC:
"The transient climate response is the change in the global surface temperature, averaged over a 20-year period, centred at the time of atmospheric carbon dioxide doubling, that is, at year 70 in a 1% yr–1 compound carbon dioxide increase experiment with a global coupled climate model. It is a measure of the strength and rapidity of the surface temperature response to greenhouse gas forcing."
In short, the value is based on the climate response to a compounding CO2 increase (linear radiative forcing increase) over a 70-year period, and simply can't be estimated in the way Monckton has attempted, over the 260-year period during which time there were numerous changes in various radiative forcings. Coincidentally, Monckton also claimed that
"the radiative forcings we have caused since 1750 are equivalent to those from a doubling of CO2 concentration, suggesting that the transient sensitivity to CO2 doubling is around 1 C°."
This is quite incorrect. The actual best estimate net radiative forcing since 1750, according to the IPCC, is 1.72 W/m2 (human plus natural). According to Skeie et al. (2011), the best estimate anthropogenic forcing since 1850 is about 1.4 W/m2 (there are of course large uncertainties in these values, particularly associated with aerosols). The radiative forcing from doubled CO2 is 3.7 W/m2 - we're not even halfway there yet. In fact, Monckton used to know this, as he got the value correct in his testimony to U.S. Congress in 2010:
"[T]he IPCC’s estimated total of all the anthropogenic influences on climate combined in the 256 years 1750-2005 is only 1.6 W m–2."
However, since Monckton's calculation is inapplicable to TCR anyway, this error is beside the point.
On the other hand, over the past 60 years the net forcing has increased fairly linearly, and thus we can use that timeframe to come up with a rough TCR estimate. Monckton does attempt this calculation, but makes the same error regarding radiative forcing.
"Warming from 1950 to date was 0.7 C°. Net forcings since 1950 were 1.8 Watts per square meter...the transient warming in response to a doubling of CO2 concentration over the present century would be 0.4(5.35 ln 2) = 1 C°"
Monckton did acknowledge one of the errors in his calculation: 0.4*(5.35 ln 2) = 1.5, not 1°C. He does have the surface temperature change correct (approximately 0.7°C since 1950, according to NASA GISS and NOAA), but he once again has the radiative forcing wrong. According to Skeie et al. (2011), the anthropogenic forcing since 1950 is about 1.2 W/m2 (and the natural forcings over this period have been close to zero); not nearly Monckton's claimed 1.8 W/m2.
As Monckton did, we can roughly estimate TCR using the formula TCR = dT/dF, where dF and dT are the changes in radiative forcing and global surface temperature, respectively. We thus estimate 2.2°C surface warming for doubled CO2 - Monckton's original estimate is off by more than a factor of two, and contrary to Monckton's faulty assertions, the amount of warming we have seen is actually consistent with IPCC expectations (Figure 3).
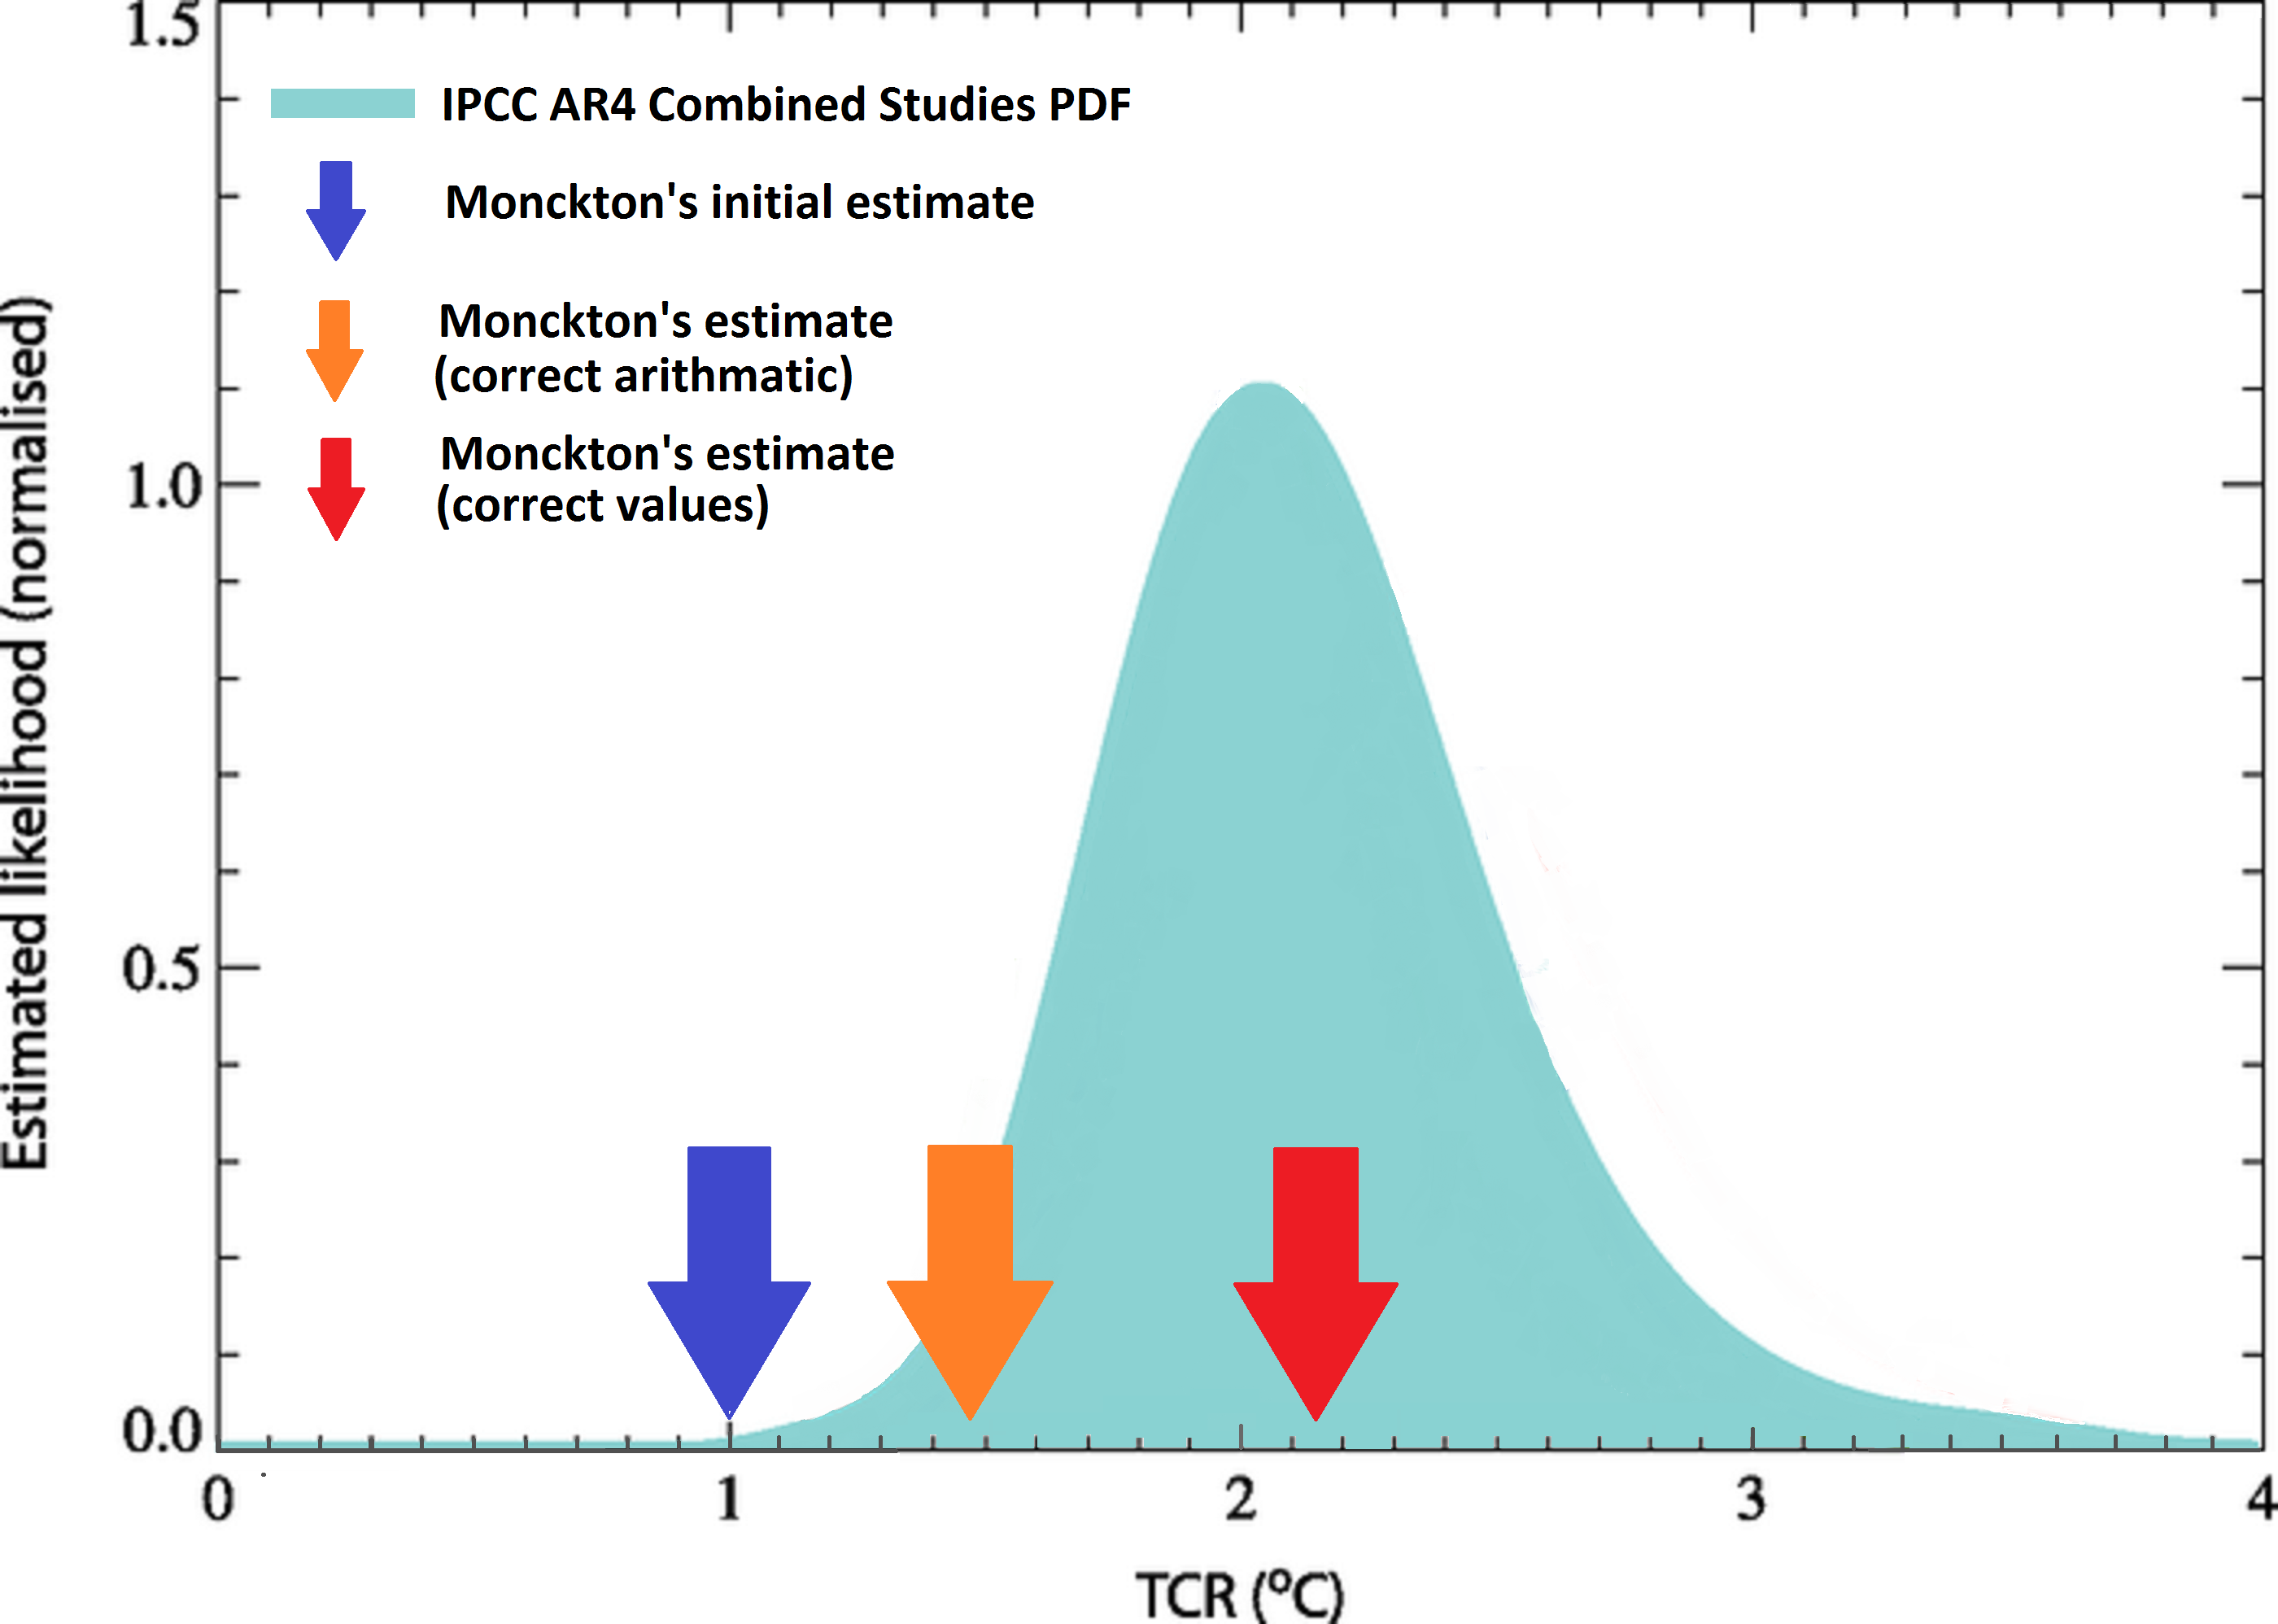
Figure 3: IPCC AR4 TCR estimate based on multiple studies (light blue). Monckton's initial estimate of the transient climate response based on the difference of temperature and forcing 1950 and 2010 (blue) is compared with estimates with mathematical errors eliminated (orange), and with correct values for climate forcing (red). (Graph modified from IPCC AR4 WG1 Fig 9.21, in part by removing the PDFs of the original studies. The original graph can be seen here.) TCRs from various climate models in the IPCC AR4 are also listed here.
Monckton Misrepresents Transient and Equilibrium Warming
Monckton makes one final error, or more accurately, fails to recognize his previous error in his climate sensitivity estimates. In his debate with Denniss, Monckton claimed that since the surface temperature had increased 0.9°C and the radiative forcing was equivalent to doubled CO2 (the latter claim being false, as noted above), "All of the evidence points to 1°C of warming for a doubling of CO2."
However, when we talk about warming for a doubling of CO2, we're generally referring to equilibrium climate sensitivity - how much the planet will warm when it reaches a new energy equilibrium. It doesn't immediately warm this much because of a few factors, including the thermal inertia of the oceans: the oceans store a lot of heat, but they interact with the surface air, so the heat doesn't stay there forever, and eventually the stored heat warms surface temperatures as well.
In his new blog post, Monckton claims
"And of course I have not ignored temperature feedbacks (which Mr. Cook mistakenly confuses with “the thermal inertia of the global climate”..."
No, we did not mistake feedbacks and thermal inertia - they are two distinct effects, both of which contribute to the difference between transient warming (which Monckton was attempting to estimate) and equilibrium warming (which Monckton at least implied he was estimating). At least in his new blog post, Monckton correctly identifies that he is estimating the transient response, but fails to acknowledge the implication that he was estimating equilibrium warming in the debate. Monckton goes on to claim:
"If I am right about temperature feedbacks (see above), then the equilibrium sensitivity will be about the same as the transient sensitivity – around 1 C°."
This is incorrect. Even if the net feedback is zero - which it almost certainly is not - transient and equilibrium warming will still differ due to the thermal inertia of the oceans - the heat stored in the oceans which eventually interacts with the surface air.
Additionally, as discussed above, the net radiative forcing since 1750 is approximately 1.7 W/m2. Combined with Monckton's estimated 0.9°C average surface warming over this period, we get 0.53°C warming per W/m2. For the 3.7 W/m2 radiative forcing associated with a doubling of CO2, this is the equivalent of approximately 2°C surface warming, which not only is larger than all of Monckton's TCR and equilibrium sensitivity estimates, but also well within the IPCC range for TCR.
Given that 70% of the change in forcing since 1750 has occured in the last 60 years, we have not yet reached climate equilibrium. Therefore, Monckton's calculation shows the equilibrium climate response to be greater than 2°C per doubling of CO2 - well within the IPCC range. Consistent with this, the IPCC models typically yield an equilibrium sensitivity of approximately 1.8 times their TCR. Using this rule of thumb on Monckton's incorrectly calculated TCR yields an equilibrium sensitivity of 2.7°C, or close to 4°C using our more accurate (but still very rough) calculation, again well within the range of IPCC estimates.
As noted above, this is not an accurate way of estimating TCR, particularly since most of the radiative forcing increase has occurred over the past 50 years. However, it does demonstrate that Monckton has badly underestimated the climate response to increasing CO2.
Monckton Mispreresents IPCC Graphic
Monckton takes issue with this figure from the 2007 IPCC report (Figure 4).
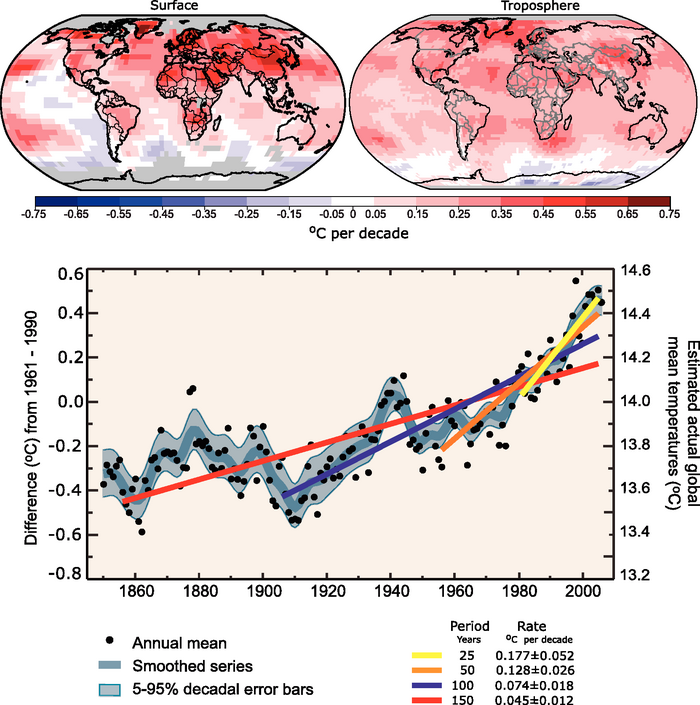
Figure 4: Depiction of various long-term global temperature trends in the 2007 IPCC report
The figure is used in FAQ 3.1 and the Technical Summary of Working Group 1. Monckton asserts that this graph uses a "fraudulent statistical technique" and
"At each place where the altered graph is displayed, the incorrect conclusion is drawn that because trend-lines starting closer to the present have a steeper slope than those starting farther back, the rate of warming is accelerating and that we are to blame."
Again, this is a misrepresentation of the report. The IPCC makes the following claims using this figure:
1) The pace of warming accelerated over the course of the 20th Century. Notice the past tense. Here is the specific claim (from the caption for Figure 1 of FAQ 3.1, emphasis added):
"Linear trend fits to the last 25 (yellow), 50 (orange), 100 (purple) and 150 years (red) are shown, and correspond to 1981 to 2005, 1956 to 2005, 1906 to 2005, and 1856 to 2005, respectively. Note that for shorter recent periods, the slope is greater, indicating accelerated warming."
2) That the pace of warming over the last 25 years is greater than that in preceding years on the record.
3) That the "... global average temperature has increased, especially since 1950."
All of these statements are true. The IPCC does not state that the rate of warming continues to accelerate, and does not use this figure to claim that humans are to blame for the accelerated warming, although in the FAQ 3.1 figure caption, the IPCC does explain how we know humans are the cause of the acceleration:
"From about 1940 to 1970 the increasing industrialisation following World War II increased pollution in the Northern Hemisphere, contributing to cooling, and increases in carbon dioxide and other greenhouse gases dominate the observed warming after the mid-1970s."
Monckton's claims of a "fraudulent statistical technique" are without merit, and a misrepresentation of the IPCC report's actual content. Note that this point has also been developed into the rebuttal to the myth "IPCC graph showing accelerating trends is misleading."
Perhaps worst of all, Monckton has engaged in this same "fraudulent statistical technique" himself. In his St Paul adress (and other places) Monckton has cited the IPCC as predicting a 6 cm contritubtion from the great ice sheets of Greenland and Antarctica to global rise in sea level by 2100. The IPCC, however, quotes no such figure. Indeed, Monckton bases his claim, not on any statement from the IPCC about the contribution of the great ice sheets by 2100, but on the trends from 1961 and 1993 to 2003, as shown on the IPCC WG1 Table 5.3, and displayed on Monckton's slide. Monckton clarifies how he derived the figure in his response to Abraham, saying:
"[N]otice the IPCC’s table of observed contributions to sea-level rise over the past 40 years, from which it is not difficult to calculate that on present trends the great ice-sheets will contribute around 6 cm to sea-level rise over the next 100 years".
"Present trends," if extrapolated linearly only show a rise of 4 cm by 2100, so Monckton must have calculated a change in trend based on the greater trend between 1993 and 2003 than that between 1961 and 2003 (see Figure 5). That is, Monckton has made the same type of inference which the IPCC refused to do, and which he describes as a "fraudulent statistical technique."
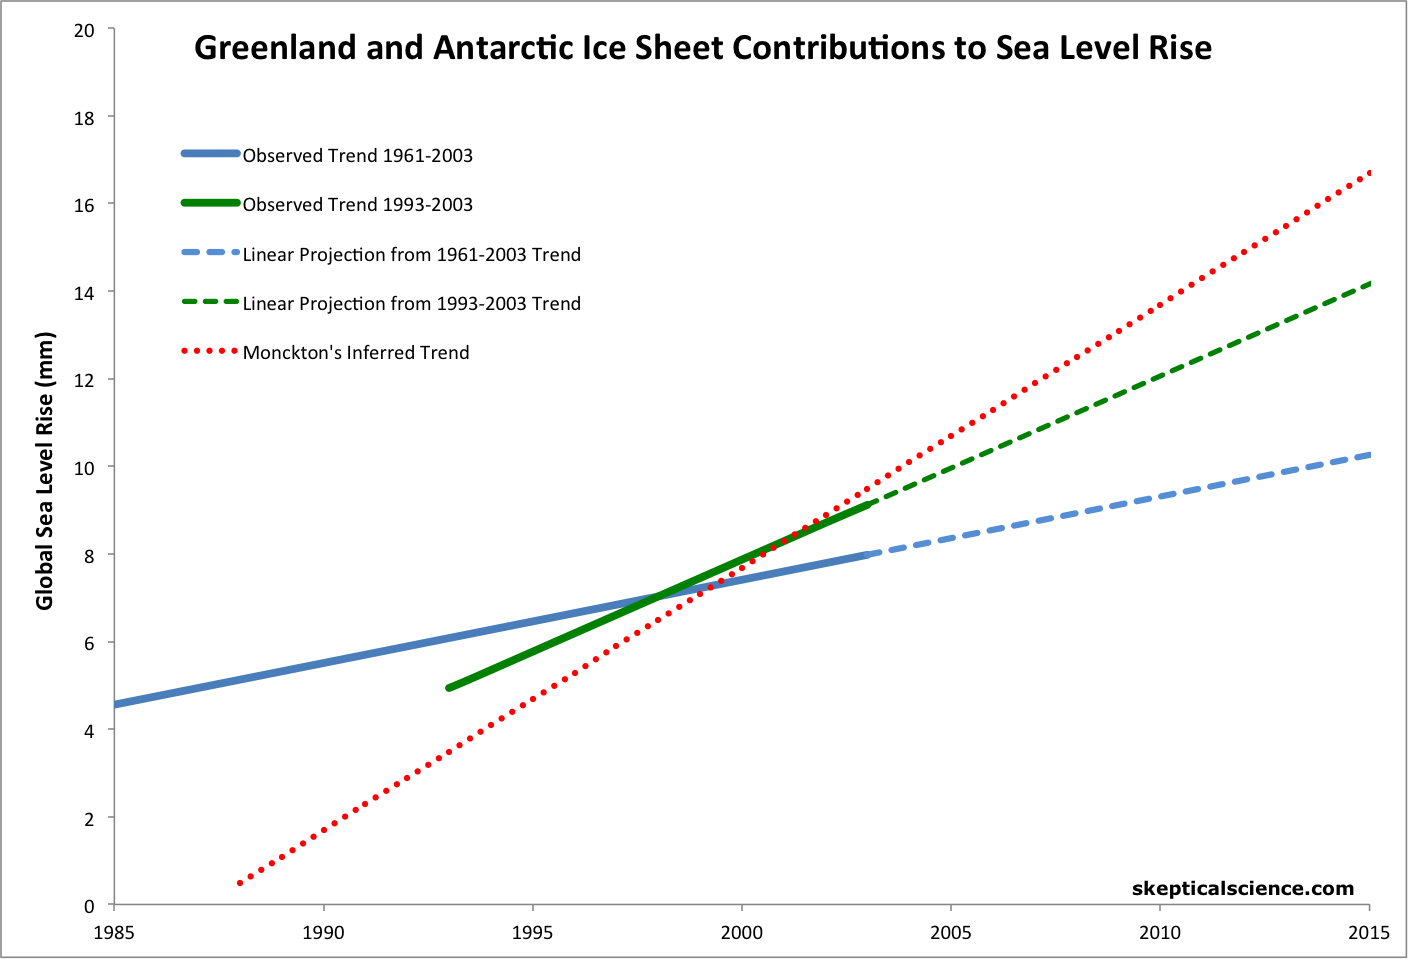
Figure 5: IPCC Greenland and Antarctic ice sheet contributions to sea level rise (linear trends) from 1961 to 2003 (blue, solid) and 1993 to 2003 (green, solid). These trends are extrapolated forward in time (dashed), and Monckton's claimed 6 cm per century rise is shown in comparison (red, dotted). Note this figure is our interpretation of Monckton's argument, and was not created by Monckton himself.
Summary of Monckton Misrepresentations
We have recently examined Patrick Michaels' serial misrepresentations of other scientists' work (here, here, here, and here). Like Michaels, Monckton has a long history of similar scientific misrepresentations (i.e. here, here, here, here, here, and here).
Now we have seen that in his debate with Denniss and subsequent self-defense, Monckton has misrepresented scientific research, data, and reality in general in virtually every one of his arguments. It seems as though Michaels and Monckton are simply incapable of accurately representing scientific literature, and the state of climate science research in general.
As with Michaels, we are forced to conclude that websites which purport to exhibit climate skepticism but which continue to publish Monckton's serial scientific distortions greatly diminish their own credibility.


Monckton is a fool with zero scientific training. I'm surprised you gave him this much attention.