Climate Science Glossary

Term Lookup

Enter a term in the search box to find its definition.

Settings

Use the controls in the far right panel to increase or decrease the number of terms automatically displayed (or to completely turn that feature off).

Term Lookup

Settings


All IPCC definitions taken from Climate Change 2007: The Physical Science Basis. Working Group I Contribution to the Fourth Assessment Report of the Intergovernmental Panel on Climate Change, Annex I, Glossary, pp. 941-954. Cambridge University Press.

Home Arguments Software Resources Comments The Consensus Project Translations About Support

Bluesky Facebook LinkedIn Mastodon MeWe

Twitter YouTube RSS Posts RSS Comments Email Subscribe


Climate's changed before
It's the sun
It's not bad
There is no consensus
It's cooling
Models are unreliable
Temp record is unreliable
Animals and plants can adapt
It hasn't warmed since 1998
Antarctica is gaining ice
View All Arguments...


Username
Password
New? Register here
Forgot your password?

Latest Posts

Archives

Hiding the Incline in Sea Level

Posted on 15 November 2011 by dana1981

A number of climate not-so-skeptics have recently been exploiting global sea level data in their latest attempt to hide the incline.  Skeptical Science readers will be very familiar with the tactics the "skeptics" use to make this argument:

  1. Cherrypick a very small amount of data during which the short-term noise has dampened the long-term incline

  2. Ignore the long-term trend

  3. Refuse to examine the reasons behind the short-term change

Climate "skeptics" have used this exact same strategy to hide the incline in global surface temperatures (here and here and here), lower troposphere temperatures (here), and ocean heat content (here and here).  We've found that an effective way to reveal the deception of these arguments is with an animated GIF, comparing the long-term data with the short-term "skeptic" cherrypick.  Figure 1 makes this comparison for the global mean sea level data during the satellite radar altimiter record (since 1993) from the University of Colorado.  The first frame shows the entire record, the second shows recent periods of flat or declining mean sea level, and the third shows the most recent short-term decline.

msl

Figure 1: University of Colorado global mean sea level data with a 12-month running average, and short-term declines.

Cause of Short-Term Decline

Figure 1 confirms that yes, global mean sea level has declined slightly over the past year or so, and even slightly more than previous recent declines.  But a true skeptic should ask what has caused this short-term decline, especially since it appears counter-intuitive.  After all, land-based ice continues to melt rapidly, and the oceans continue to warm rapidly (thermal expansion of ocean water contributes to sea level rise).  So what has dampened the long-term sea leve rise illustrated in Figure 1?

As Skeptical Science has previously reported, climate scientists attribute the short-term decline to extreme flooding in 2010.  This period also saw a strong La Niña cycle, which typically results in an increase of rain and snow falling over land, which corresponds with a fall in global sea level.  The last 18 months has seen some epic deluges throughout the world; countries such as Pakistan, Sri Lanka, Australia, the Philippines, Brazil, Colombia, and the United States have been hammered with extreme flooding.  Figure 2 illustrates where the water has gone.

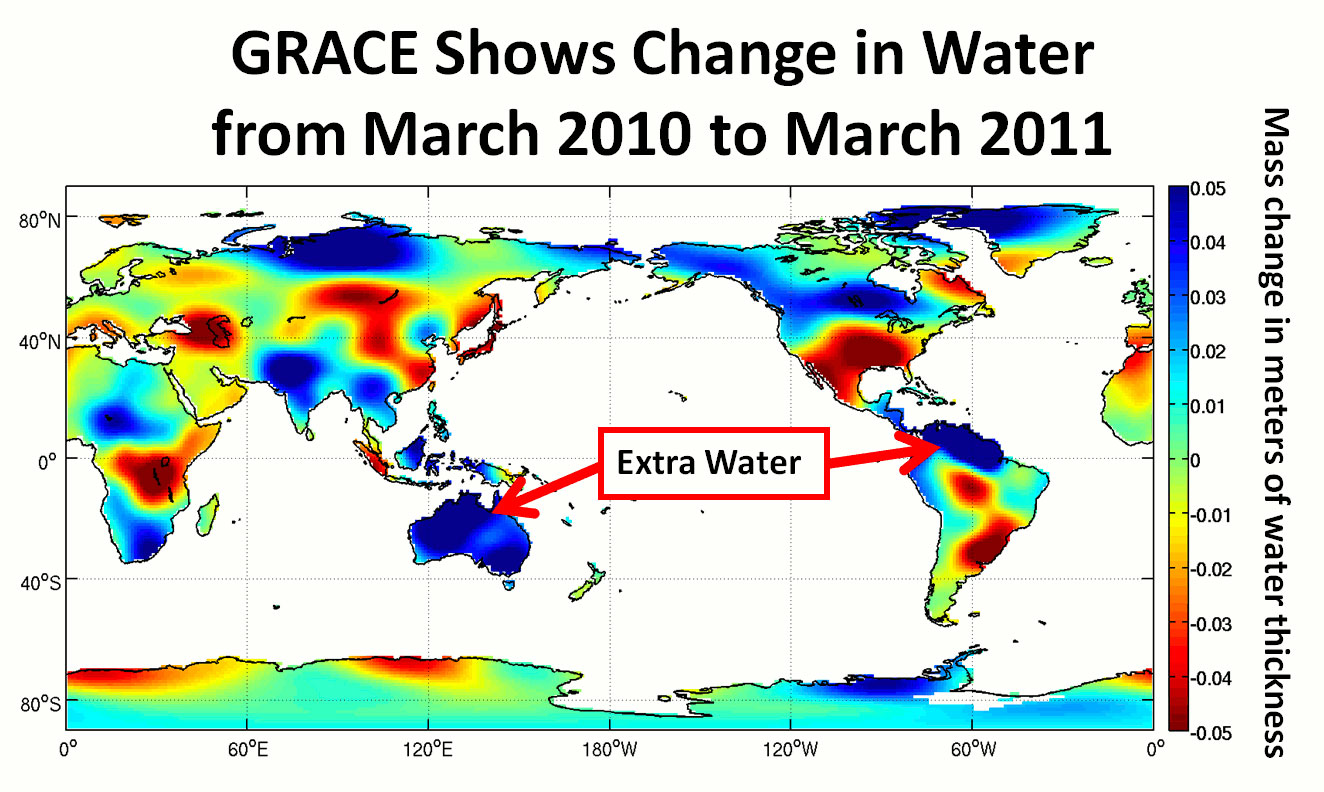
Figure 2: Change in land-based global water storage in the period March 2010 to March 2011, as observed by GRACE gravity satellites. Image from NASA JPL.

Cherry-Flavored Water

In short, arguments that sea level rise has stopped are based on the same tired old "skeptic" tricks of cherrypicking short-term data and ignoring the long-term trend.  We know that ocean warming and melting ice will cause sea level to rise over the long-term, and the only reason the sea level rise has temporarily slowed is that there was so much flooding in 2010 - hardly a result worth celebrating.  As long as humans continue to warm the planet by increasing the amount of greenhouse gases in the atmosphere, we can expect the long-term sea level rise to continue.

Note: This post has been adapted into the Basic rebuttal to Sea level fell in 2010.  Rob Painting previously published the Intermediate rebuttal.

0 0

Printable Version  |  Link to this page

Comments

Comments 1 to 45:

  1. Please allow me to ignore the long term trend and cherry-pick like a real skeptic (inverse skeptic actually) to show that sea levels are rising currently with a very alarming rate of ~40 mm per 2 years or 20 meters per century!
    0 0
  2. The animated Gif of Global Sea Level Data is interesting - especially the page of "skeptic" data. Does anyone else notice a four(ish)year pattern between the intervals of falling sea-level?
    0 0
  3. Cornelius, it looks like that pattern corresponds roughly to La Nina periods of ENSO cycles. Also, techies might be aware that there's recently been severe flooding in Thailand, where most of the world's hard drives and hard drive motors are made. This has caused supply to plummet, prices to skyrocket, and widespread hoarding of HDDs over the last few weeks. Brick-and-mortar stores were insulated for a while, but their stocks are running low too and I've heard from many people who've had to spend half a day trying to scrounge up a drive at all. If you can find any place that has a 1-2TB HDD, expect to pay double what you would have over the summer. Major OEMs have already bought up most of the remaining supply, but even they might not be able to ship PCs in the volumes they were expecting due to the shortage. And the shortage is projected to continue far into next year before production is back to normal levels, not even taking into account a backlog of pent up demand. Besides the immediate human tragedy in these regional disasters, extreme flooding in major manufacturing areas has world-wide economic repercussions. And such flooding is expected to become more frequent in a warmer world.
    0 0
  4. I am at least one skeptic that does not think that two years of declining sea level negates the long term trend. Maybe, just maybe, it is the start of a downward trend, but it appears unlikely. I don't know of any skeptics making a claim that sea level rise has ended. The only true statement about the decline is that it has declined for the past two years.
    0 0
  5. I love these animated GIFs. Thanks, jg!
    0 0
  6. WheelsOC - that's a good point. I hadn't thought of using the current HDD shortage as evidence of the sort of impacts climate change can have (by increasing severity of flooding).
    0 0
  7. @apiratelooksat50 " I don't know of any skeptics making a claim that sea level rise has ended" I guess you haven't seen the Steve Goddard posts at W(-snip-)UWT Of course, you did use the term "skeptic", so you may have a point.
    0 0
    Response:

    [DB] Please emulate the standards of this site.  Inflammatory snipped.

  8. apirate - I am quick to point out your errors, so I should probably point out your analysis of sea level rise is correct. Thanks for sticking with this site.
    0 0
  9. I have to say the animations really reveal and clarify the difference between "skepticism" and "running from reality". Thanks, dana1981, great post.
    0 0
  10. alan @5 - actually they're my GIFs, but thanks. KR @9 - thanks to you too.
    0 0
  11. I know the global temperature record should be looked at over a period of +/- 30 years, to get the trend. Is the same time scale appropriate for sea level data? I intuit that it should be, but that is an 'assumption', not a 'peer reviewed analysis'. How long have we been taking reliable sea level measurements?
    0 0
  12. dana - You made it happen, kudos to you. The fact that the animations have appeared on a dozen or so other blogs/newsites/etc is because they make the point, using data you have compiled.
    0 0
  13. And not only hard drives, apparently blank spectacle lenses are in short supply (in Australia)as also flooded.
    0 0
  14. Doug @11 - as noted in the post, the satellite sea level record begins in 1993 (so that's where I started the data). We've got tide gauge measurements going back more than a century though, as I recall.
    0 0
  15. Doug@11: A quick by-eye metric. On Cynicus' graph you see one other excursion from trend comparable in size to last years - 1998. So our first guess should be that we might see excursions like this on a 1-2 decadal basis.
    0 0
  16. dana1981 and Kevin C: Thanks for the extra info. Makes the situation clearer. Having fun getting into all this, even though with no scientific training. This site makes learning merely a matter of reading and assimilating; much less technical than I had first thought. Thank you all for the information aimed at people on my level of understanding.
    0 0
  17. Has anyone calculated how long it takes the extra precipitations to endup back in ocean by river runooffs? It's fairly easy to find for example: Rainfall anomaly for last 18 month in AUS which is about 500mm nationaly, to my eye. Now if I new the runoffs and extra evaporation rate, I guess I could easily calculate the time needed for this water to get back to ocean.
    0 0
  18. Sailrick @ 7 What website is W(-snip-)UWT?
    0 0
    Response:

    [DB] See my admonition to Sailrick.

    Also, be advised that sock-puppetry is a bannable offence here.  The Comments Policy will be revised to reflect that. One presence per person should be sufficient for anyone.

  19. apiratelooksat50, that website is wattsupwiththat.com, as I believe you very well know.
    0 0
  20. For the sea-level rise (and energy budget) on a longer term, the most recent analysis from Church et al. 2011 (GRL) can be read here : http://ess.uci.edu/researchgrp/velicogna/files/2011gl048794.pdf There is also an overview from Cazenave et Rémy 2011, but no free access : http://onlinelibrary.wiley.com/doi/10.1002/wcc.139/abstract
    0 0
  21. First, almost identical posts (with the same graphics) appeared a few months ago, eg. this Secondly, I have reviewed a lot, even extremely skeptical - "aggressively" opposition - blogs. None of them says that: warming has no effect on sea level rise, or that the current decline is certainly the beginning of the long-term trend. For them it is just proof of underestimation of natural variability - and overestimation of the impact of GHGs manmade on the climate sensitivity, which seems to confirm this, and this figure and this comment: “... the hypothesized "accelerating" global warming has not caused the hypothesized "unequivocal" increase in mean sea levels, as the chart clearly indicates. In fact, mean sea levels have actually decreased, counter to all IPCC expert and climate model predictions - literally, a stupendous scientific fail. Although linear trends don't necessarily make for very good long-term predictions, this empirical evidence is suggesting a far less worrisome, non-catastrophic increase in sea levels ...” - which is in opposition to this comment Hansen (coauthor) of this year: “Gravity satellite data, although too brief to be conclusive, are consistent with a doubling time of 10 years or less, implying the possibility of multi-meter sea level rise this century.”
    0 0
    Response:

    [DB] "In fact, mean sea levels have actually decreased"

    Defend this statement with a citation to a substantive source (reputable, not some "skeptic" blog).  Add in the appropriate context for why this change is significant.

    "Although linear trends don't necessarily make for very good long-term predictions"

    Indeed, it is just the fake-skeptic blogs, like those you cite, that maintain this canard that SLR is, and will continue to be, linear.

    If everyone can refrain from responding to this comment until Arkadiusz addresses the above points, I'd appreciate it.

  22. Arkadiusz Semczyszak @21, it is a convenient myth of AGW deniers that climate scientists ignore natural variability. As can be seen in the figure 1 above, there have been periods of zero or negative sea level rise in the past, a fact climate scientists are well aware of. Those periods are consequences of natural variability set against a background, accelerating long term trend. As also are periods of very rapid rise in sea level, as occurred in 1998. This interest in natural variability is why Church and White 2011 draw attention to a plateau in sea level rise probably due to Mount Pinatubo. It is why the CSIRO draw attention to the relationship between ENSO and detrended Global Mean Sea Level: What climate scientists do not do is take those periods of natural variability and inflate their importance well beyond what the data will bear. That is intolerable to deniers. Any account of natural variability that does not call the whole theory of AGW into question is insufficient, in their opinion. Which is why those sites trumpeted the fall in sea level in 2010, without discussion of the cause beyond the ultimately vague term of "natural variability". And why they will not be giving the same prominence to the recovery of sea level since then, which is now above the recent trend (3.2 mm per decade) once more (See graph @1). And what they absolutely never do is point out that a GMSL rise of 3.2 mm /decade is more than 2 Standard Deviations higher than the mean of 20 year trends of GMSL since 1880 (Mean: 1.45, 1 SD 0.79). Because that would let the cat out of the bag.
    0 0
  23. Sorry, forgot to include the link for the last piece of data, which is from Church et al, 2008. Specifically, figure 3 C.
    0 0
  24. Tom Curtis @ 22 The SOI and Detrended GMSL only appear to show strong opposite correlations in the most extreme cases - the 97-98 El Nino and the 2010-11 La Nina. Do you have any data on past extreme ENSO events showing such negative correlations? Also the linear trend line of Topex and Jason readings appear to be more of two distinct trends. Jason 1 and 2 seem to be on a lower trend line of about 2mm/year with a step between the two trends. This could be explained by calibration error between the satellites.
    0 0
  25. victull @24, the inverse correlation between the Southern Oscillation Index (an index of the ENSO oscillation) and detrended GMST is evident not only in 1998 and 2010, but also during the La Nina's of the period 1999-2001, and 2008. It is also evident during the El Nino's from 2002-2007. They only place it seems significantly depressed is during the early 1990's, ie, when the global energy budget was dominated by Mount Pinatubo. What is clear from the chart is that there is (at least) one other source of natural variability in detrended sea level of similar magnitude to the effect of ENSO events of ordinary magnitude. As to past data, I have not particularly searched, and am not sure the error in estimates from tide gauges are sufficiently small to make effects of that size meaningfully detectable. Finally, a simpler explanation of the "step change" between Jason and Topex is the concurrent "step change" in ENSO states. Or is that due to calibration error too?
    0 0
  26. I think the article should mention that "skeptics" were making similar claims about the previous "pause" in 2008.
    0 0
  27. Tom @22, Great post. Thank you, it makes the efforts to obfuscate and misinform @21 look rather pathetic.
    0 0
  28. @apiratelooksat50 #4 "I don't know of any skeptics making a claim that sea level rise has ended." I know of one. Lord Christopher Monckton was on my local airwaves claiming that sea level rise has reversed. I'm not sure if he has any credibility in your books, but I was quite angry that he was contributing to the scientific illiteracy of that radio station's listeners.
    0 0
  29. Monckton has actually repeated Nils-Axel Morner's absurd claims that sea level hasn't risen in 50 years.
    0 0
  30. In response to those "skeptics" here claiming that "the current decline is certainly the beginning of the long-term trend." You missed the posts at Goddard's web site then, and posts like this at the misinformer site WUWT. And this is not the first time "skeptics" have tried this trick with sea level. For example, this effort to mislead by Pielke Senior from mid 2009 was exposed by Tim Lambert and RealClimate.
    0 0
  31. its funny how noone ever knows any skeptics
    0 0
  32. #30 Albatross, I had a rather strong case of deja vu reading your link to Tim Lambert there...
    0 0
  33. Hi Skywatcher @32, I know, annoying is it not? Pielke et al. just keep repeating the same old cherry picking and BS (bad science). They have a good recipe going: 1) Make a demonstrably false and/or misleading assertion, 2) Rarely, if ever, concede error or correct errors, 3) Repeat. Unbelievable that Pielke Senior is a fellow of the American Geophysical Union, in other words he does know better, yet insists on embarking on misinformation campaigns. But I draw the line at him misleading impressionable students as shown here. I wonder in what capacity Pielke senior is engaging in this latest bout of misinformation? Was his Q&A part of CIRES outreach initiative or something else? Maybe the AGU should revisit their decision...
    0 0
  34. Albatross @30, thankyou for the links. In particular John Kehr's breathtaking effort at WUWT says:
    "One fact is certain. A drop in sea level for 2 of the past 5 years is a strong indicator that a changing sea level is not a great concern. In order for the IPCC prediction to be correct of a 1m increase in sea level by 2100, the rate must be almost 11 mm/yr every year for the next 89 years. Since the rate is dropping, it makes the prediction increasingly unlikely."
    gives perspective to pirate's claims @4 and Arkadiusz's claims @21. You will have noted that in defending denier honour they have only denied that deniers have taken the most extreme stance, ie, that 2010 was the start of a long term negative trend. Perhaps, but denier's have clearly drawn long term conclusions about probable trends from 2010. That leaves aside Kehr's persistent misrepresentation of the IPCC as predicting 1 meter of sea rise by 2100. In fact they predict only 0.425 meters of sea level rise (the mean of the worst case prediction, 95% confidence interval of 0.26 to 0.59). Such flagrant misrepresentation must be why Roger Pielke Snr has such a high opinion of WUWT as a science site [/sarcasm]. Even more breathtaking are the claims at the site to which Arkadiusz links. Note the carefully placed qualifiers (underlined) in his claim that no denier "...says that: warming has no effect on sea level rise, or that the current decline is certainly the beginning of the long-term trend." Perhaps not, but deniers are certainly glad to say warming has little effect, and more importantly that the decline in sea level gives significant reason to expect low long term trends. From Arkadiusz chosen site we see short term trends projected out to 90 years with the claim that:
    "empirical evidence is suggesting a far less worrisome, non-catastrophic increase in sea levels than what the taxpayer funded alarmist "experts" have predicted. Based on this real world data, it's highly unlikely that major coastal regions will be impacted by the wildly speculative higher sea levels."
    (My emphasis) "Highly unlikely" based on a short term trend from a satellite data set in significant disagreement with four other satellite data sets, and with the tidal gauge record. Nothing uncautious about that [/sarcasm]. And that is the example Arkadiusz gives of the reasonable projections made by deniers from short term trends.
    0 0
  35. Tom @34, Thanks for your post. Why am I still shocked by the blatant lies, distortions and misrepresentations of the deniers?
    0 0
  36. Albatross @33, the galling thing with Pielke (and Curry) is that while Watts may literally not know what is wrong with projecting short term trends, Curry and Pielke certainly do. When I first encountered similar arguments regarding the temperature record, and my knowledge of statistics could have been written on a business card, I just looked at the temperature record and saw very similar "pauses" in the temperature record in the past. Obviously, if the argument was any good now, it was equally good during those pauses, and therefore that if the short term trends post 1998 refuted global warming, then so did the short term trends post 1980 and post 1988. I proceeded on the assumption that climate scientists are not complete fools, that they were not promulgating a theory that had been refuted by obvious data 25 years ago. Ergo from short term trends must be bad. If a philosophy graduate can recognize that so easily, then a PhD in science who must at least know the meaning of statistical significance cannot be taken in by such sophistry. There, therefore, can be no excuse for their promulgation of anti-science.
    0 0
  37. Tom @36, "If a philosophy graduate can recognize that so easily, then a PhD in science who must at least know the meaning of statistical significance cannot be taken in by such sophistry. There, therefore, can be no excuse for their promulgation of anti-science." I agree. Kudos to you Tom, I had always assumed that you were a publishing scientist from your fact-filled and thoughtful and reasoned posts. Pielke and Curry could learn a thing or two from you ;) I am dumbfounded that the AGU and others continue to stand behind Pielke Senior after years of him misinforming. In my opinion, Pielke Senior is bringing the AGU (and CIRES his current affiliation) into disrepute and they should not stand for it. My dad was a professional engineer, he had to abide by certain principles and a code of ethics. Had he behaved as Pielke Senior has been in the public domain he would have no doubt had his professional status and privileges rescinded, or at the very least been hauled before a committee to explain himself. It is galling that these guys continue get away with this scot-free.
    0 0
  38. As a degreed scientist (M.S.) and a science teacher and a practicing environmental scientist and an AGW skeptic: I don't see anything significant in the 2-year or so dip in SLR. It doesn't really have an affect on the overall SLR rate. On the other hand, give it a few more years like that, and we may have another discussion on our hands. But, for now, it needs to be treated as a cyclical anomaly.
    0 0
    Response:

    [DB] "it needs to be treated as a cyclical anomaly"

    Please share with us the scientific basis for this assessment.

  39. DB, in the short time frame provided in the graph, there have been patterns of increased and decreased SLR. This current decline in SLR appears greater than the historical declines. That, in and of itself, means nothing at this point, but bears monitoring. There is still an upwards trend in sea level.
    0 0
  40. I woke up this morning and measured my height accurately. I did it again the end of the day I found I had gotten shorter by 15mm! I carefully noted this appalling shortcoming and then proceeded to extrapolate this trend and found that within a year I would be about five metres shorter! Shirly I was wrong! Bert
    0 0
  41. Pirate, and unlike at other times, we have the Grace satellite measurements to tell us where that water has gone. Not trapped in ice, but onto land.
    0 0
  42. apiratelooksat50 - "for now, it needs to be treated as a cyclical anomaly" Actually, I would opine that this should be treated as inherent variation in the climate system. A 'cyclic' phenomena would have a repeating period and amplitude, whereas the rather chaotic variations in weather which lack such characteristics (as does ENSO, for that matter) are better described as aperiodic variations. Calling it a 'cyclic anomaly' ascribes more regularity to the variations than they actually possess.
    0 0
  43. One more excellent post from Skeptical Science this week that I just had to repost in full. Tellin’ it like it is: by dana1981 A number of climate not-so-skeptics have recently been exploiting global sea level data in their latest attempt to hide the incline. Skeptical Science readers will be very familiar with the tactics Source: “Hiding the Incline (Global-Warming-Denier Junk Science)” Zachary Shahan, Planetsave, Nov 18, 2011 To access thjs Planetsave post, click here.
    0 0
  44. David Archibald has joined the party to hide the sea level incline. I lost count of the errors in the post, but I know that would have filled a denialist-tactic bingo card in about 60 seconds...
    0 0
  45. ...that it would have...
    0 0

You need to be logged in to post a comment. Login via the left margin or if you're new, register here.


The Consensus Project Website

THE ESCALATOR

(free to republish)


© Copyright 2024 John Cook
Home | Translations | About Us | Privacy | Contact Us