


 Arguments


Grappling With Change: London and the River Thames
Posted on 3 August 2010 by Doug Bostrom
 In 1666 Samuel Pepys watched from “a little ale-house on the Bankside” as much of London burned to the ground. Pepys was no stranger to nature and mankind colluding to produce drama, indeed his diary seems peppered with calamities. The year before London went up in smoke Pepys chronicled the Great Plague of 1665. On 20 May of 1663 the prolific diarist noted a combination of rain, wind and tide leaving important portions of the city navigable only by boat:
“Then to Westminster, where by reason of rain and an easterly wind, the water was so high that there was boats rowed in King Street and all our yard was drowned, that one could not go to my house, so as no man has seen the like almost, most houses full of water.”
Without the River Thames there would be no London but like many great cities living with a river the relationship of the two can as tempestuous as it is intimate. This is London so unsurprisingly the “little ale-house” from which Pepys viewed London's incineration is still in business today, operating as “The Anchor.” One may purchase a pint of “London Pride” ale in The Anchor, saunter out to the Embankment and not 75 feet from the door get a direct view and appreciation of London's fruitful but perilous marriage with the River Thames and the estuary and ocean it feeds. Depending on time, tide and winds, looking over the embankment directly in front of The Anchor water is visible directly below at a vertical distance ranging from perhaps 2 to 10 meters. Across the river, the seat of the United Kingdom government and a substantial fraction of the world's economic brain is situated in similar proximity to copious amounts of water, benign or destructive depending on whether the flow remains inside or outside of the Embankment.
The “Embankment” creeping into this narrative needs explanation. Pepys' ale-house viewpoint is located in a neighborhood of London's Southwark Borough known as “Bankside”; the Embankment is an engineered physical feature of London with roots extending back to Roman times and is a crucial part of London's infrastructure. When this region first attracted settlement, leading to the nurturing of a city of some 7.5 millions, nobody knew of the long term behavior of the conveniently located plain next to the river. London as it turns out is largely situated in a floodplain steadily sinking in relation to sea level yet substantial human investment preceded familiarity with the local environment. The result has been a never-ending battle to keep the River Thames contained within its channel, a ceaseless tightening of the grip of water on London and London's constraints on that water itself even as London thrived on the benefits such a river can bring.

Thames Embankment Improvements, 1879 (1) to 1953 (4) (After Defra/Environment Agency Joint R&D FCERM Programme R&D Technical Report FD2319/TR )
Conurbations such as Greater London expose and grow risks even as they sprout and nurture population and architecture. Ideally newly emerging risks will be tackled by public cooperation to the extent they are intellectually, physically and economically tractable. Thanks to efficiently applied public policy in the form of better construction and city planning standards, London's risk of burning from unchecked fire is reduced, just as public policy informed by science has essentially eliminated the chance of contracting plague, or cholera from a drink of London tap water.
Government acting in the public interest has also addressed the risk of flooding on the scale witnessed by Pepys yet the optimal solution to this threat is in a continual state of evolution as our understanding of influences on the behavior of the Thames improves. The flood control and emergency response schemes created during the latter part of the 20th century and now protecting London couldn't account for impacts on sea level and storm intensity from climate change, an oversight borne of circumstantial ignorance, now being dealt with in planning revisions and upgrades to London flood management policy and technical solutions.
There is a possibly apocryphal story of King Cnut (aka “Canute”) setting up his throne on a beach of what was in the 11th century Thorney Island and commanding the river tide to stop, which order it failed to obey. Cnut is said to have done this as an example to his courtiers of the limits of temporal power. Real or not, Cnut's demonstration resonates thanks to its simple lesson of the limits of human power against natural forces. Today Cnut's Thorney Island is no longer an island and is the location of London's Westminster Palace, the location of the House of Commons and House of Lords and the functional seat of the United Kingdom government. Despite sinking land and a rising river, Westminster remains high and dry; engineers, money and sheer stubborn human nature have accomplished what Cnut's command could not. Our power to resist the forces of the River Thames and its relationship with wind and ocean tides has prevailed, occasional events such as what Pepys described notwithstanding. What in fact are our limits here, and what for that matter do we do when it turns out we are not only battling Nature but ourselves, when we learn that defeat may come by our own hand?
London has so far existed in a delicate balance with the River Thames, locked in a pas de deux between man and nature. This performance is made possible only by having enough money to spend over a sufficiently long period of time so as to accommodate the river's inexorable rise in relation to the city. When Pepys saw Westminster surrounded and filled with water, the Thames with the aid of the wind and tide was tipping the scales beyond London's engineered capacity to maintain its desired relationship with the river; the investment in keeping the river at bay was insufficient for the variations of river behavior envisioned by Westminster's planners.
London has steadily invested in and grown not only its capacity to coexist with the River Thames but has also simultaneously vastly increased the stakes at play in this game of push and shove, which is in part a matter of probability, of chance. Leaving aside the civil mind of the United Kingdom as it is embodied at Westminster Palace, a brief lateral distance and no vertical distance at all from Pepys' Anchor and the Embankment lies the entrance to the London Bridge tube station. This Underground station is accessed through multiple grade-level entrances followed by very long escalators leading deep below the surface to the transportation system that allows London to function. It does not require a vivid imagination to picture what would happen in the event of water overtopping the Embankment and making the short trip to London Bridge Station, just one of many facilities and assets similarly situated and equally accessible to uncontrolled water. These include 85,000 properties, 400 schools, 16 hospitals, 8 power stations, 30 mainline railway stations and 38 Underground and light rail stations. Last but not least, 1.25 million Londoners live within the floodplain.
 Flood Risk in Greater London Area (from UK Environment Agency )
Probability of water supplanting commuters in the London Underground neatly encapsulates the core property of flood control measures for London. London's flood management system is first and foremost all about probability of occurrence of certain natural events. What are the chances that the river will rise beyond its constrained position within the Embankment and other barriers and what processes control those odds? Every physical embodiment of the flood control scheme springs from probabilities and their underlying drivers and all of the London flood control works are dedicated to improving the odds against river containment failure.
A series of floods culminating in 1953's great North Sea Flood increasingly concentrated the attention of several successive British Governments on the task of quantifying and thus for the first time being able to engineer the risk of London's flooding. Proper statistics as well as obsessive measurement capabilities and (some will want to avert their eyes at this point) powerful modeling techniques were employed to aid in decisions controlling construction of and operational plans for state-of-the-art, fully rationalized flood control measures for the River Thames.
After all the numbers were crunched, it turned out that ordinarily mundane tides combine with weather systems to produce the most likely cause of a catastrophic flood in London. Upstream precipitation may make a bad situation worse but most of the trouble with the Thames is more probably going to arrive from downstream in the form of a storm surge coinciding with a high tide. The worst possible scenario consists of the combination of heavy precipitation upstream with a spring tide and an unusually powerful storm system pushing water up into the Thames Estuary and it's that circumstance that might see Westminster Palace deluged again. Predictions of climate science indicate this worst-case drama will be more likely in the future.
 1953 Tide and Storm Surge (from Lundbak 1955 )
Enjoy some hours at The Anchor on Bankside drinking too much ale or imagine yourself as Samuel Pepys as he frequently embarked on small craft to cross or travel along the River Thames and it becomes transparently obvious that ordinary tides are a huge factor for engineers seeking to protect London. Broad swathes of beaches along the Embankment vanish as the tide balks the river running through London, the water rises along with what's floating on it and in a few hours time waves lap close to the top of the wall protecting London from the Thames. Where Pepys may have stepped directly into a boat from the Embankment, hours later he might face a long climb down and a trip across the strand. Looking across the river from The Anchor at high tide one sees buildings apparently squatting almost at water level where previously they stood far above the surface.
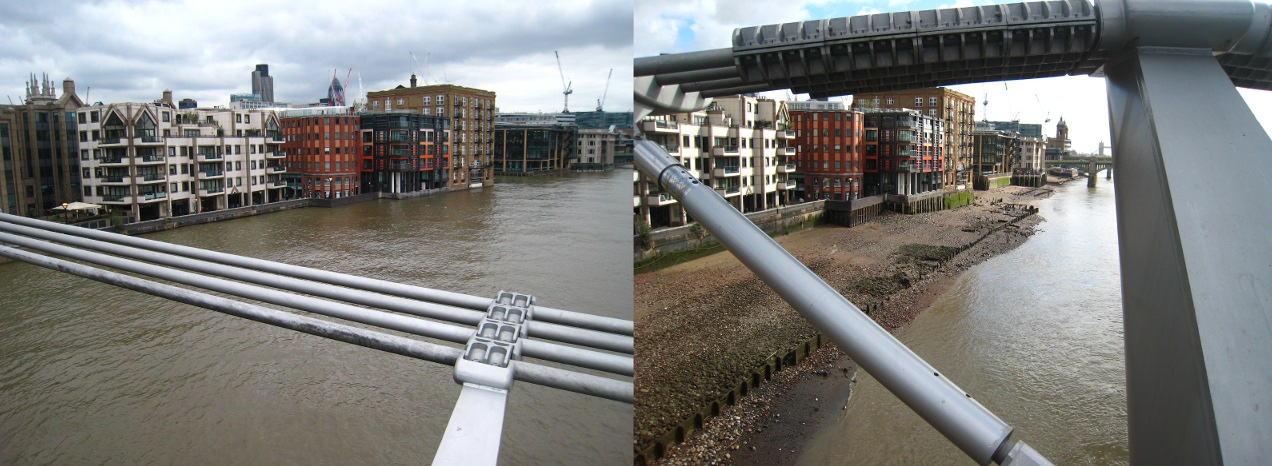 Thames Tidal Range (photos courtesy of Dr. Amanda Bauer )
The infrastructure of the Embankment is arranged to cope with the ebb and flow of tides leaving a relatively small amount of freeboard to account for unusual excursions of the river level such as spring tides combined with high precipitation. Looking up and down the river it is not hard to understand why the Embankment is built to such a low level above mean high tide; there are miles and miles of riverbank to protect and building the Embankment to handle by itself all flooding scenarios is simply not practical or affordable.
The Thames Estuary is a classic shape for enhancing the effect of a storm surge, comprising as it does an enormous funnel with an increasingly shallow bottom in its upper, narrower reaches leading to London. Even if the estuary emptied into deep water it would be of concern, but the outer reaches of the estuary connect to an unfortunately shallow arrangement of bottom topography and shape of the North Sea, English Channel and Strait of Dover. Proximity to the North Atlantic dooms the whole arrangement to frequent, powerful low pressure weather systems generating huge winds in this collection of shallow waters, potentially forcing an enormous surge up into the Thames Estuary to be concentrated at the top, just below London. Depending on the conjunction of tides and weather the Thames may swiftly bound upward far above spring tide levels regardless of the phase of the moon, producing the sort of destructive excursion noted by Pepys in 1663 with its easterly wind, or the 1953 event which took 300 lives in the estuary.
Unlike gravitational tides, occurrences of storm surges are not deterministic, are not perfectly predictable with regard to arrival time and magnitude for centuries to come yet they interact with tides to pose a potentially lethal threat to London. While the exact timings and spacings of the arrival of storm surges are not predictable these features are nonetheless still amenable to statistical treatment and as well the effects of storms on water level can be bounded given valid observations about typical intensities and approach paths of storms to the Thames Estuary. Thus it's possible to produce reasonably useful numbers for engineering purposes when it comes to planning for robust defenses against storm surges.
All of the numerical underpinnings generated by scientists and engineers studying the behavior of the Thames, regional weather and tides are manifested in the physical world with a flood control system having as its centerpiece a remarkable feat of engineering known as “The Thames Barrier.” This enormous equipment can at least temporarily accomplish what King Cnut could not, arresting by main force the rise of the tide or a storm surge in the River Thames as it passes London. In conjunction with a number of lesser yet still absurdly large locks and gates leading to tributary channels this arrangement avoids the vast and essentially impossible amount of effort that would otherwise be required to fully constrain the River Thames during high water events using only embankments.

Thames Barrier (from UK Environment Agency )
Our conditions may turn out to be dynamic though that discovery may well unfold over the course of time. Like many of us Samuel Pepys was fond of stability, didn't like to be swerved from his habits and was perhaps a little too phlegmatic, but he remained sensitive to changing circumstances, rightly so. On the evening in 1666 when London began to burn, Pepys rose from bed briefly to view the glow on the horizon from his home but promptly went back to sleep. The next morning found him bustling between the King of England and the Mayor of London, transmitting instructions to the Mayor to hasten the pulling down of houses to check the fire, a strategy that was initially futile in part due to resistance from property owners. After Pepys' visit to The Anchor, recognition dawned that this inferno showed no sign of stopping and fairly shortly he found the fire arriving practically at his doorstep, a circumstance that seemed outside the range of possibility just hours before. Never one to give up, Pepys responded to changing conditions, sending his gold as well as his wife to a suburb and pondering what else what could be saved from his house. Having a garden and seeing the streets choked with goods, chattel and people late in leaving because of hesitation in the face of a constantly growing threat, Pepys swiftly arrived on a stratagem for preservation as well as an order of priorities for what must be saved. In his yard he buried his papers, his wine and his Parmesan cheese, neatly consistent with his reputation as a man with a rich intellectual life as well as a fondness for worldly pleasures.
Since the design and construction of the Thames Barrier, anthropogenic global warming has moved from a state of hypothesis to that of established, accepted theory, has become a factual challenge. As with Pepys' evolving problem with the Great Fire of London, probabilities of events leading to flooding of London are swiftly changing and the anticipated magnitudes of future floods are increasing even as our ability to recognize and anticipate what we may expect for London's future anniversaries with the River Thames improves.
Here's how the London Regional Flood Risk Appraisal of 2009 describes London's anticipation of changes due to climate change:
- 46. Climate Change will have a major impact on the tidal flooding threat. The rising sea level will steadily reduce the level of protection that defences offer. The predictions for how quickly sea level will rise vary considerably depending on the assumptions used about emissions and climate modelling. The TE2100 project has considered a range of climate change derived sea level rises from 0.9m (Defra 2006 Climate Change Scenario) to 4m (High++ Level where all conceivable sea level rise contributions up to 2100 occur).
- 47. Up to 2030, i.e. to the end of the timeframe of the replacement London Plan, there are limited differences between predictions and existing flood risk management options can continue to provide appropriate risk management for tidal flooding. Beyond 2030 there is more variation in the projections. However it is clear that by starting to plan for these changes now, the ability to cope with more extreme situations will be improved. This is the aim of the London Plan policies.
Changes in probabilities and projected flood magnitudes necessarily lead to physical changes in protective infrastructure. As understanding of climate change has improved, so have the expectations of necessary changes to the Thames Barrier. Earlier estimated chances of overtopping of the current protection scheme have been superseded and even as designers have worked to take changes into account our prognostications become more clear and more challenging. Depending on how climate change unfolds, flood management schemes formerly estimated to offer 1:100 protection may drop in performance to 1:8 by 2050, with many becoming essentially worthless at 1:1 by 2080 (McRobie et al, 2005) . Faced with numbers like those, intermediate scenarios are not a great source of comfort.
While there's a lag between the publication of scientific research results and their uptake by planners and engineers, the recent pace of enlightenment has been swift, leading to frequent reformulations of planning responses. In 2005 a Royal Society paper described how modifications to the barrier could help it to surmount an additional 1.2m of sea level rise on top of the amount anticipated to the original design, the additional amount allowing for the predictions of the then most recent IPCC synthesis with some overhead. These changes were described as allowing the barrier to afford protection for another 100 years past 2030. In 2007 concern about IPCC underestimation of sea level rise in part led to a revision of these plans, calling for total replacement of the structure in 2075 and beginning to acknowledge that uncertainties and undershoot in IPCC estimates of sea level rise were to be taken more seriously. 2010 finds plans centering on upgrading the London flood control system and the Thames Barrier to a level sufficient to handle increases of 2.7m because yet more recent signs coming from research point in that direction, making the aging and initially cautious IPCC assessment quite obsolete.
Sea level changes dominate much of the prognostication on London flood management but there's another outcome of climate change that must be dealt with in the circumstance of coastal areas proximate to the North Sea and that's storm frequency and intensity. These numbers of course help to control probabilities of overtopping. Research suggests that whatever improvements are made to the Thames Barrier and associated systems will be tested with increasing frequency and harshness ( Lowe 2001, Woth 2005 ).
Hints of climate change becoming visible have further increased activity on the part of planners. 2007's historically unprecedented rainfall deluge and subsequent flooding caused enormous damage over a large region southern England, affecting a sizable fraction of the population and unleashing a civil emergency response on a scale unseen since World War II. The flood prompted national-level reassessment of flood hazards for all of the United Kingdom. The result was the governmental Pitt Review, a comprehensive assessment of flood hazards and response strategies. The Pitt Review in turn found that 2004's governmental Foresight Future Flooding Report had already been superseded by fresh information with regard to climate change. In particular, possible five-fold losses of statistical protection are noteworthy:
- There is a greater risk of extreme sea-level rise. Coastal flood risk remains one of the biggest risks the UK faces and, although the mean estimates of sea-level rise have not changed since 2004, larger rises of up to 1.6m, due to melting of large ice-sheets in Greenland and West Antarctica, are now a small, but real possibility by 2080. Communities living behind good coastal defences currently protecting them against a flood with a chance of occurrence of 1 in 100 each year could experience a drop in standard of protection by the end of the century to as low as 1 in 5 each year if we were to follow a business-as-usual flood management policy.
In sum, dawning recognition of threats arising from climate change as well as what seems to be steadily increasing potential scope of those effects is forcing continuing rearrangement of London's anticipated schedule of delivery and physical requirements for flood protection. Experience so far suggests that planned changes are lagging behind the developing climate problem, and may be in a state of flux for years to come.
London is responding in this way because regardless of discussions of motivation or broader geopolitical or commercial concerns they're confronted with an emerging set of facts pertaining to their specific mission. The planners in charge of protecting London cannot afford to mistake noise versus information, can't let themselves be swayed by peripheral chatter, cannot dismiss climate change as a threat by taking the wrong approach to uncertainties. These people correctly are incorporating changing information into their plans and their experience with changing requirements increasingly suggests that they take a pessimistic view of what portends for the future.
As with Samuel Pepys' political bent for stability, planners are taking a conservative approach, are ensuring that London is a rationally predictable place worthy of investment and that it may continue providing long term stability of the kind a nation's capital demands. It's hard to overstate the imperative to get the answer right in this case, “right” meaning to correctly make the best call against odds. Planners working on revising London's flood control have got the fate of an enormous city, their country's physical government and by extension the fundamental health of their entire country in play. The conservative approach to dealing with climate change from London's perspective is to pay close heed to things we today imagine are unlikely.
 Schools At Risk of Flooding (from London Region Flood Risk Appraisal )
In the final analysis, the price of failure in the case of planning London's flood control is astronomical while the price of improving odds for success positively pales in comparison. The cost of overdoing the response is essentially some extra shovel work, as with Pepys' protection of his valuables, nothing in comparison to making a mistake. That's why the wise course chosen by planners is to aim at overdoing the flood control scheme taking into account and going significantly beyond the already less-than-rosy predictions of the IPCC and other expert resources. They are not taking the expedient course of listening to naively optimistic stories about uncertainties making decisions impossible, or being encouraged to focus on the low side of uncertainty. The potential open-ended penalty for incorrectly listening to optimists far outweighs the better quantified, known price of the conservative approach to London flood control.
Instincts of these planners seem to be correct; as time goes by predictions and evidence concerning climate change are producing an increasingly alarming picture for London and similarly situated cities. Sea level change estimates by the IPCC are widely acknowledged to be on the low side. Multiple indicators of this ( Rahmstorf 2007, Rohling 2008 ) are leading designs to shift past 2007 IPCC sea level scenarios.
London flood management planning discussion has also taken note of increasing frequency of Thames Barrier operation, consistent with expectations from climate change. Planners note that while no direct causal connection to climate change is possible this is indeed the general sort of statistical signal we'd expect to see as storm surges increase in frequency and size in keeping with predictions of storm response to climate change. Planners note that taken together with 2007's historically unprecedented summer flooding and other recent extreme precipitation events such as UK flooding in 2002 we have hints that weather events are following climate predictions.
 Thames Barrier Closings (from UK Environment Agency )
It's intriguing to note that the Thames Barrier activation record is the subject of a familiar campaign of doubt. In keeping with so many other observations, some interests would have us believe that determining the motivating factors in any single actuation is impossible but that's wrong; Thames Barrier actuation is a significant event triggered for specific reasons and generating attribution records ( London Flood Strategic Response Plan).
The issue of spinning data raises the matter of politics colliding with the requirements of people responsible for protecting lives and property. At the end of the day ideology and other motivations must comport with facts; engineers and technicians operating cities only have so much latitude to accommodate political abstractions before their job becomes impossible. People in charge of dealing with facts related to life safety and the preservation of investments must ignore talk that does not coincide with the best efforts of researchers.
The necessity to integrate emerging scientific knowledge with our lives and economies has produced a struggle for dominance in the political sphere. Enormous effort and money is being expended on shaping public policy response to climate change and as facts become more clear and the urgency of action increases, so does the frenetic pace of political influence on policymakers, as can be seen in the following illustration.
 U.S. Political Lobbyists Influencing Climate Change Legislation, 2003 vs. 2008 ( from Center for Public Integrity )
This frantic effort to shape the outcome of policy is played out not only in such places as Westminster and Capitol Hill but also in the popular press and other venues where public opinion may be swayed. In accountable democracies public opinion after all has a significant effect on policy so it's not hard to understand why the battle for policy responses to climate change should spill out of the halls of government and into the public eye. Opinion sampling by social scientists using formal research methods can give us some hints as to the effects on public thinking on climate change as the fortunes of the policy war swing back and forth, as may be surmised from examples of scientifically conducted sampling. The following graphic shows how various centers of public thought seem durable even as their exact proportions shift over time.
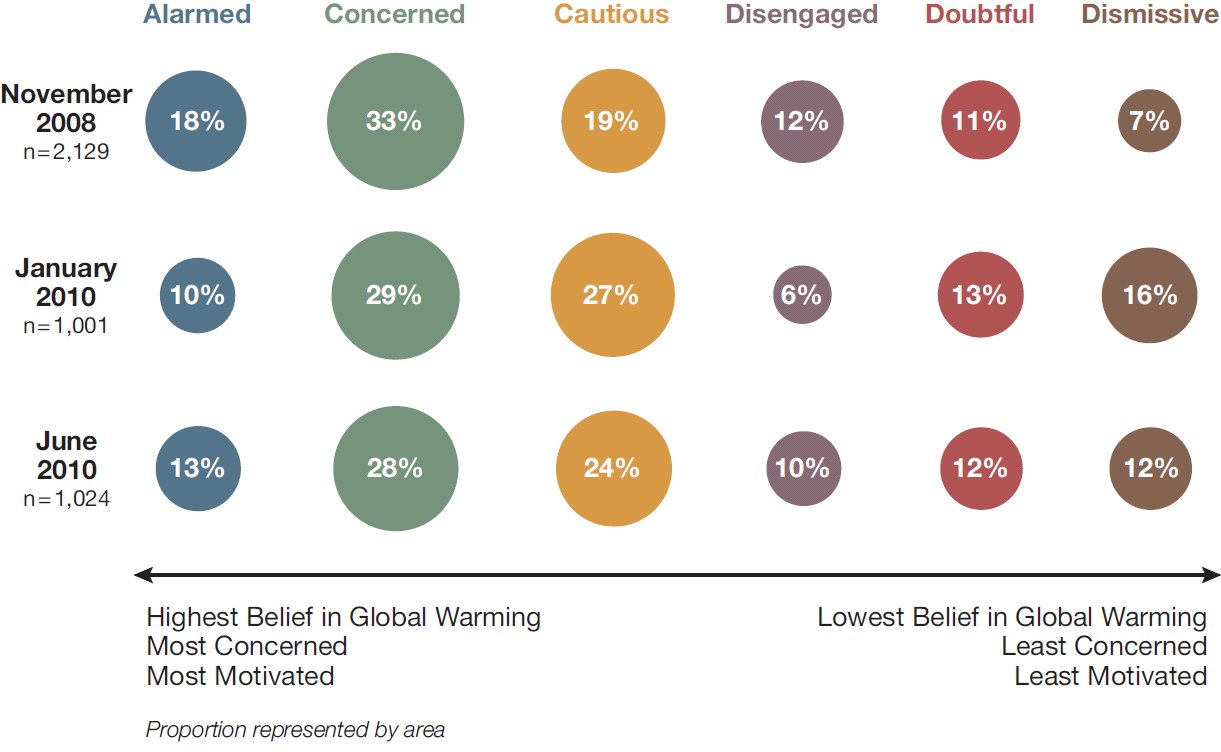
From Global Warming’s Six Americas, June 2010
There are arguably three groups competing for dominance of public policy response to climate change and hence dictating the abilities of technicians to deal with facts. One group emphasizes scientific limitations to the point of complete disbelief or even imagines much of science bent to the purpose of a conspiracy and insists that essentially no changes are needed in our behavior or expectations of our environment, another highlights adaptation and believes we can do "business as usual" while largely weathering or innovating our way around or even enjoying whatever may come of climate change, while yet another believes the present course we're headed on is definitely untenable and will cost us dear in the fairly near future. The former two groups as they manifest themselves in political discourse seem related in some ways; both may fairly be said to harbor suspicions of "big government," increased taxation and the like. The two groups' proclivities coincide with the needs of some major commercial interests. Yet the second group can't rationalize its outlook with that of the first.
People arguing for adaptation as opposed to mitigation implicitly agree with those in favor of mitigation that climate change is a reality so there we find agreement but no common cause. Both groups will however find some concord with those responsible for dealing with disruption caused by climate change.
Arguments as to attribution may remain but for engineers and planners responsible for London attribution is not really relevant, water must be kept out of human space regardless. It's notable that of the thousands of pages of assessment and planning documents associated with future London flood management there is essentially no mention of anthropogenic causes for climate change, naturally so because cause has nothing to do with response when cause is outside of the control of planners. London turns out to have burned because the King's own baker was careless with fire but that did not figure into Pepys' attempts to bring the conflagration under control.
Adaptation may seem like the softer, easier way to deal with climate change but adaptation should not be mistaken as a free pass to ignore climate change, as this example of London shows. Large amounts of money are being spent on adaptation, long-laid plans are being dislocated and London is going to continue expending significant resources on a forced adaptation process for decades to come. The city may well still be at greater risk in 100 years' time than it is today, still distracted with keeping its head above water. Adaptation is after all a gamble depending on optimism; as we can see from London's requirements and plans it is arguable that optimism in the face of tremendous risk is not a truly, usefully conservative characteristic.
There are also limits to adaptation of the style most of us probably imagine. All of the major investigations for planning of future flood control in the Greater London Area speak of a fall-back strategy envisioning making buildings and infrastructures more "resilient" against flooding, describing ways to minimize damage. They do this because it may not be financially or even physically feasible to provide effective flood control in the traditional style. Instead, residents of flood-affected areas may have to tolerate more frequent incursions of water. This is not an optimal outcome.
As described in Tidal Flood Risk in London Under Stabilisation Scenarios, here's how adaptation might play out, leaving us with the concerning word "viability" hanging in the air:
- If the Thames Barrier can be operated, say, 10 times more frequently than it is at present it will be able to resist approximately 0.5m of relative sea level rise (roughly a century of sea level rise) before further modification of the upstream flood defences is required. Beyond that point the upstream walls throughout central London and westwards will have to be raised at roughly the same rate as sea level rise. This represents a significant commitment in the 22nd Century and beyond. Engineers suggest that feasible raising of the walls through central London may be limited to about 2m, in which case under more extreme sea level rise scenarios the limits to protecting London are reached in the 23rd Century. More sophisticated control of the Thames Barrier or a replacement could be used to extend the viability of the capital, and these options will need to be studied in the future.
 Considering Risk for Flood Management (from Pitt Review )
As a final note on adaptation's attractions and the uncertainties lumped in with adaptation, "business as usual" going forward isn't an option regardless of one's attitude to climate change, presuming one's metrics for success include medium to long term political and economic stability. Putting aside quibbles about what swiftly approaching decade will mark the onset of more serious and obvious logistical and geopolitical struggles over fossil fuels, increasing uncertainties over fuel supplies are already on the queue of challenges faced by governments and those responsible for the public welfare, steadily gaining urgency. This is particularly true in the case of liquid and gaseous hydrocarbons which under "BAU" face skyrocketing demand in the face of diminishing sources. Constraining energy costs and risks while promoting stability and prosperity are priorities those in favor of adaptation can't rationalize with procrastination over modernizing energy sources. While it's highly probable that substitution for the remarkable endowment of hydrocarbons we've relied on will be more expensive for some period of time to come, we can place more reliable boundaries on the prices of those substitutes than we can for diminishing supplies of fossil fuels. Creating known boundaries on uncertainty and risk is better than courting open-ended uncertainty and risk.
A better strategy would be to avoid knowingly driving up uncertainty and risk at all or at least sharply constrain them by making and following firm, useful plans for C02 emissions mitigation, the so-far failed cause of the third group of contenders for public policy dominance. Assuming they agree with the basics of radiative physics and at least to some extent with the concept of greenhouse gases as well as some fairly basic rules of economics, those keen on adaptation would do well to committing their lot with this last group, if keeping adaptation costs and risks lower is an important objective. As an example, if London planners were able to count on a future sea-level rise of just 1.3 meters, the current Thames Barrier could have been made to work for another perhaps another 150 years. Instead it will be replaced in a little over 60 years and data suggests the resulting protection level may be inferior to today. Examples of this kind will abound as the climate change scenario unfolds. As the late U.S. Republican Senator Dirksen said, "A billion here, a billion there and pretty soon you're talking real money." Lose a few coastal cities and the quote might be paraphrased substituting trillions for billions.

Probable year of next upgrade of the Thames tidal defences (from Tidal Flood Risk in London Under Stabilisation Scenarios )
Returning once more to the late hero of our story, Samuel Pepys was not only a Member of Parliament and politician, he was also an early member and President of the Royal Society. As well, Pepys was a primordial technocrat, charged with shaping the development of the Royal Navy into what became known as "the scientific Navy," a rational response to a public policy challenge both complex and crucial, intricate but with the future of a nation hinging on the outcome. In light of concerns over models, it's amusing to note that while Pepys had no practical experience of the sea, he educated himself on the construction and operation of ships by the use of models and gained a useful theoretical basis for improving the Royal Navy's fleet. Pepys was a fellow interested in integrating scientific facts into policy and technical solutions to problems confronting government and was in the position to execute his ambitions, he was a one-man example of the continuum emerging in his time between scientific research and technical outcomes of government and public policy.
The world has become too complex for a single person such as Pepys to wear so many important hats. For better of worse, our governments and political systems are not so coherent as they were in Pepys' day. Today it's worth asking, what if the political influence of those in the "it's not happening camp" who unlike Pepys are unprepared to remain in the world of emerging facts should invade and control the world of those those charged with protecting the public from London's flooding? Should unfounded opinions of a political class divorced from science dictate the options of engineers and technicians responsible for dealing with factual reality? Can we afford to let that happen? It's intriguing to note a general pattern with regard to this possibility, a feature that might confuse Pepys. As we move upward through the hierarchy of government, vacillation and hesitation seem to increase. Greater London is responding crisply to emerging facts. In the United States at the national level debate rages about whether the Environmental Protection Agency's decision to treat C02 as an emerging threat despite factual suggestions that it should do so. Globally, at the transnational level of government, paralysis rules the day. Why this is so is a matter of debate but upper governmental echelons might look to their underlings as well as historical figures such as Samuel Pepys for cues to sensible behavior.
Concisely conveying the story of such a long, rich yet bumpy and increasingly fractious relationship as London has had with the Thames is difficult but at least London's is a story with the possibility of a happy ending. Though London's issue with storm surges is notably bad, in many ways the city is far better off than many other major cities situated so near and low to the ocean as to be almost in it. London is a geographically defensible city, London can afford to defend itself, London is armed with a competent civil service rich with technical and administrative talent, and finally motivation to defend London is very strong because London is both the capital of a country and is the home of a stellar array of influential people and businesses, a constellation of Pepys-like influentials. Leaving aside the unfortunate matter of the estuarine funnel attached to the ocean-weather dynamic duo just offshore, London is one of the rosier scenarios for the saving of low-lying cities attached to tidal waters, leaving the question of what we're prepared to accept in worse situations, Does anybody who has driven through the city and witnessed ocean-going ships passing far overhead seriously believe New Orleans is not a lost cause if sea level has increased by 2 meters, or that it can be made as safe as it is today when the ocean has risen by 1 meter?


 0
0  0
0


Comments