Climate Science Glossary

Term Lookup

Enter a term in the search box to find its definition.

Settings

Use the controls in the far right panel to increase or decrease the number of terms automatically displayed (or to completely turn that feature off).

Term Lookup

Settings


All IPCC definitions taken from Climate Change 2007: The Physical Science Basis. Working Group I Contribution to the Fourth Assessment Report of the Intergovernmental Panel on Climate Change, Annex I, Glossary, pp. 941-954. Cambridge University Press.

Home Arguments Software Resources Comments The Consensus Project Translations About Support

Twitter Facebook YouTube Mastodon MeWe

RSS Posts RSS Comments Email Subscribe


Climate's changed before
It's the sun
It's not bad
There is no consensus
It's cooling
Models are unreliable
Temp record is unreliable
Animals and plants can adapt
It hasn't warmed since 1998
Antarctica is gaining ice
View All Arguments...


Username
Password
New? Register here
Forgot your password?

Latest Posts

Archives

Monckton Myth #16: Bizarro World Sea Level

Posted on 14 April 2011 by dana1981

Monckton Myths (200 x 70 pixels)We have a new entry in the contest for most bizarre "skeptic" argument.  The "Science" and Public Policy Institute ("S"PPI) Monthly CO2 Report for January 2011, edited by everyone's favorite "skeptic", Christopher Monckton, contains some astonishing claims pertaining to global sea level rise.

First, on page 12, the document claims "Sea level continues to rise more slowly than the UN predicts."  This is of course the opposite of reality.  Sea level is rising faster than the IPCC predicts (Figure 1).


Figure 1: Sea level change. Tide gauge data are indicated in red and satellite data in blue. The grey band shows the projections of the IPCC Third Assessment report (Allison et al 2009).

On page 29, the "S"PPI document contradicts its previous statement, claiming "Sea level is not rising."  This is of course also false.  In fact, as we recently discussed sea level is not only rising, but the rise is accelerating.  Immediately below this false claim, the document contains the following figure:

Morner sea level delusion

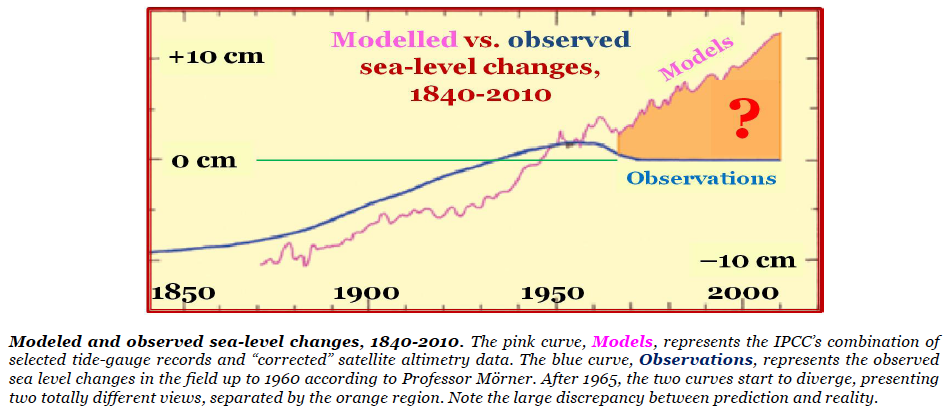
How quickly we went from 'rising slower than predicted' to 'not rising' to 'falling'!  Notice that the caption claims the blue curve is observational sea level data "up to 1960 according to Professor Morner."  Of course, after 1960 (when the "observations" are apparently just made up) is not only when the "observations" supposedly diverge from the models, but also when they diverge from reality!  Ah, but it gets even worse from here.  On page 33, the document presents what may be my favorite figure of all time:

Monckton batshit insane

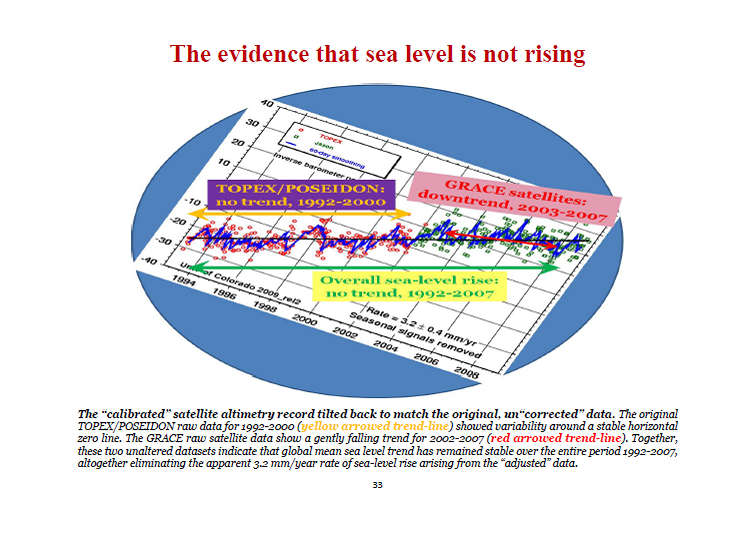
Monckton and "S"PPI have taken the sea level graph from the University of Colorado at Boulder which shows a 3.2 milimeter per year sea level rise trend (as is still visible in the bottom right of the graph), rotated it to make the trend look flat, and claimed that this is what the "unaltered" and "uncorrected" data looks like.

It boggles the mind that Monckton and the "S"PPI think they can convince people that sea level has dropped since 1950 based on nothing more than their own unsubstantiated claims and blatantly doctored graphs which are completely contradicted by the actual observational data.  Monckton has really outdone himself here.  How long will it be before these "skeptics" try to convince us that global warming is over because positive temperature trends signify cooling?

0 0

Printable Version  |  Link to this page

Comments

Prev  1  2  

Comments 51 to 83 out of 83:

  1. Dikran Marsupial, Moderators - Many of the hyperlinks in this post don't work as formatted; they all have www.skepticalscience.com appended at the beginning.
    0 0
    Moderator Response: [Dikran Marsupial] Many thanks, I have fixed them now.
  2. Morner's trick: Taken from the WUWT page recommended by daniel. Can you spot the trick, boys and girls? Note also the use of a stock rhetorical trick: "X was done by unspecified members of group Y". "The Reichstag was burned down by Jews." Pace Godwin and the SkS moderators.
    0 0
  3. Daniel, "But you choose not to. Instead you send me off to read hundreds of pages of scientific analysis." How dare they? What a truly awful thing to do! (/sarc). You remind me of a third year university student you complained that I had given them a reading assignment that required them to visit the library. I kid you not. There is no shame in not having read a bunch of papers, there is shame in refusing to be a true 'skeptic' and making the effort to look at the science with an objective and open mind. Deenis @49 make some good points. The WUWT crowd are charlatans the sooner you realize that the sooner you will begin to learn some proper science and begin to understand the true gravity of this situation down the road.
    0 0
  4. Daniel, Since Global sea level rise has been fairly small so far rocky places like England are not underwater yet. I have visited Funafuti, the capital of Tuvalu. There the sea level has risen about 20 cm in the last 40 years. Since the highest location in the country is only 4.5 meters, and the bulk of the country is 1-2 meters they are very concerned. King tides regularly flood large sections of Funafuti today where it was dry 40 years ago. Will you provide a new home for the people who live in Tuvalu when their country is gone? You have to pick a low place to see the effects today, in the future the sea level is expected to rise faster and it will affect England too. Current forecasts call for 1-2 meters of sea level rise by 2100. London planners say tehy can hold back the Thames up to 2 meters. After that London will flood. Do you care what London looks like in 100 years?
    0 0
  5. daniel maris@47 "Presumably you could sum things up..." "I've never claimed to be able to take part in a peer review of papers in this subject area." "What do I make of the chart? Well I said I am not competent to make sense of it..." Yet you apparently feel confident enough to reject the informed opinions of those who do read the peer reviewed papers (a group I also am not a part of). I am sure DM could sum up the evidence against the Morner photo, but why would you believe him?
    0 0
  6. "It boggles the mind that Monckton and the "S"PPI think they can convince people that sea level has dropped since 1950 based on nothing more than their own unsubstantiated claims and blatantly doctored graphs which are completely contradicted by the actual observational data." That's because you have omitted the explanation. The claim can be checked using PSMSL data.
    0 0
  7. BP@56 Read the caption, it says "The values of NOAA’s 159 tide gauge stations indicate that they range from uplifted areas to subsiding areas". In other words the only justification they have for asserting that the uplifted areas are uplifted and the subsiding areas are subsiding are the tide gauge readings! LOL! So how would you explain that you get a different story if you select tide gauges that are in geologically stable regions (and hence neither uplifted nor subsiding Click on the figure for the details. Using those tide gauges where you can rule out uplift or subsidence, you get an rate of rise very similar to the satelite data, and much higher than the SPPI figure. Yes, I know the figure is from Wikipedia, but the data is from PSMSL, the same as Moncktons, and Wikipedia is certainly no less reliable a source than SPPI. BTW, I also found an answer to Daniel Maris's query about the tide guages on jetties that might be subsiding. Well funnily enough the scientists know that and measure any subsidence with reference to a reference point on land. See here for details. Note the say that post glacial rebound etc. makes things a bit more difficult; however the selection of tideguages in the diagram I gave controls for that, whereas the one used by Monckton obviously doesn't. I'll investigate the PSMSL data for myself when I have a moment to resolve the remaining questions; but given that Monckton has arbitrarily decided that gauges in regions with a value over some arbitrary threshold must be subsiding based on no other evidence, I think I'll view his opinion with some skepticism.
    0 0
  8. Dikran - I think I was referring more to the tendency of objects to sink into muddy harbour bottoms through the impact of their own weight. Up and down the Thames I see lots of buried boats. But that also raises the other issue: silting. All river mouth and harbour areas are subject to silting. Silting of a few cms. might not be noticed. I don't know, but it's another variable which might be of some importance at a river mouth. A tidal gauge is certainly not a scientific instrument.
    0 0
  9. Sea levels revisited: For a more complete picture, we combine results from 2 different sites. First: http://sealevel.colorado.edu/current/sl_noib_ns_global.jpg and then: http://tin­yurl.com/4­xgop85 (courtesy of "Fiction" on HuffPo)
    0 0
    Moderator Response: [Dikran Marsupial] hot linked URLS, there was something wrong with the first one, I hope I have fixed it correctly
  10. daniel maris@58 I told you earlier in the thread that I am not going to discuss things with you any further until you state your position on the Telegraph article. If you are going to ask questions, then it is very rude to completely ignore the answers and ask another one, without any attempt to find out the answer for yourself. Especially if you then respond to an honest attempt to help you find the answer with open suspicion and an accusation of "reverse trolling". as it happens I have already posted a link explaining the solution to the "tendency of objects to sink into muddy harbour bottoms" problem already on this thread but you appear to have missed it.
    0 0
  11. #58: "All river mouth and harbour areas are subject to silting" Really? Do you think that perhaps the people who study these things know that? And how does it change sea level measurement -- which is not measured relative to channel bed elevation? "A tidal gauge is certainly not a scientific instrument." Really? Tell these guys or these guys.
    0 0
  12. Daniel If silt builds up on the bottom near a tide gauge, it does not raise the water level above it. It also does not affect the position of the gauge itself as the silt builds up around the gauge. Siltation is a very different phenomenon from subsidence. It could have large effects on tidal amplitudes, but none on sealevel proper. "A tidal gauge is certainly not a scientific instrument." If used properly, anything that measures something else effectively can be a scientific instrument. That includes thermometers, rulers, and, yes, tide gauges.
    0 0
  13. Dikran and others, You have to remember that, whatever the science, it's taxpayers and consumers who will fund carbon reduction measures and who have to be convinced of their necessity - unless that is you are suggesting we should move from democracy to a kind of Wellsian Scientific Dictatorship. If this is the way you communicate with the non-scientific, then Gawd help us. It seems to me perfectly reasonable for the public to want to see some good evidence that things are changing for the worse and that carbon reduction will address the issue. Michael Sweet - You've visited Tuvalu. You haven't lived there for 40 years. What do you make then of this scientific evidence? - http://mclean.ch/climate/Sea_Level_Tuvalu.htm
    0 0
  14. Daniel @63, Now you are seriously referring us to a web page by McLean? Sorry, yet another source with dubious credibility. He is not much better than the much discredited Monckton in fact. if you are going to try and make compelling arguments please use citations from reputable scientific journals. Daniel, it is OK to say Monckton and Morner got it wrong, that is what a true skeptic would do. And we could then move on to discuss the science in goofd faith. But if you will not recognize the most obvious egregious errors/distortions on their part, then we are wasting our time. And please do not try and advertise yourself as speaking for the majority of lay people or tax payers or the masses, you clearly do not-- that is another 'skeptic' meme that is doing the rounds. Fortunately most people are open minded and do not have ideological or political barriers or have a propensity to entertain fictitious conspiracy theories when interpreting the science. Heck, even the crickets and plants and everything in the ocean blue get it.
    0 0
  15. Can I suggest we ignore Daniel, he has demonstrated he isn't remotely interested in the evidence, and is just another troll. Another argument debunked, no acknowledgement, just move on to the next item on the list... I pointed out earlier in the thread that is the behaviour of a denialist, well it was your choice Daniel.
    0 0
  16. "It seems to me perfectly reasonable for the public to want to see some good evidence that things are changing for the worse and that carbon reduction will address the issue. " That would be IPCC WG1 and WG2. However, what we find is that taxpayer would rather believe in fairies than accept unwelcome news. If you get bad medical news, then getting a second opinion is a good idea. Going to a witch-doctor because he will tell you that's actually okay is not.
    0 0
  17. Albatross wrote : "Now you are seriously referring us to a web page by McLean? Sorry, yet another source with dubious credibility. He is not much better than the much discredited Monckton in fact. if you are going to try and make compelling arguments please use citations from reputable scientific journals. And please do not try and advertise yourself as speaking for the majority of lay people or tax payers or the masses, you clearly do not-- that is another 'skeptic' meme that is doing the rounds" daniel maris is clearly following a favoured scatter-gun tactic of the so-called skeptics and shouldn't be fed. As well as the McLean link and claim to represent the masses that you mention, previous comments have included suppositions about the (desperate) possible effect of silting of rivers; dismissal of the accuracy of tidal guages (presumably because they don't give the results required); claims about the IPCC giving out misinformation, because of Pachauri's involvement over the Himalayan glaciers mistake; links to WUWT and Christopher Booker - those paragons of scientific rigour (ahem); claims about not being convinced about things that he doesn't want to be convinced about; and (also in the posting you referred to) reference to the possible overthrow of democracy and the (very sad, of course) inability of those pesky scientists to get out of their elitist ivory towers and explain themselves properly to the ordinary man and woman in the street - thereby leaving them at the mercy of the denialists (which is, of course, to be regretted...probably). No more feeding needed, I believe.
    0 0
  18. JMurphy, Thanks. Point taken :)
    0 0
  19. Daniel, Please cite scientific papers when posting on this site. A denier eyeballing the data with no numerical analysis does not add up to anything believable. This real scientific paper was cited earlier in the thread, obviously you missed it. Recent satalite data shows greater sea level rise.
    0 0
    Moderator Response: [DB] Fixed URL (missing equals sign).
  20. Daniel, you do realise that sealevel rise is just one of the negatives from rapid warming that concern us? (see global warming, positives and negatives for more). Disruption to water cycle is probably the worst but also the hardest to forecast accurately at regional level. Population growth is a problem for the future too but rapid warming will compound it.
    0 0
  21. Michael, update to Church and White (2011), at Church & White 2011. Data for paper here.
    0 0
  22. Scaddenp, If sea level rise is supposed to track carbon, how do you explain the following: "the most recent rate of rise over these short 16 year windows is at the upper end of a histogram of trends but is not statistically higher than the peaks during the 1940s and 1970s." Surely the amount of carbon is far higher now in the post 2000s with China and other countries' industrial expansion than was the case in the 40s and 70s but we seem to have the same sort of pattern of rises. Why?
    0 0
    Moderator Response: [DB] Let us all observe Dikran's sage advice and refrain from enabling daniel's apparent trolling until he states an unequivocal position on the Telegraph article in question. Daniel's comment above, without any context to the topic of this thread, is off-topic.
  23. "the most recent rate of rise over these short 16 year windows is at the upper end of a histogram of trends but is not statistically higher than the peaks during the 1940s and 1970s." Care to cite your source Mr Maris, or is that too much to ask of you?
    0 0
  24. Marcus - Sorry - that was a quote from the Church and White Paper (2011) cited by Scaddenp. It doesn't seem to accord with the impression given by various posters here of an inexorable increase in the rate of sea level rise ending in catastrophic inundations. However, I think you've been instructed by DB not to engage with me on this, so be careful.
    0 0
    Response:

    [DB] Church and White 2011 make no attempt to project future SLR trends; you'd know this if you'd have read it.  A look at their trends:

    C&W 2011 Trends

    And the overall trends in global MSL:

    C&W SLR 1860-2009

    The overall trend is greater than linear; in order to hit the expected rise of 0.8 to 1.2 (or more) meters rise by 2100, the trend will also have to continue to increase in greater-than-linear fashion.  This will have great implications for various countries around the world, something the "various posters" here have tried to convey.  Why? A non-linear increase in trend won't stop on a dime...

  25. Umm, the amount of carbon is greater and sealevel is higher. The RATE of change is another story. The closest thing you can get to prediction of rate from climate response that I know of is Vermeer and Rahmstorf. Nothing unexpected here. Your use of 'catastrophic' has no meaning without definition. Perhaps a better way to approach the problem is to ask what predictions from WG2 do think is not going happen with respect to sea level rise?
    0 0
  26. Denial Maris is still just trolling, however it is good to see he has looked at a scientific paper, if not actually read it, at least he has scanned it for comments he can use out of context. This does show one of the difficulties scientists will face communicating with the general public, namely the issue of statistical significance. Very few in the general public really understand it, Daniel certainly doesn't. The increase in the rate of sea level rise that you might get from a model based calculation is going to be very small, compared with the uncertainty in the observations (see the figure). At this point, even if you were exactly correct, you would not expect the increase in rate to be statistically significant. The scientists will almost always test for statistical significance anyway and honesty report the outcome. This makes it very easy for denialists to make a hyperbolic claim as Daniel just did, that ignores that point. For another example, see the dishonest reporting of Prof. Jones' comment about statistical significance, he was honest and straightforward, and completely misrepresented by the skeptic blogs and media. I suggest we just ignore him, at least until he can demonstrate that he is not simply a denialist troll, but going back and acknowledging (including a clear statement of his position) the answers given you the previous questions he has posed.
    0 0
  27. "Catastrophic" is a crucial word here. No one I think is denying that - since the last ice age - sea level has risen substantially, whatever has happened in the last 100 years. So, it would not be surprising if sea level has risen in the last 100 years and continues to do so for the next 100. The issue is whether the rise will be something humanity manages with ease, as it has done all the previous millennia of sea level rise or whether this is something out of the ordinary - what I would call "catastrophic". I think you can call the Japanese Tsunami "catastrophic" because human society finds it difficult to cope with its impact. I think sea level rises of 20-40cms per century - which seems to be the scientific consensus - are completely manageable for 99% of humanity.
    0 0
    Moderator Response: [Dikran Marsupial] I suggest not feeding the troll, at least not until he is willing to properly revisit the answers to the previous questions he has raised, starting with the Telegraph article.
  28. Dikran - You and others here have a very odd view of science. ( -Snip- ). Perfectly reasonable questions about the impact of the sea level rise are dismissed as unscientific, when they patently are not. I suggest people take a look at this page from the UK's National Oceanography Centre - http://www.pol.ac.uk/home/q_and_a/#5 ( -Snip- ). ( -Snip- ). ( -Snip- ).
    0 0
    Moderator Response: [DB] More trolling (snipped); DNFTT. [Dikran Marsupial] Do follow the link to the U.K.'s National Oceanography Centre.
  29. Apologies for the slight OT comment: Might I suggest that the graph in Figure 1 and perhaps also the graph in the moderator reply to daniel maris be added to to the Climate Graphics resource page here at SkS?
    0 0
    Moderator Response: [DB] Thanks, but John's time is needed to create the HQ versions placed there; I can mention it to him, but in the meantime feel free to bookmark those graphics (I provided placeholders to the SkS locations of the files).
  30. By way of informing other readers. The "consensus value" of 20-40cm is no. from IPCC AR4. Hard to believe that there are people who dont know the caveats associated with those no.s but to quote IPCC: " Models used to date do not include uncertainties in climate-carbon cycle feedback nor do they include the full effects of changes in ice sheet flow, because a basis in published literature is lacking. The projections include a contribution due to increased ice flow from Greenland and Antarctica at the rates observed for 1993-2003, but these flow rates could increase or decrease in the future. For example, if this contribution were to grow linearly with global average temperature change, the upper ranges of sea level rise for SRES scenarios shown in Table SPM-3 would increase by 0.1 m to 0.2 m. Larger values cannot be excluded, but understanding of these effects is too limited to assess their likelihood or provide a best estimate or an upper bound for sea level rise. {10.6}" In short, the no.s only include what could be estimated reliably at time of AR4 deadline. Things havent improved that markedly since then in terms of understanding non-linear ice sheet response but the no.s are clearly lower bound. The Vermeer and Rahmsdorf sem-empirical estimate (80-190cm per 100y) is the best no. published since then and would represent current consensus.
    0 0
  31. "I think sea level rises of 20-40cms per century - which seems to be the scientific consensus - are completely manageable for 99% of humanity." Oh, well if that's what Daniel thinks-without a shred of evidence to back his opinion-then we can *all* stop worrying ourselves about the myriad dangers of Climate Change. Phew, that's a relief [/end sarcasm]. Of course, even if Daniel Maris were correct in his *beliefs*, I wonder what the cost of managing sea-level rises would be compared to....oh, I don't know, significantly cutting down on our wasteful consumption of fossil fuels? .....and still he fails to tell us, in plain simple language, his position on the Telegraph Article. Still, I've never known denialists to big on admitting the many errors of their fellow denialists.
    0 0
  32. I'm still kind of reeling. http://cheezburger.com/View/4725366272
    0 0
  33. There appears to be no end to the hilarity that can be drawn from Morner's recent work. This quote from his 2004 paper Estimating future sea level changes from past records is brilliant: 'IPCC launched their hypothesis of a disastrous flooding of coastal low-lands and low islands (like the Maldives) in the next century (e.g. Hoffman et al., 1983).' That's right, his example of the IPCC (founded in 1988) hypothesis of disastrous flooding is a paper from 1983. The 'modelled vs observed' graph is actually appears to be a comparison between Church & White 2006 and a multi-source record described in Morner 2004. The Church & White data can reasonably be termed 'model data' since they use a model to infer global sea level change from coastal tide gauge data back to 1870. However, in no way could this be termed a 'prediction', as suggested in the legend. How Morner arrives at the 'observations' plot is interesting. The data from 1840 to 1960 is quite reasonably a mean of tide gauges, giving a fairly standard average SLR of ~1.2mm/yr over the whole period. Then things get weird. He states 'During the 1970s and 1980s, our data are not really clear enough for a proper evaluation of any general trend in sea level.' How this could be isn't explained but, undeterred, he moves right on to the satellite era (~1990 to present) which he determines shows no trend, contradicting everyone else in the world with no explanation. Note on the graph that there is also no trend from about 1960 to 1990. How was this determined given the documented sudden loss of data during the 70s and 80s? Well, his only reference that includes this period is to calculated contributions to sea level change over 1910-1990 from various sources, as documented in IPCC TAR 2001. He cites the figure 0.9mm/yr though it's unclear from where because the central value given by the IPCC is actually 0.7mm/yr (Link). So the curve after 1960 is an attempt at reconciling the long-term 1.2mm/yr trend with the IPCC 0.9mm/yr (0.7mm/yr) figure to 1990. And I think he massively overdoes the 'correction' too. No matter though, the great thing about this is that the IPCC figure is largely derived from modelling studies. So the point at which the 'models' and 'observations' diverge is the point at which the 'observations' become 'models'.
    0 0

Prev  1  2  

You need to be logged in to post a comment. Login via the left margin or if you're new, register here.


The Consensus Project Website

THE ESCALATOR

(free to republish)


© Copyright 2024 John Cook
Home | Translations | About Us | Privacy | Contact Us