Climate Science Glossary

Term Lookup

Enter a term in the search box to find its definition.

Settings

Use the controls in the far right panel to increase or decrease the number of terms automatically displayed (or to completely turn that feature off).

Term Lookup

Settings


All IPCC definitions taken from Climate Change 2007: The Physical Science Basis. Working Group I Contribution to the Fourth Assessment Report of the Intergovernmental Panel on Climate Change, Annex I, Glossary, pp. 941-954. Cambridge University Press.

Home Arguments Software Resources Comments The Consensus Project Translations About Support

Twitter Facebook YouTube Mastodon MeWe

RSS Posts RSS Comments Email Subscribe


Climate's changed before
It's the sun
It's not bad
There is no consensus
It's cooling
Models are unreliable
Temp record is unreliable
Animals and plants can adapt
It hasn't warmed since 1998
Antarctica is gaining ice
View All Arguments...


Username
Password
New? Register here
Forgot your password?

Latest Posts

Archives

Nuccitelli et al. (2012) Show that Global Warming Continues

Posted on 12 October 2012 by dana1981, robert way, Rob Painting, John Cook

We are very pleased to report on a new paper in press at Physics Letters A (PLA) by the Skeptical Science team and oceanography expert John Church.  In typical SkS international coordination style, the paper's authors included an American (Dana Nuccitelli), a Canadian (Robert Way), a New Zealander (Rob Painting), and two Australians (John Cook and John Church).

The paper is a Comment on another paper, Douglass & Knox 2012 (DK12).  We originally began examining this paper in a blog post which can be viewed here.  DK12 used ocean heat content (OHC) data for the upper 700 meters of oceans to draw three main conclusions: 1) that the rate of OHC increase has slowed in recent years (the very short timeframe of 2002 to 2008), 2) that this is evidence for periods of 'climate shifts', and 3) that the recent OHC data indicate that the net climate feedback is negative, which would mean that  climate sensitivity (the total amount of global warming in response to a doubling of atmospheric CO2 levels, including feedbacks) is low.

Our original draft blog post noted that DK12 had effectively been "pre-bunked," as several recent studies have reconciled global heat content data with top of the atmosphere (TOA) energy imbalance measurements with no evidence of a long-term slowdown in global warming.  Several recent studies have also concluded that it is necessary to include data from the deep ocean in order to reconcile global heat content and the TOA energy imbalance, which DK12 failed to do.  Ultimately we decided that it was worth writing up our findings and submitting them to PLA as a comment on DK12.

We used pentadal (5-year average) OHC data to a depth of 2,000 metres from Levitus et al. (2012), and land, atmosphere, and ice (LAI) heating data from Church et al. (2011).  Our results are shown in Figure 1.

Fig 1

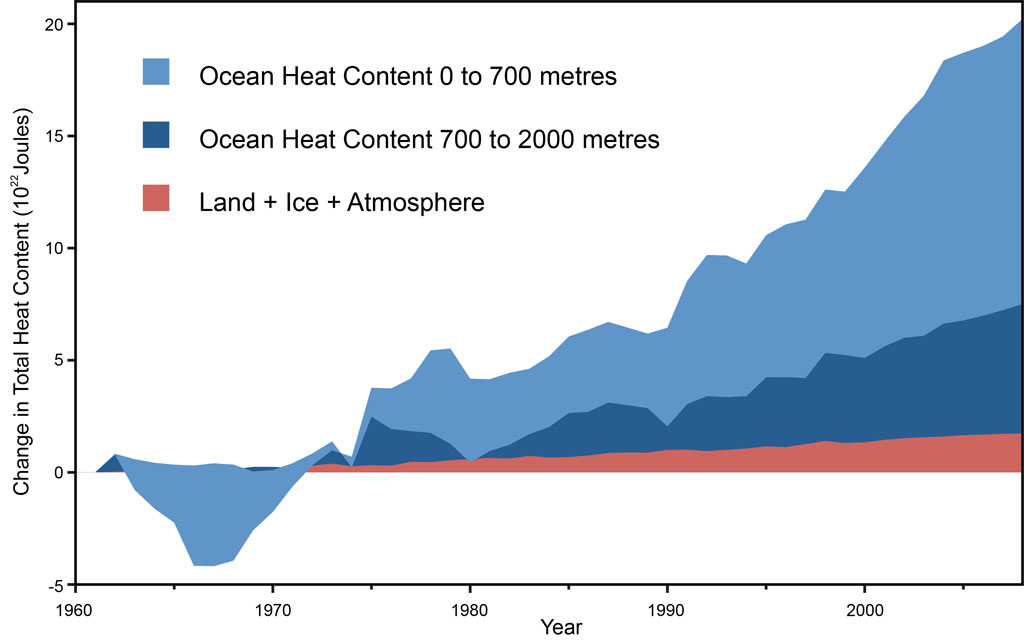
Figure 1: Land, atmosphere, and ice heating (red), 0-700 meter OHC increase (light blue), 700-2,000 meter OHC increase (dark blue).  From Nuccitelli et al. (2012), and added to the SkS Climate Graphics Page.

As this figure shows, there has been no significant slowing in global heat content.  We quantify this result in Table 1.

Table 1: Global Flux Imbalance During Selected Periods.  From Nuccitelli et al. (2012).

Time Period

0-700 meter OHC (W/m2)

700-2,000 meter OHC (W/m2)

LAI Heating (W/m2)

Net Heat Content Increase (W/m2)

1970-2008

0.21 ± 0.063

0.082 ± 0.030

0.025 ± 0.0012

0.31 ± 0.078

1980-2008

0.23 ± 0.062

0.12 ± 0.017

0.027 ± 0.0019

0.37 ± 0.068

1990-2008

0.29 ± 0.082

0.14 ± 0.11

0.030 ± 0.0031

0.46 ± 0.063

2000-2008

0.35 ± 0.13

0.15 ± 0.020

0.029 ± 0.0068

0.53 ± 0.11

2002-2008

0.44 ± 0.17

0.26 ± 0.039

0.036 ± 0.0044

0.73 ± 0.16

In fact the rate of net global heat content increase has risen.  The data also show that failing to account for increases in deep OHC is a problematic omission.

"We find that the OHC increase for the 700-2000 meter layer neglected by DK12 accounts for approximately 30% of the 0-2000 meter increase in recent decades."

Mistaken Analysis Begets Mistaken Conclusions

Thus the DK12 conclusion that ocean heating slowed from 2002 to 2008 was a result of cherrypicking both a short timeframe and only part of the global heat content data.  As a result of cherrypicking noisy short-term data, DK12 argued that the apparent slowing in the rate of OHC increase was a result of a 'climate shift' in 2002.  However, our Figure 1 and Table 1 illustrate that the long-term global heat content trend has risen at a steady, increasing rate over the past 4 decades.

DK12 compounded their erroneous analysis by attempting to calculate the net climate feedback based solely on their estimated 2002-2008 OHC increase for the uppermost 700 meters, and only considering the CO2 and solar radiative forcings, ignoring the significant aerosol forcing, for example.  As Nuccitelli et al. (2012) discusses, this attempted analysis is problematic for several reasons.

"A key conclusion in DK12, that the net CO2 feedback is negative, is also based exclusively on an analysis of data during one of their proposed ‘climate shift’ periods (2002-2008) with a negative flux imbalance.  However, this conclusion does not hold during the ‘climate shift’ periods with a larger positive flux imbalance, and thus the conclusion is not robust.  Additionally, accounting for the heating of the oceans from 700 to 2,000 meters and LAI nullifies the DK12 conclusion even during the 2002-2008 timeframe.  The CO2 feedback is effectively a constant value, and thus should not be calculated using such a short timeframe when data over a longer period are available.  The DK12 feedback calculation is invalidated by focusing on noisy short-term data and failing to account for all radiative forcings at work, as well as all heat reservoirs, in particular the oceans below 700 meters."

Nuccitelli et al. Show that Global Warming Continues

Ultimately our paper shows that all three of the main conclusions in DK12 are faulty: the rate of OHC increase has not slowed in recent years, there is no evidence for 'climate shifts' in global heat content data, and the recent OHC data do not support the conclusion that the net climate feedback is negative or that climate sensitivity is low.  Over 90% of global warming accumulates in the oceans, and there is no indication that it has slowed.

I would like to conclude by once again thanking my co-authors for their work in successfully completing this paper.  We at SkS appreciate that John Church was willing to join our team, that his colleague Neal White was willing to provide us with their global heat content data set, and that their colleague and fellow oceanography expert Catia Domingues was willing to review our paper and provide valuable feedback to improve the paper.

1 0

Printable Version  |  Link to this page

Comments

1  2  Next

Comments 1 to 50 out of 70:

  1. I saw this via twitter, and wanted to say congratulations there, but figured it would appear here where I could say it. So "Congratulations!" for getting published and for the work itself. Very nicely done indeed. Hope you all are still flying high on this.
    0 0
  2. Congratulations to the authors! This is not going to be the first peer-reviewed paper that the SkS team produces... It is going to be interesting to see what excuses the fake skeptics are going to contrive to try and dismiss or downplay this solid refutation of DK12. It would not surprise me if at the same time, the fake skeptics fail to recognize or cede the serious problems with DK12 that undermine its entire premise.
    0 0
    Response: [JC] "This is not going to be the first peer-reviewed paper that the SkS team produces"

    Well, it is the first. Whether it's the last peer-reviewed paper that SkS produces is another matter :-)
  3. Hey, what's up with you people? You didn't trumpet it. You didn't wind up the press. You didn't get your minions to start babbling questionable assumptions. You let actual working climate scientists get involved. What's up with that? Congrats, all. Not surprising, so I won't add any exclamation marks.
    0 0
  4. Excellent work as always, Dana! You rock!!
    0 0
  5. A milestone if ever there was one. Congratulations! Now keep 'em coming.
    0 0
  6. Well done indeed, team!
    0 0
  7. You have worked so hard on this. Very well done.
    0 0
  8. Could you just explain the zero level on the axis? Heat content can be neither zero or negative so I assume there's a false origin - which makes it appear as if HC has doubled since 1995. cheers jonathan
    0 0
  9. #8 DrYew, the caption explains that it is OHC increase. I agree that the y axis label could be labelled 'heat content change' to make it clearer.
    0 0
  10. Congratulations! Would any of the testing be at location(s) where ocean circulations would be indicated or is deep water too shallow?
    0 0
  11. Yes, congrats on a great article. I'm always trying to find ways to express scientific info to a more general public. Wiki shows the energy released from the Hiroshima bomb to have been ~6 x 10^13 joules. Adding the figures for heat increase in the top 700 meters and from 700-200 meters gets me, eyeballing it, about 25 x 10^22 joules. So can I tell students and others that the amount of heat GW has added to the top ~2000 meters of ocean is roughly equivalent to 4 billion Hiroshima bombs? (And this all since ~1972!?) Please check my maths and other assumptions. Do we have updates on the OHC levels since 2008? Thanks ahead of time for any corrections/pointers...
    0 0
    Moderator Response: [DB] Glenn shows in this post that the amount added from 1961-2011 (133 Terawatts) is equivalent to 2 Hiroshima bombs a second. Continually since 1961.
  12. T'will be interesting to see how Wattsy spins this one: kinda amazed he hasn't yet, at least as of this morning (10/11/12). congrats to all for hard work, diligence, and the wherewithal to keep up this good and important work.
    0 0
  13. Congratulations on the paper. I suspect Watts will merely ignore the paper unless forced to acknowledge it's existence, and if forced to address it, he'll dismiss it out of hand with an ad hominem and a link back to some other previous post that attacks Skeptical Science.
    0 0
  14. Congratulations to the SkS team!
    0 0
  15. I'm afraid I have to agree with Noesis; Watts will very likely be unable to find any fault in the paper itself (excellent work, it should be noted), and as such will perpetuate something along the lines of SkS being an outlet of the League of Evil Scientists. It's a pity that in the absence of a legitamite rebuttal, attacks on character are called upon instead. I am curious though, I often see heat content changes expressed in matters of W/m2, but I am not familiar with how the conversion is done save from Btu. How exactly does one convert Joules to W/m2 for instance?
    0 0
  16. #9 MarkR - thanks, see it now...
    0 0
  17. DMCarey @15 - to convert from J to W/m2 you first get the change in energy over time (i.e. Joules per year converted to Joules per second = Watts), then divide by the surface area of the Earth to get W/m2. There's a formula in the paper (click the Nuccitelli et al. 2012 links in the above post for a free copy). Ftoa = 0.62[d(OHC)/dt] Where OHC is in Joules per year and Ftoa (top of the atmosphere flux) is in W/m2. Converting years to seconds and dividing by the Earth's surface area yields a convenient factor of 0.62.
    0 0
  18. "SkS being an outlet of the League of Evil Scientists." Wha??? Where's my sticker, then?...;) I tend to think yours, and others, opinions are correct. If (snort..."if"...) Watts resorts to that, I see it as just more rhetorical rope with which to hang himself. I do 'sense a disturbance' in the (bloggers') Force that suggests the tide is truly turning towards science. It might be wishful thinking, however...
    0 0
  19. Dana@17, That number (Ftoa = 0.62Wm-2) coincides with the best estimate of the TOA radiative imbalance (I remember Jim Hansen said it was 0.5Wm-2). Looks like those numbers mean the same, at least to me. Can it be considered some confirmation, that TOA flux calculated from OHC changes (by large the main heat sink on the planet) and from radiative imbalance fall into the same ballpark?
    0 0
  20. chriskoz @19 - 0.62 is just the conversion factor between J/yr and W/m2. For the radiative imbalance see Table 1 in the paper and post. Our results are in the same ballpark as Hansen and a number of previous radiative imbalance studies. In the ballpark of 0.5 W/m2, depending on exactly what timeframe is considered.
    0 0
  21. Is there somewhere a pre-published version of the paper? (most physics papers are pre-published in Arxiv)
    0 0
  22. From Peru @21 - a pre-published version is linked in the post where it says Nuccitelli et al. (2012).
    0 0
  23. Congrats on the publication! Good to see that the SkS team not keeps up with the science but even adds to it.
    0 0
  24. Probably a silly question, but one I have all the same. According to GISSTemp there hasn't been much movement either way in global surface temps (basically flat since 2003). We also know that from 2005-2010 we saw the deepest solar minimum in satellite records. My question: what can cause the oceans to keep warming (as shown in the 2002-2008 line in the table in the article) when the accumulated heat sources decreased? Source: http://data.giss.nasa.gov/gistemp/2011/
    0 0
  25. Dale @24 - it's a matter of more heat being shifted to the deeper oceans during 'hiatus decades'. See this post by Rob Painting on the subject.
    0 0
  26. Thanks Dana.
    0 0
  27. Congratulations, Dana Nuccitelli, Robert Way, Rob Painting, John Cook and last but certainly not least John Church, You folks continue to impress and educate. Dana's quick reply to Dale's (@24) question was welcome since, as they say, it was "an excellent question" and I'd been chewing on it hoping you would reply. The reminder of Rob's "The Deep Ocean Warms When Global Surface Temperatures Stall" and the further links at the bottom of that post were great. Rob's "Ocean Cooling Corrected, Again" - "Ocean Cooling Corrected, Again" - "Ocean Heat Content And The Importance Of The Deep Ocean" (happened to have reread that one a couple days ago) Ari's "Deep ocean warming solves the sea level puzzle" Doug's "Billions of Blow Dryers: Some Missing Heat Returns to Haunt Us" Are all cued up and ready for a rereading, but I wanted to stop back in again and say thanks for getting all this important information out there. Considering the steady degeneration of the contrarian-skeptic's dialogue into infantile rantings and emotionalizing (see the SkepticForum for examples) - you must be having a positive impact. Keep it up. By the way Daniel B. thanks for that link to "Global ocean currents 1994-2002" at http://www.youtube.com/watch?v=5tRiZG-yR24&NR=1 I hadn't seen that video before, beautiful and awesome !
    0 0
  28. I further elaborate the response to Dale@24. Dale asks:
    What can cause the oceans to keep warming (as shown in the 2002-2008 line in the table in the article) when the accumulated heat sources decreased? Presumably, because we had the deepest solar minimum (as shown in http://data.giss.nasa.gov/gistemp/2011/) at that time.
    Note that solar energy is not the only heat source. it'd variations (shown as TSI changes on the quoted page) resulted in some -0.23Wm-2 radiative forcing from 2000 on. The other heat sources (or more precisely radiative forcings): GHG, land use, albedo from aerosols, did not change much or slightly increased (CO2). As I said above, the total radiative imbalance from all sources is estimated to be 0.5Wm-2, so the drop in TSI did not result negative forcing: the earth as a whole was still gathering heat in the last decade. The strong hiatus (LaNina) esp in the end of last decade, resulted in the larger than average radiative imbalance in the last row on Table1. And that makes sense, because that table is a measure of heat imbalance. The more heat goes into ocean, the more radiative imbalance we have because the surface temperature (not the deep ocean) must rise to allow GHG to dissipate the enegry into space. You can also see from the last row of Table1, that hiatus has largest influence on planetary energy shifts than TSI variations. Again, makes sense and confirmed by others.
    0 0
  29. chriskoz - A small point of disagreement, at least in emphasis. Solar energy is the only significant heat source, as anything else (geothermal energy, waste heat from our industrial use) is 2 or 3 orders of magnitude smaller. Changes in solar energy, on the other hand, are tiny - an order of magnitude smaller than anthropogenic greenhouse forcing changes over the last 150 years. Therefore when attributing causes of global warming over that period, solar changes simply are not in the ballpark for consideration. Dale - As dana1981 pointed out, the oceans (representing ~93% of the thermal mass of the climate) have continued to warm over the period you mentioned. The atmosphere represents only ~2.3% of the climate thermal mass, and any variations in the efficiency of which the oceans absorb energy will show much larger temperature variations in the atmosphere. There certainly have been variations in radiative imbalance over the last decade - ENSO, aerosol loads, etc. - but given that ocean heat content (OHC) continues to rise, even those are fairly small change regarding ongoing climate trends. To quote Galileo, or at least something attributed to him: "Eppur si muove" - And yet it moves. Global atmospheric temperatures represent but 1/40 of the climate energy, albeit a portion we pay considerable attention to.
    0 0
  30. The problem is there is no mechanism for greenhouse gasses to warm the oceans. Oceans can warm the atmosphere, but the atmosphere has not been warming. One can argue that a warmer atmosphere would reduce radiative cooling of the oceans, but this would be proportional, and the graph shows ocean warming way out of proportion to the atmosphere. Granting Levitus for the sake of argument,this appears a lagging ocean effect of whatever caused the unusual atmospheric warming between the seventies and the millenium.
    0 0
    Moderator Response:

    [DB] Ah, no. You must've missed this post then: How Increasing Carbon Dioxide Heats The Ocean

    Which is odd, considering that you placed comments on it here and here. Please do try to be more internally consistent.

    Continued belief in mystical cycles and "lags" lacking physical mechanisms while disregarding and ignoring actual physical mechanisms (that unusual warming effect is largely the increases in CO2 while other forcings were neutral/negative) is simply practicing climastrology.

  31. Further to Dale's post at #24:
    ...there hasn't been much movement either way in global surface temps (basically flat since 2003)...
    ignores the fact that 9 years is far too short an interval in which to distinguish signal from noise, even when there is underlying warming occurring. This point has been raised so many times before that raising it again deserves a hundred bucks in the naughty jar. Others have already addressed the relative sinking of heat energy into the oceans versus the atmosphere but it's probably worth repeating that it's entirely possible to have overall heating of the planet even when solar irradiance is constant, if the usual exist of thermal energy is restricted as happens with the increasing concentration of 'greenhouse' gases, and especially when taking into consideration the fact that it takes decades for equilibrium to be reached in the context of historic carbon emissions, no matter small variations in TSI. I'm surprised that anyone who's read SkS for more than a week is surprised by this.
    0 0
  32. I don’t know who trunkmonkey is , but here you can found perhaps one of the most extreme bloggers in the ”climate skeptical” community. In the link there an agrresive attack against Kevin Trenberth, who is called among other things a “hardcore Stalinist” and a then insulted in a way that is so offensive that I cannot quote it without being snipped (read the blog post if your stomach is strong enough). What is more shocking is that this blogger, Lubos Motl, is a superstring theory quantum physicist(perhaps the most advanced area in the physics community), yet he cannot understand the elementary thermodynamics of planetary climate. I suspect that the explanation for the paradox of having people that are scientifically educated yet deny the evidence is ideology, since he believes that the climate consensus is a a “worldwide communist conspiracy” against capitalism and the free market. Maybe he had a trauma with the Stalinist regime decades ago, because he is Czech. What is more sad is that he is not alone in his beliefs. Czech Republic president Václav Klaus believes in this , and had even said things like calling environmentalists "the biggest threat to freedom, democracy, market economy and prosperity" and even "Environmentalism should belong in the social sciences" along with other "isms" such as communism, feminism, and liberalism”. Not to mention some sectors of the US Republican Party... I have two questions: 1) How widespread are in the physics community this kind of ideas? I used to believe the physics community one of the more liberal and progressive among the scientific community 2) Maybe this skeptical science team paper could be used at Lubos Motl blog to show how wrong he is about the Kevin Trenberth’s “missing heat”(I think a paper will have a zero effect on himself, but maybe it could wake up true skepticism among his readers)
    0 0
  33. Dale - "My question: what can cause the oceans to keep warming (as shown in the 2002-2008 line in the table in the article) when the accumulated heat sources decreased? See the SkS post linked to at #30 by the moderator Dan Bailey. Most readers seem to be able understand that greenhouse gases slow the loss of heat from the atmosphere - well they slow the loss of heat from the ocean too. Given that solar radiation has undergone a decline since the 1960's, I'm genuinely interested if you have ever thought about how the oceans have continued to warm throughout this interval, despite this fall in solar output? There are other considerations, of course, but the greenhouse gas-induced warming of the ocean is the Big Kahuna of global warming.
    0 0
  34. From Peru@32, I don't know the statistics, but I guess the examples of extremely rude, offensive, swearing language you are pointing to, would be extremely rare. Lubos Motl, by the very nature of his language, is so repulsive that no one should take him seriously, so his readership is likely marginal. As Mike Mann once said, rebutting the talk at that kind of level is like: "Stepping into the mudhole to wrestle pigs. Pigs would love you to start wrestling but you cannot afford to waste your energy doing it". And I agree. Posting Nuccitelli et al. (2012) paper over there does not make sense to me. Better leave the pigs alone, do not create illusion in their minds that someone seriously listen to them. I agree it's worth talking to people like president Václav Klaus, but that must go through some different channels, not through Lubos' blog.
    0 0
  35. @DB My prior comments about the "skin layer" are consistent with the comment above.Warming the top angstrom of the layer would decrease the efficiency of conduction from below, but it would increase the radiative efficiency at the surface.
    0 0
  36. Trunkmonkey, In your previous comment on this thread you said "The problem is there is no mechanism for greenhouse gasses to warm the oceans". In the comments DB linked you discussed the mechanism. I will summarize for you: The ocean absorbs energy from the sun and is warmer than the air. Energy is transferred from the ocean to the cold air. AGW warms the air. Less energy is transferred from the ocean to the warmer air. The ocean warms since it retains more energy. If you wish to argue the mechanism is incorrect this is the wrong thread to post to. Claiming the mechanism does not exist when you know it does is not making an argument in good faith.
    0 0
  37. I really enjoyed your post. I really liked how you put in graphs and pictures and helped explain them really well after you talked about them. I really liked all the points you made
    0 0
  38. I'm very sorry about that I accidentally commented that but back to the point. I really liked the points you made and how you got to several different ideas in just one post and went into deep ideas about all of them. All in all I really liked you post, thank you for the time you put into it.
    0 0
  39. Trunkmonkey. You say that "there is no mechanism for greenhouse gasses to warm the oceans". Have you ever waded into a shallow lagoon or lake early on a summer morning, and then again in the mid afternoon? If so, did you observe a difference? If so, what caused that difference? And if there was a cause for that difference, can you infer how the actions of 'greenhouse' gases might replicate that effect?
    0 0
  40. Thanks GrantA0017, and thanks to everyone who congratulated us on the paper, which we're very excited about.
    0 0
  41. Michael Sweet, I acknowledge that a warmer atmosphere recieves less radiation from the ocean but argue that resulting ocean warming should be proportional to atmospheric warming. Bernard J., The warming you discuss is from UV which cannot come from greenhouse gasses.
    0 0
    Moderator Response: Now you are solidly in the domain of a different post: How Increasing Carbon Dioxide Heats the Ocean. Put further comments on this topic there, not here. Everyone else, respond there, not here. Off topic comments here will be deleted without warning.
  42. Bernard J @31 Please read the link I supplied above. Hanson explains the slowdown in global warming (according to the graphs) is illusory due to the negative masking of successive La Ninas and the lowest solar minimum in the satellite record. So if you want $100 for your naughty jar, I ain't paying till Hanson does.
    0 0
  43. Dale, without being pedantic, the name is Hansen, with an e. I'm sure you can verify that in the paper you cite.
    0 0
  44. hope I'm not being too far off topic here but UCTV's "Perspectives on Ocean Science" has an excellent recent lecture regard the gathering of ocean temperature measurements. 135 Years of Global Ocean Warming "... Dean Roemmich, Scripps physical oceanographer and study co-author, as he describes how warm our oceans are getting, where all that heat is going, and how this knowledge will help scientists better understand the earth's climate. Learn how scientists measured ocean temperature during the historic voyage of the HMS Challenger (1872-76) and how today's network of ocean-probing robots is changing the way scientists study the seas. (#23999) "
    0 0
  45. #44 citizenschallenge

    Your link:

      135 years of Global Ocean Warming

    Excellent talk, I was disappointed that there was no mention of the corrections Josh Willis made to ARGO in 2008.

    0 0
  46. Moderator @11: Terawatt is a rate, not an amount of energy. Do you mean terawatt-hours?
    0 0
  47. amhartley DB's language was slightly confusing. The rate over the last 1/2 century is around 133 Terawatt's or 2 Hiroshima Bombs per second. This is the 50 year average. As the graph from DK12 above shows,the first decade of this saw roughly zero net change so actually the rate is slightly higher. The total amount of heat is around 2.1*10^23 Joules or nearly 60,000,000 TeraWatt Hours. One point I make in that older post is that this much heat cannot have come from anywhere here on Earth. The largest source of heat here on Earth is Geothermal heat and this heat source is only around 1/4 of what is needed to be the source of this extra heat. This leaves only one possible source for the heat - something altering the Earth's energy balance with space. Since we know the Sun hasn't been getting warmer over the last 1/2 century so it isn't more heat getting in, that only leaves something that is prevent energy from getting back out. No prizes for guessing what that is.
    0 0
  48. Dear Mr. Nuccitelli As I understand it, the Table 1 of the paper only consists of the OHC and LAI anomalies converted into the necessary forcings. First, the link to the NOAA OHC data [11] in your paper is a dead link. It ends with the error 550: No such file or directory. Second, using the data available under http://www.nodc.noaa.gov/OC5/3M_HEAT_CONTENT/basin_data.html (I cannot imagine that NOAA hosts different data series for just one subject) and recalculating your OHC forcing brings the following results: Time    0-700 m [W/m²]   700-2000 m [W/m²] 1970-2008     0.335     0.137 1980-2008     0.276     0.187 1990-2008     0.401     0.228 2000-2008     0.450     0.217 2002-2008     0.383     0.197 Third, how can the standard errors of the greater time ranges be smaller although the standard error of the origin data for e.g. 1970 (+/-0.94*10^22 J) is larger by a factor of 5 compared to 2008 (+/-0.161*10^22 J)? So, what have I missed?
    0 0
  49. JoeRG @48 - as you note, the source link from which we obtained our data is no longer available, and the link you provide seems to have somewhat different numbers. Perhaps NOAA updated the dataset over the past 6 months. Regardless, the main conclusions remain unchanged.
    0 0
  50. #32 From Peru, I think climate change denial is more common in physics than in most sciences. As the most basic and fundamental of all the sciences it usually deals with the simplest systems. Too many want a simple mathematical description of what is going on and do not develop a feel for the behaviour of complex systems. Some don't know how to handle observational rather than experimental data. This makes them too likely to accept the simple arguments that denialists make, especially if this fits in with their ideological preferences. This is only a tendency and as far as I know only a minority of physicists fall for it.
    0 0

1  2  Next

You need to be logged in to post a comment. Login via the left margin or if you're new, register here.


The Consensus Project Website

THE ESCALATOR

(free to republish)


© Copyright 2024 John Cook
Home | Translations | About Us | Privacy | Contact Us