


 Arguments
Software
Resources
Comments
The Consensus Project
Translations
About
Support
Arguments
Software
Resources
Comments
The Consensus Project
Translations
About
Support
![]()
![]()
![]()
![]()
![]()
![]()
![]()
![]()
![]()
![]()


![]()


Latest Posts
- Skeptical Science New Research for Week #29 2025
- Climate Adam & GeoGirl explain a recent study reconstructing 485-million-year history of Earth's surface temperatur
- Fact brief - Did CO2 contribute to early 20th century warming?
- Update on Texas flooding
- 2025 SkS Weekly Climate Change & Global Warming News Roundup #28
- Skeptical Science New Research for Week #28 2025
- Trump just gave a huge gift to China’s economy
- Fact brief - Is global warming just due to El Niño?
- The great acceleration debate
- 2025 SkS Weekly Climate Change & Global Warming News Roundup #27
- Skeptical Science New Research for Week #27 2025
- Take advantage of these tax credits before Congress kills them
- Fact brief - Are human CO2 emissions driving current global warming?
- What do the latest WMO temperature projections imply for 1.5C?
- 2025 SkS Weekly Climate Change & Global Warming News Roundup #26
- Skeptical Science New Research for Week #26 2025
- You did it! Yale's 2025 extreme weather coverage is funded
- Rebutting 33 False Claims About Solar, Wind, and Electric Vehicles - Recap
- Climate Adam - Silencing Science: Trump's War on Our Climate
- 2025 SkS Weekly Climate Change & Global Warming News Roundup #25
- Fact brief - Is modern warming just a rebound from the Little Ice Age?
- Show your Stripes Day on June 21 2025
- Skeptical Science New Research for Week #25 2025
- The role of aerosol declines in recent warming
- Sabin 33 #33 - What is the effect of hot or cold weather on EVs?
- 10 ways that Trump’s tax bill would undermine his energy promises
- 2025 SkS Weekly Climate Change & Global Warming News Roundup #24
- Fact brief - Was 1934 the hottest year in the global record?
- Skeptical Science New Research for Week #24 2025
- Climate Adam: Is China Finally Changing Its Climate Ways?
Comment Search Results
Search for hockey
Comments matching the search hockey:
- Skeptical Science New Research for Week #26 2023
Just Dean at 07:26 AM on 2 January, 2024Eclectic @10.
I have been following Dr. Tierney's work for sometime. I think Dr. Tierney's work is underappreciated. I think the combination of proxy data with modeling is cutting edge for paleoclimatogy. For instance, I think her paper in Nature with Osman may ultimately redefine the shape of the "hockey stick," REF .
Also, look at the quality of the fit for the Cenzoic age, this research really might start to constrain the climate models for predicting future temperatures for different emission scenarios.
- At a glance - Evidence for global warming
Paul Pukite at 16:31 PM on 1 December, 2023
As mentioned by Eclectic @6 sites like WUWT are a swirl of laughable efforts to evade learning about things that contradict 'preferred beliefs'.
Eclectic mentioned something about a "Paul" at WUWT, apparently thinking that's me. Why would he think that? Does he have evidence? I have been blogging since 2004 and have yet to write anything "in strident denial of AGW, Hockey Stick, etc" and certainly haven't been featured in a YouTube video. I guess my crime is being involved in research on El Ninos.
Frankly, I don't find AGW that interesting as it seems fairly well understood. More difficult is to predict an El Nino a few years in advance.
- At a glance - Evidence for global warming
Paul Pukite at 01:16 AM on 1 December, 2023
one has to look fairly hard for maritime areas that do not show a "similar warming trend"
As far as I can tell, when one searches for equatorial Pacific ocean SST time-series, you only get NINO34, NINO4, etc data. These show no or very little trend, being dominated by ENSO variations. As far as I can tell, they have not been detrended, but do have the annual seasonal temperature cycle removed.
Proxy records to demonstrate the hockey stick contain many samples from coral ring measurements. Yet, these also show very little trend which is not surprising as most coral is found in tropical or equatorial waters, where the SST also shows little trend. That's why most hockey stick discussion is on tree ring data.
- At a glance - Evidence for global warming
Eclectic at 12:26 PM on 30 November, 2023To add a touch of humor to this thread :-
While scanning through the well-fertilized field of WUWT blogsite, I found myself being directed to a new Youtube video of a day or two ago, where the author [Paul] is in strident denial of AGW, Hockey Stick, etc.
Such videos are typically not worth viewing (unless you are "in traction" in a hospital bed for the next 3 months, while your shattered bones heal). But a quick scan through the video's comments column may turn up a gem or so. And the gem was a two-liner :-
[quote] "Thanks, Paul.
You and Tony Heller are beacons of sanity in this crackpot World"
!
- It's cooling
Bob Loblaw at 23:37 PM on 6 September, 2023CORK @ 332:
You don't need to join a group to be part of it. You don't even need to be aware that your actions and viewpoints are shared with a larger group.
@33:
The hockey stick is one of many forms of evidence that tells us the current warming is unusual. Like anything else, it can easily be criticized by the uniformed. Should you wish to discuss the hockey stick, this thread is the place to go.
- It's cooling
CORK at 23:30 PM on 6 September, 2023Bob Loblaw @331
The simple answer to why the current warming is due to human emissions of CO2 is "physics". We do have information on past climates through geology - combined with understanding the physics involved. We know what physics can and has affected climate in the past, and we know that those processes do not explain the current warming - unless you also include the effect of CO2.
Yes, I know all this.
That's exactly my point: explain Climate change to the wider public with that type of information. Not with hockey cross curves that can easily be criticised.
Now, good bye.
- It's cooling
CORK at 03:27 AM on 6 September, 2023CORK to "Response".
Thank you for your comment.
I had actually read "What does past climate change tell us about global warming?" extensively a few months ago and the idea that the warming anomaly of the last 150 years may not show up on a graph at a different scale of time for the future climatologists of year 22023 was scratching my at my patience slowly.
If the warming of the last 150 years is really a global warming trend it will be seen, even at a larger scale of time in 20 000 years, but at the scale of time used for today's events which is about a 1cm for 100 years it may be given an importance it may have not.
In a nutshell, and aknowledging that I do not think that measuring temperatures alone can confirm a human made global warming, I beleive that the hockey cross graph is counter productive in trying to open minds.
- Cranky Uncle: a game building resilience against climate misinformation
peppers at 00:56 AM on 19 June, 2023 Hi gentlemen. Rob, I start my logic from our worlds increase from 1 to 8 billion people. I dont know of anywhere this is made up or in dispute. I then premise that this describes mankinds addtional use of resources, including increased use that has elevated Co2. I will pause there until we are agreeing these premises are in agreement, but I will hint that this is a remarkable change in approaching this topic. If we do not agree that our population has rocketed up from 1 to 8 billion ( 8 billion reached November 22, 2022 ) in 200 years, after never going over 1 billion in the prior 180,000 years of human history, then we cannot really go to the next step of my ideas (thx).
Eclectic, hi. I understand infant mortality to be the measurement of human suffering over the large picture. That is how it is posed. I know it sounds off base and we should discuss cancer or heart disease, etc. But infant mortality has been the real beast to our existence. 50% in roman times, peaking to 62% I think in south american in 800AD. It has been at 50% in many place on earth into the mid 1800's. Today it is under 1% in the US, and about 4.35% globally with the third world locations providing the offsets of up to 8.5%. I posted a chart earlier on this thread.
Surprisingly, or not surprisingly, the eradication of infant mortality, the leap of our lifespans and the shear amount of people who now live to be an adult produces a chart that is an exact mirror to the hockey stick chart used to show our rise in Co2.
I hesitate to go further, but I will hazard it. If you see what I am referring to, much like the rise of people on earth to 8 billion; there is no going back. The world is different. The world is already different and there is no going back and the United Nations estimates we will continue to increase to just about 9.5-10B around the end of this century and then it will taper off on increasing.
I have not explored expectations of any decline but if it is expected I would imagine it would involve several hundreds of years. And only find a moderating level of some kind and not return to 1B.
- Cranky Uncle: a game building resilience against climate misinformation
peppers at 21:19 PM on 16 June, 2023I have an ex wife who a year or so later, was 'fond' of me. I have an adversion to the word now!
How do we reconcile these 2 premises:
1. Characterizing another who does not conclude at this juncture, as; someone who is fond of misunderstanding climate science matters.
2. Oxford Dictionary; The systematic study of the structure and behavior of the physical and natural world through observation, experimentation, and the testing of theories against the evidence obtained (the definition of Science bearing no mention of conclusion, and also applies the inference that a conclusion would be an impediment to the process of science).
I dont think you mean to have a conflict with others still observing and testing theories.
Milgram's Six Degrees of Separation famously said that a butterfly can flap its wings in Peking, and in Central Park, you get rain instead of sunshine. As opposed to being settled, you cannot operate a scientific understanding without first not knowing. If you are steering to a conclusion, thats not science nor even close.
To add a bit more meat to the above poetic insertion, I'd like to add 2 observations. On November 22nd 2022 the world hit 8 billion, having increased exactly at the pace and curve of the famous hockey stick graph from 1 billion in the same time span. For a discussion about the planets ability to handle such a change, the clouds and atmosphere contain all the energy and ability to moderate that. However it is impossible to model any of it.
I say we need to observe, experiment and add theories to our incomplete knowledge of our world and of the solar system. More warmth, more moisture, more clouds, more albedo, etc.
Theories do not require immediate citations or proofing, however that would be the next thing sought. For the sake of theory ( not a belief nor desiring antagonizing), if we stay to any natural progression of things, the increase of our species having caused changes, if the natural offset were more warmth, moisture, cloud cover and albedo to offset this, are we interferring with natures response just because we would not want a warmer world, more weather, higher coastlines, etc.?
- 2nd law of thermodynamics contradicts greenhouse theory
Eclectic at 13:01 PM on 13 June, 2023Likeitwarm @1550 commented: "These things are put out there by people I don't think are dummies. I wonder if they would put them out there if they knew they were wrong?" [answer: Yes, because of Cognitive Dissonance]
Thanks for the chuckle !
Yessir indeed. Even some very intelligent Denialists repeatedly put stuff out there when they know it's wrong. Over and over again, they put out there some favorite pieces of wrongness, despite repeatedly being shown wrong by scientific literature or repeatedly being shown wrong in science-based blogs such as SkS= SkepticalScience / ATTP= And Then There's Physics / etcetera.
Why do Denialists keep posting wrongness? ~ because they are angry and have huge cognitive dissonance and they indulge in Motivated Reasoning. And a small percentage are paid for such propaganda [looking at you, Heartland Institute and GWPF= Global Warming Policy Foundation ] of using half-truths & other misleading stuff.
Likeitwarm ~ there certainly is some value in reading denialist blogs such as WUWT= WattsUpWithThat , and ClimateEtc [blog by Dr Judith Curry]. You won't learn much genuine climate science there, but you will learn something of the flaws & follies of Human Nature. ~Which can be entertaining . . . as you see the persistent wrongheadedness of 90% of the commenters there.
The big question, the interesting question, is why do those people (both the intelligent ones and the moronic ones) keep on persistently misunderstanding and/or misrepresenting stuff**
** An amusing example from just a few days ago on ClimateEtc ~ a certain regular commenter stated: "many studies on sea level [show] rising for centuries at approximately the current rate" and he cited a scientific paper. When I myself accessed that paper: it showed the complete opposite picture in its very first diagram [which showed centuries of flatness followed by a spectacular "Hockey Stick" upwards trend in the past 200 years]. The original commenter's egregious error was pointed out by another commenter . . . whose post mysteriously disappeared a day later.
- CO2 is not the only driver of climate
Bob Loblaw at 07:54 AM on 9 May, 2023piotr @ 73:
I am not sure what your "not directly" statement refers to. I presume that the Martin Mlynczak quote is the one in comment 69. To put it simply, the thermosphere and the earth's surface respond to solar radiation in very different ways. You can read about the thermosphere on Wikipedia. Note that the thermosphere is at very high altitudes (>80km), and its temperature structure is the result of the absorption of UV radiation. It also has very low density, so even though average kinetic energy is high ("temperature") it does not hold a lot of heat. It is not strongly linked to the surface, which is heated by the absorption of solar radiation over the full spectrum.
This paper by Lean, Beer, and Bradley (1995) shows in figure 2 that variations in total solar irradiance are much less than for the UV range (in %).

To use the 4W/m2 drop in that figure, you need to first reduce it by a factor of 4 (area of a sphere vs. area of a circle), and then adjust for global albedo (0.3), giving an overall forcing of only about 0.7 W/m2. Sustained over only a period of about 50 years, this is not going to have a major cooling effect on its own.
You say that "it noticeabl[y]e cooled large parts of the no[r]thern hemisphere", which I presume is a claim with respect to surface temperature responding to these solar variations. You then throw in volcanic effects. You seem to grossly overestimate those solar effects, though - with no references to any supporting information. If you look at this SkS post, the first figure shows that reconstructed global temperatures for that period are much smaller than your claimed "decrease up to 1.5°C".

In your second paragraph, you start talking about "The past 10.000 years where up and downs in global mean temperature like +/- 2°C for dozen decades, even for nearly 2000 years - as we can reconstruct with little data-points." This starts to wander into the last glacial period, where Milankovitch cycles start to play a role. You are mixing together a lot of different forcing mechanisms, as if they are all equivalent in some fashion.
You then start into urban heat island effects, and finish off with a couple of paragraphs that represent an argument from incredulity. If you actually want to learn something about temperature reconstructions from proxies, Wikipedia has a decent article on this, too. The Wikipedia page also has a graph that shows even less variation in temperature than the one above:

The numbers you are throwing around in your "just imagine" scenarios seem to be ones that you have a lot of confidence in. The problem is that they also appear to disagree with broad swaths of the scientific literature. You appear to be claiming that science is unsure of what happened in the past - but you are. It seems highly unlikely that you are correct.
If you want to have any credibility here, you are going to have to provide references to the numbers you post. This is not a site where you will be permitted to post a lot of unsubstantiated opinion. As you are a new user here, I strongly suggest that you read the Comments Policy.
- CO2 is not the only driver of climate
Bob Loblaw at 11:20 AM on 8 May, 2023piotr @ 70:
You ask what might have caused the Maunder Minimum. First, you should think about exactly what the Maunder Minimum was: a period of low sunspot numbers. Wikipedia has a good article, and they include this figure:

Technically, "what caused the Maunder Minimum?" is a question of astrophysics, not climatology. But what you are probably wanting to ask is "what caused the xxxxx?, where xxxxx is something that you feel is correlated with the Maunder Minimum. Reduced solar irradiance? Lower temperatures? The Little Ice Age?
So, this means that you are looking at something where the Maunder Minimum is an indirect/proxy indicator of some potential climate factor. You do realize that we do not have direct evidence that the Maunder Minimum caused a specific decrease in solar irradiance? You do realize that many of the observations indicating cooler temperatures - such as ice on the Thames -are local, and not global? The Little Ice Age appears to be related to a number of factors. You can read about it a bit more in this post.
Understanding of past climates is based on things like vegetation, sediments, etc. A lot of those have automatic time-averaging (trees don't grow in a year) and spatial averaging (sediments and pollen get carried in to lakes from large watersheds). The analysis of past climates includes a wide variety of proxy indicators. You can read more about it on this post.
In short, you need to be more specific in explaining what you do understand, and what questions you have.
- At a glance - What evidence is there for the hockey stick?
nigelj at 06:58 AM on 25 March, 2023John Mason @4, I get that, but you gave the actors quite a lot of prominence by highlighting them at the top of the page on the hockey stick is broken myth. And I believe this is the right thing to do because the entire myth is about their claims. So its impossible not to give them prominence.
And its the first thing lay people read because its right at the top, so even if they haven't heard of these guys they know them now! But thats ok.
And its not playing the man to criticise their findings, or put them in context (other studies using different methods found the same results.)
Having correctly given them prominence at the top of the page, I believe you have to address what they say and why it lacks credibility in the at a glance section, or people will be confused. I was a bit confused. Of course it can be addressed briefly and expanded upon in the details, and further in the intermediate version.
Its just a formatting thing. The actual content was is good.
- At a glance - What evidence is there for the hockey stick?
nigelj at 07:52 AM on 24 March, 2023BaerbelW @2.
Ok. I will clarify. The "at a glance" section for the basic hockey stick myth, and the information in the further details both didn't seem that great for the reasons I stated above. I now see I should have replied by the special google feedback form. Sorry about that.
- At a glance - What evidence is there for the hockey stick?
BaerbelW at 07:38 AM on 24 March, 2023nigelj @1
Nigel - the actual rebuttal still has the fact and myth at the top of both the basic and intermediate versions. We didn't include these two boxes in the blog posts primarily intended to highlight the new "at a glance" sections and as reminders that we are interested in feedback about them.
- At a glance - What evidence is there for the hockey stick?
nigelj at 06:37 AM on 24 March, 2023Regarding the basic version of the rebuttal to the hockey stick is broken myth. This stated the myth at the top about Professor McKitrick and Steve McIntyres scepticism about the hockey stick, followed by a rebuttal. But IMO the rebuttal was a little bit vague and wordy, and didnt clearly say why McKitrick and McIntryes work was not relevant, and it wasnt clear on the fact that new studies done using different techniques supported the shape of Manns original hockey strick (the key point surely). In contrast the intermediate rebuttal was excellent.
- The Big Picture
peppers at 08:11 AM on 17 March, 2023Hi Rob,
Apologies for not including my reference points. sealevel.nasa.gov has the sea level rise 2mm a year historically and as their projections. That is what I used for the 3-5 inch final rise until our population levels out.
And at 66M years ago we were at 1000ppm and 14+ degrees C higher, and there are hundreds of sites with charts showing the same data. Some wanting to have the ppm look extreme just use an 800k year graph, which is the basis of the hockey stick chart.
But, our recent increase is extreme, matching our wild conquering of the human condition and the 800-1000 % increase in our numbers. I have no idea of our wisdom as a species around all this, except lengthening our lives and solving misery, pain and premature death was hugely addressed in a wildly successful way.
One might weigh all these factors and decide if our current state is worth it. I would not take all of that for granted however and only complain about the weather now. Should we go back or should we have skipped all that advancement?
For me, I want to consider all of this when thinking of it.
Thx Rob, D
- The Big Picture
peppers at 21:38 PM on 16 March, 2023I appreciate this summary being addressed again in this way.
My take is that Co2 is rising as measured and it is human caused. You can overlay the increase from 1B to 8B in population over any of these 'hockey puck' graphs and the more people-more emisions conclusions are solid for me.
The origin of the issues makes all the difference, and the premise that folks shy away from the historic population boom being voiced because there is nothing that can really be done about it, is non scientific.
The crisis? Humanity succeeded in mass shelter, food and medicine. Antibiotics in the last 100 years! Infant mortality has dropped from 400 per thousand ( several hundred years ago) to 5.5 per thousand. More are born and huge % more remain living! We suceeded!
The modeling ( we love modeling here) by the U.N. is this rises until reaching 10.5B about the end of this century, and then begins to decrease. That is when we will see Co2 level and fall. Meanwhile this push to curb Co2 efforts cannot even keep up with the population rise continuance. The US adds the population of California again, about 2055.
I am responding to the culminating comment, based on no science whatsoever, in the above article: "What's the use of having developed a science well enough to make predictions if, in the end, all we're willing to do is stand around and wait for them to come true?"
My response would be to aid people in adaption to this. Any nations greatest resource is people, and the lowest countries of the world gain the most population by this dynamic of population boom. The premise that,"However, the negatives will almost certainly outweigh the positives, by a long shot." This further added statement with no science whatsoever attached helps highlight how unconsidered the whole picture is presented here.
- Temp record is unreliable
Bob Loblaw at 22:39 PM on 27 September, 2022To follow up Eclectic's comment at 525, there are many environmental/geological records that indicate various features of past climates. Vegetation and animal populations are often linked to local climate, and fossil evidence of past vegetation and animal abundance gives indications of past climates.
Tree rings go back thousands of years in some cases, and fossil trees can generate longer tree ring records - earlier than the oldest living tree in the area.
Pollen deposited in lake sediments indicates vegetation at the time the sediment was deposited. In many areas, the lake sediments have annual layers due to summer/winter variations in hydrology, so the layers are easily dated. Thickness of layers gives indications of rainfall/stream flow variations that affect the amount of sediment.
Eclectic mentioned ice cores, which can give both temperature information and atmospheric gas concentrations (CO2) going back hundreds of thousands of years.
A search here on "proxy" yields a couple of useful posts:
https://skepticalscience.com/Peter-Brannens-Paleo-Proxy-Twitter-Thread.html
https://skepticalscience.com/Tai-Chi-Temperature-Reconstructions.html
Wikipedia has some discussion of the "Hockey Stick"
https://en.wikipedia.org/wiki/Hockey_stick_graph_(global_temperature)
Unless your friend knows details of the "reliability" of these many methods of examining past climates, he/she is arguing from a position of lack of knowledge.
- There's no tropospheric hot spot
MA Rodger at 19:23 PM on 23 August, 2022Cedders @33,
And having had a read of that PDF...
Cedders @33,
Having examined the PDF (16 pages not 24), it is quite evident that it is a pile of utter nonsense, a "welcome to the lunatic asylum" message and not anything in any way scientifically-based.
The author is Piers Corbyn, a well-kown denialist and an elder brother of Jeremy Corbyn (a long-serving left-wing Labour MP who bizarrely gained the heady position of Leader of the Labour Party for 4½ years).
Piers Corbyn is described in Wikithing as "an English weather forecaster, businessman, anti-vaxxer and conspiracy theorist" and does feature here at SkS being (1) Cited within a spot of denialism of 2015 in the Daily Express tabloid/comic, (2) The main source of a pile of climate nonsense of 2013 from the then Mayor of London Alexander Boris von Pfiffle Johnson, a man now renowned throughout the known world for not being particularly truthful, (3) Listed here at SkS as a denialsit with zero peer-reviewed writings.
The 16 page thesis linked up-thread @33 is a 2019 thesis presented to the Reading University Debating Journal and sitting at the top of a list of 24 such theses posted 2018-19, top of the list because it is the most recent (the journal lasted less than a year), a list which addresses such important topics as 'Why Self-Service Checkouts are the Invention of the Devil' and 'The Great University of Reading Catering Con: Man Shall Not Live off Sandwiches Alone' and an anonymous piece 'Why I Support the Conservatives: The Most Successful Party in British History'.
The Piers Corbyn thesis begins by citing David Legates' dismissal of the 97% AGW consensus before dismissing that because "it is about facts; and no Global-Warming Inquisition is going to prevent me exposing their nonsensical theories."
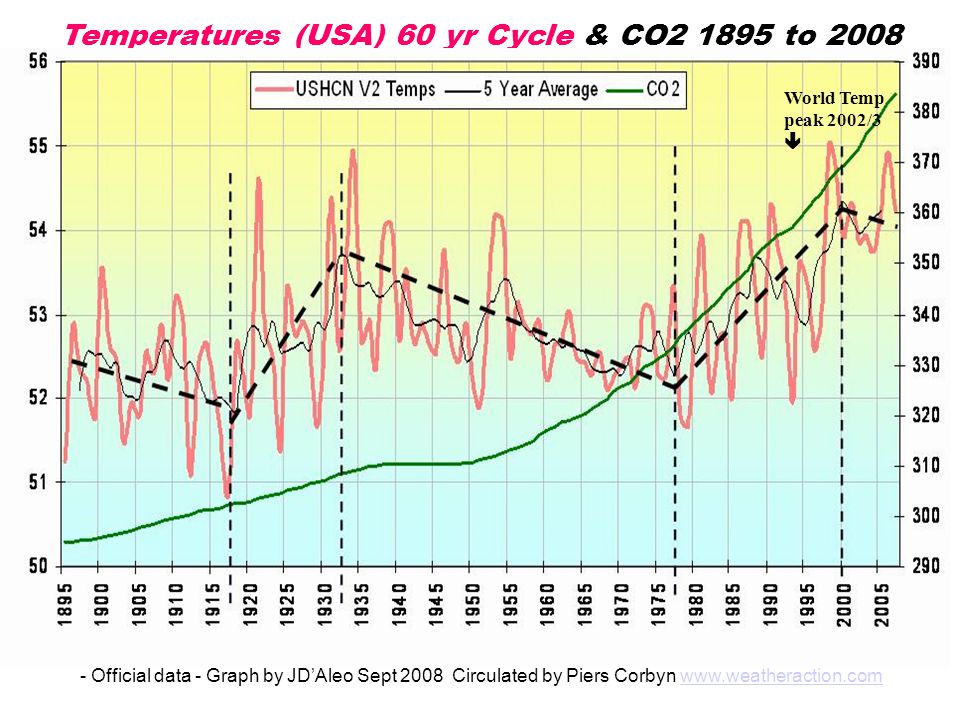
Corbyn then kicks off by asserting anthropogenic CO2 comprises 4% of atmospheric CO2 (thus confusing FF carbon with naturally-cycled carbon) and that CO2 is not the main controller of global temperature (here presenting a graphic which confuses the US temperature with global temperature - shown below in this comment).
A further assertion is then presented, that CO2 is the result of warming oceans with six references/notes provided in support which seem to all point back to crazy denialist Murry Salby.
So, a la Salby, the present rise in CO2 is claimed to result from the good old Medieval Warm Period. A graphic is presented comparing a denialist 1,000y temperature record (based on the schematic FAR Fig 7c) with the much-confirmed scientifically-based Hockey Stick graph.
This brings us to the halfway page of Corbyn's denialist rant.
The thesis continues with pageful of misunderstanding of how the GH-effect works, ending with accusations that this misunderstood 'theory' breaks the 2nd Law of Thermodynamics (or it does if you misinterpret the 2nd Law of Thermodynamics).
Happily, this misunderstanding is considered to be not supported by "better scientists" who consider the lapse rate. And this indeed is a 'better' consideration. But here Corbyn perhaps confuses the tropical 'hot spot' (which is caused by increased tropical rainfall transporting more latent up into the troposphere) with some CO2 effect. (The 'hot spot' results from a warmer tropics and not per se any enhanced GH-effect.) And he fails to address the reasons why there is difficulty detecting this tropical 'hot spot'. Indeed he brands it as a 'coldspot' that he seems to say is caused by "more CO2 & other GHGs" which cause a diurnal fluctuation in the IR "heat-exit height" to become greater and, due to the 4th-power in the SB equation, this causes cooling. Whether such a phenomenon extends beyond the tropics (thus globally more-than negating the 'hot spot') is not properly explained but, due to the lapse rate this phenomenon can apparently also negate "the original expected surface warming."
A first graphic box is presented with three unsubstantiated bullet points explaining "Why CO2 theory does not work" alongside two similar "apart from"s.
A second graphic box also titled "Why CO2 theory does not work" states:-
In the real atmosphere there are day/night temperature fluctuations (eg in upper atmosphere). They are larger with more CO₂ because CO₂ (infra red absorber / emitter) gains & loses heat easier than N₂ & O₂ and so enables all the air to adjust quicker.
This is a fundamentally different explanation from the previous fluctuation in IR "heat-exit height" explanation described earlier, and it is still wrong.
(A packet of air with X concentrations of CO2 will both emit and absorb an IR photons of quantity P. With absorb=emit, it is thus in equilibrium. Add CO2 so the concentration is doubled to 2X, and the emitting photons will double to 2P and the absorbed photons will also double to 2P so absorb=emit and the same equilibrium is maintained. The main result is that twice the level if IR emission has half the pathlength before absorption so at any point the IR flux remains unchanged. And CO2 does not "gain & lose heat easier than N₂ & O₂" when it remains thermally coupled to the N₂ & O₂. )
The remainder of this second graphic box on PDF page 9 is a little too confused to rebut with any confidence. A diurnal range of "about 5 or 6 deg" is given which is apparently a temperature range yet whatever “deg” means (presumably Kelvin), the bulk of the troposphere has a far smaller diurnal range than even 5ºF. The mechanism for the enhanced cooling from the "heat-exit height" is presented as due to a fluctuating temperature losing more heat (by radiating IR) than a constant temperature (which is true). A rather dodgy-looking equation is followed by the note "Detail subject under research" but no reference is given and three-years-on there is no sign of such "research."
And a third graphic box is shown on the next page also titled "Why CO2 theory does not work," this third such graphic mainly presenting a pair of images from Australian denialist David M. W. Evans who has his own SkS page of climate misinformation.
The thesis then turns to the proposition that it is not CO2 but solar forces that "rules climate temperature" with the dotted line on the graphic below described as such a ruling influence. It apparently shows how the "9.3yr lunar-nodal crossing & the full 22yr solar magnetic cycle" allegedly shift the jet stream and "many circulation patterns." The graphic's 60-yr periodicity is less than convincing,being fitted to US rather than global temperature which, when extended beyond the 1895-2008 period shows itself to be simple curve-fitting (eg the Berkeley Earth US temperature record 1820-2020 does not show it, even to a blind man). The graphic was presented by Corbyn at the Heartland Institute's 2009 conflab in NY in which Corbyn [audio] insists other findings demonstrate “something is going on” but why it is this graphic being reused in this 2019 thesis is not clear – perhaps the forecast of world temperature dropping to 1970s levels by 2030 is too evident on other slides he used in that Heartland presentation.
To support his thesis Corbyn mentions an alleged cover-up by the likes of the BBC in reporting only global warming when the 'true' data shows cooling, the reported support for all this Piers Corbyn craziness from oil companies who shy away only because they want to use AGW to "make higher profits" and how these AGW-inspired mitigation agendas are already directly responsible for needlessly killing "millions" annually.
The thesis ends with a challenge:-
It is for this reason that I, Piers Corbyn, challenge whoever is willing in Reading University or other appropriate institutions to a debate on the failed Global warming scam vs evidence-based science.
So I interpret the thesis as a "welcome to the lunatic asylum" message from Piers Corbyn.
- Skeptical Science New Research for Week #26 2022
peppers at 00:53 AM on 4 July, 2022I see this as a sort of misplaced approach to this issue, as all this data does little to folks passing by your stand at the swap meet. You are addressing people who may be saying there is no changing happening, and I dont think that remains logical. But some may be saying that to be obstinant or antagonistic. For myself, I dont think that change is happening is hard to see. The crisis stated by all this refers to the hockey puc being a precident in history, and the world will now be ending shortly by a runaway cycle. The train barreling down on a next generations child was the fearsome icon. But the world has experienced this before. That meteor 66 millions years ago ( killed dinosaurs and 3- of every 4 living things on earth) lowered the world 5 degrees overnight and darkened the earth completely sunless for 6 years. 30 degree F drop in 6 years, then swinging higher than previous normal and climbing to 2000-2500ppm once the sun returned. It all came back. My point is that, no matter it happening or the source, the world ( the universe ) balances. More co2 increases foliage (detected by Nasa's MOTIS), more transpiration, more moisture in the air, more low clouds with higher albedo. You will find even more paths of balance if you turn your capable eye to the cycling of nature, meaning the inescapable balance of all cycles. It is physically impossible that the balance is not there, I assure you. I am happy to elaborate more if there is interest. Thanks and best, David
- SkS Analogy 1 - Speed Kills: How fast can we slow down?
Eclectic at 10:38 AM on 19 February, 2022Nigelj @38 :
speaking of Hockey Sticks and MWP's and vast lists of scientific papers
. . . leads us to one of PotHoler54's encounters with that well-known paragon of truthfulness, Lord Christopher Monckton :
(shown in PH54's video "Medieval Warm Period - fact vs fiction" )
Monckton speaks: "700 scientists from more than 400 institutions in more than 40 countries ... have contributed to papers that I know about, and can on notice list, saying that the Medieval Warm Period, which is well-known in history and archeology, as it is in climate science - was real, was global, and was noticeably warmer than the present."
in his video commentary, Potholer54 states :-
"Monckton was as good as his word, and when I asked him for the list, he gave it to me. Unfortunately, I am probably the only person who ever asked him - because the list doesn't live up to his claim. The 700 scientists who contribute to the papers listed, don't say the Medieval Warm Period was real, global and noticeably warmer than today - or anything like it."
Nigelj, I'm sure you won't be the least bit surprised.
[ There is more entertainment to be had, in a whole 5 (five) videos by PotHoler54, titled "Monckton Bunkum" . . . exposing Monckton's . . . er, taradiddles & self-contradictions. ]
- SkS Analogy 1 - Speed Kills: How fast can we slow down?
nigelj at 07:10 AM on 19 February, 2022"The list begins with 70-odd papers purportedly demonstrating "A Warmer Past: Non-Hockey Stick Reconstructions"
I came across a similar list a couple of years ago. I read through the first 20 abstracts on the basis that if there was a killer blow it would be in the first few papers. It turned out to all be studies on a few individual cities or very small regions that were warmer than recent temperatures. But we know not all cities / locations were like that and the list obviously just cherrypicked those with unusually warm temperatures. Not one of the studies was for Europe as a whole let alone the entire planet. We know from such studies that the MWP was a weak event and not truly global.
I doubt Santilves has looked at even the abstracts of such papers and just assumes they invalidate the consensus or there must be a smoking gun there. The devil is in the detail. Denialists are intellectually lazy.
- SkS Analogy 1 - Speed Kills: How fast can we slow down?
MA Rodger at 23:44 PM on 18 February, 2022This is a run through the input of commenter Santalives (a curious name to chose as Santa is known to be buried in Bari, Italy) down this comment-thread. It may be useful given the mercurial argumentation being presented.
@2 we are told that there are "articles (especially the peer reviewed) that are shredding climate science" although quite where these were was not made plain.
@11 we are told it is "sites like wuwt" which "publish peer reviewed climate science and debate it" and an exemplar of this literature is given - Koutsoyiannis (2021) 'Rethinking Climate, Climate Change, and Their Relationship with Water'. This paper sets out a denialist thesis and isn't worth the paper it would be written on if you bought a paper version of it.
@14 it was explained that this exemplar paper was "picked at random" but there are "literally hundreds of peer reviewed papers like this that make it very clear the science is not settled." Yet they go undebated at SkS.
@25 it is argued that branding Koutsoyiannis (2021) as nonsense is not good enough and it deserves to be properly rebutted because "science is never settled" and can be overturned by new research with the Einstein quote that "a single experiment can prove me wrong". And dozens of papers showing new research which is perhaps doing that 'overturning' is featured at NoTrickZone rather than WUWT. NTZ actually has a second half to this list here.
@28 another exemplar paper is presented Seim & Olsen (2020) 'The Influence of IR Absorption and Backscatter Radiation from CO2 on Air Temperature during Heating in a Simulated Earth/Atmosphere Experiment' (a paper that describes an experiment meant to measure the GH-effect of CO2 but shows a complete misunderstanding of how the GH-effect works. This is not a controversial rebuttal. At WUWT, a review said the paper is "not saying much about the Greenhouse effect" although a NoTricksZone review was accepting of the paper's worthless findings).
@32 it is admitted that there is no "knock out" paper (which the Einstein quote @25 requires) but that "there is an awful lot that shows we are not in a climate crises" in some crazy non-scientific collective manner.
@33 the true task of SkS is described. "If this site was really about skeptical science it would have every climate science paper."
The commenter Santalives hasn't taken me up on my offer @18 of a full rebuttal of Koutsoyiannis (2021). Seim & Olsen (2020) is very obviously nonsense. As for the dozens of papers in the 2021 NoTricksZone listing, I would suggest it is from start to finish either papers that are clearly denialist nonsense or, more likely, selective quotes that misrepressent the quoted papers. The list begins with 70-odd papers purportedly demonstrating "A Warmer Past: Non-Hockey Stick Reconstructions" They will demonstrate no such thing. If any of them had established some evidence to overturn the accepted global temperature record based on proxy data, I'm sure we would soon have heard about it. I say 'from start to finish'. The first paper in this list is concerned with the SST seasonality in the South China Sea and establishing proxy methods. There is no Hockey Stick busting to be seen. And the final paper in the big long list shock-horror demonstrates "Abrupt, Degrees-Per-Decade Natural Global Warming" which is a well-known phenomenon but only found in the depths of an Ice Age. So I would suggest this NoTricksZone listing is yet more denialist nonsense.
- How machine learning holds a key to combating misinformation
Nick Palmer at 00:33 AM on 15 December, 2021John - you wrote "It turns out these were the least common forms of climate misinformation. Instead, the largest category of climate misinformation was attacks on scientists and on climate science itself."
I agree that smearing the science and scientists has indeed been the predominant form of denial/pathological scepticism for a long time - it's what I've found from my own experience tackling the toughest exponents, however I think the mechanisms they use to achieve the 'smear' are still the old tried and true 'Skepsci' favourites - Soon's 'it's the Sun', Climategate, Briffa's Yamal tree rings, Curry's 'uncertainty monster', Mann's hockey stick PCA's, Svensmark's cosmic rays, Morner on sea level etc. etc., although the originators are not nowadays mentioned by name so often these days - they don't need to be - their 'sceptical' objections have become established as canon in the denialosphere. - Climate's changed before
MA Rodger at 00:21 AM on 14 July, 2021TVC15 @873,
Your denialist is actually making four bold statements that are patently nonsense with the rather pathetic request that you "Tell us why this Inter-Glacial Period should be different."
"Ice sheets and glaciers always melt during Inter-Glacial Periods." The melting actually happens in the run-up to the "Inter-Glacial Periods" which is what makes them "Inter-Glacial Periods" so in one respect this is entirely straw man territory. If the bold assertion is that glaciers and ice sheets shrink as they do today throughout an inter-glacial, that is false as sea levels of past millennia demonstrate.
"Sea levels are normally 4 meters to 14 meters higher than they are now during Inter-Glacial Periods." This is not supported by the evidence that
suggests only two or three of the eight had higher sea levels. (The graphic is from here but originates from this web engine.)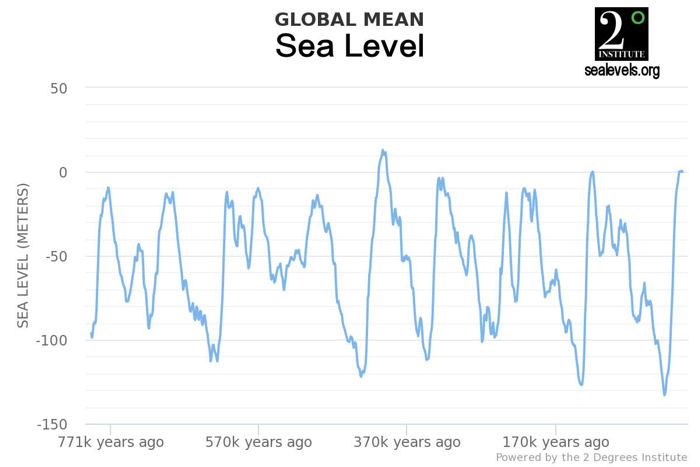
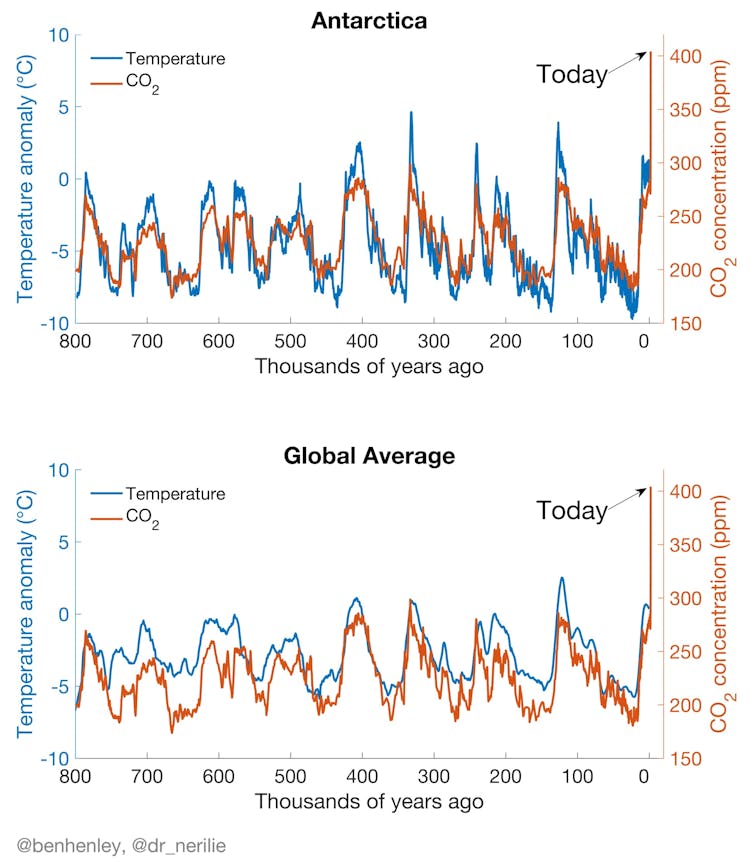
"Global temperatures in the other 8 previous Inter-Glacial Periods were at least 7°F warmer than present." Again not supported by the evidence. A google search provides many graphical representations of 800,000y temperatures and globally the present interglacial has been warmer than all but three of them (although AGW may be on course to change that ranking).
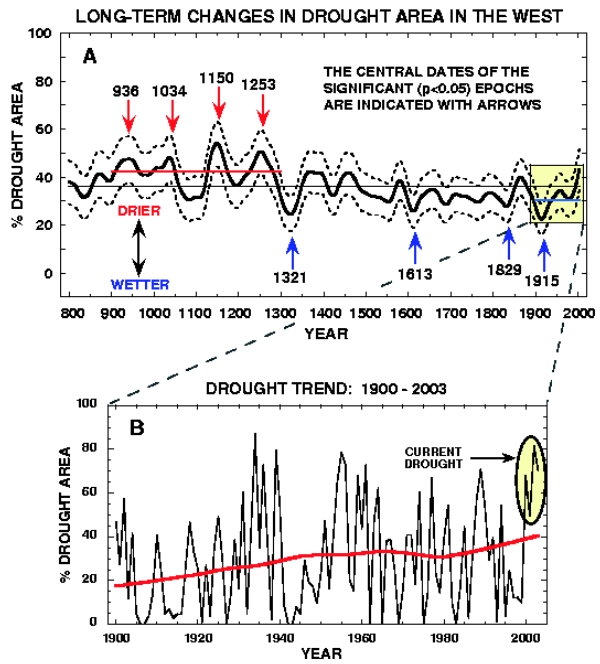
"The West always undergoes a drought during Inter-Glacial Periods." This is a more specialist assertion. That there has been "a drought" in "the West" through the Holocene is potentially correct. It isn't a place with massive rainfall. But more accurately there are periods of drought and periods when the rain is heavier. What we see to make sense of that is a bit of a Hockey Stick situation with drought conditions becoming more wide-spread. The graphic comes from here an account which does address the question "Will anthropogenic climate change cause the West to get drier or wetter?"
- ‘Tis the season’? Learn how change is in the air
MA Rodger at 08:55 AM on 3 July, 2021MNESTHEUS,
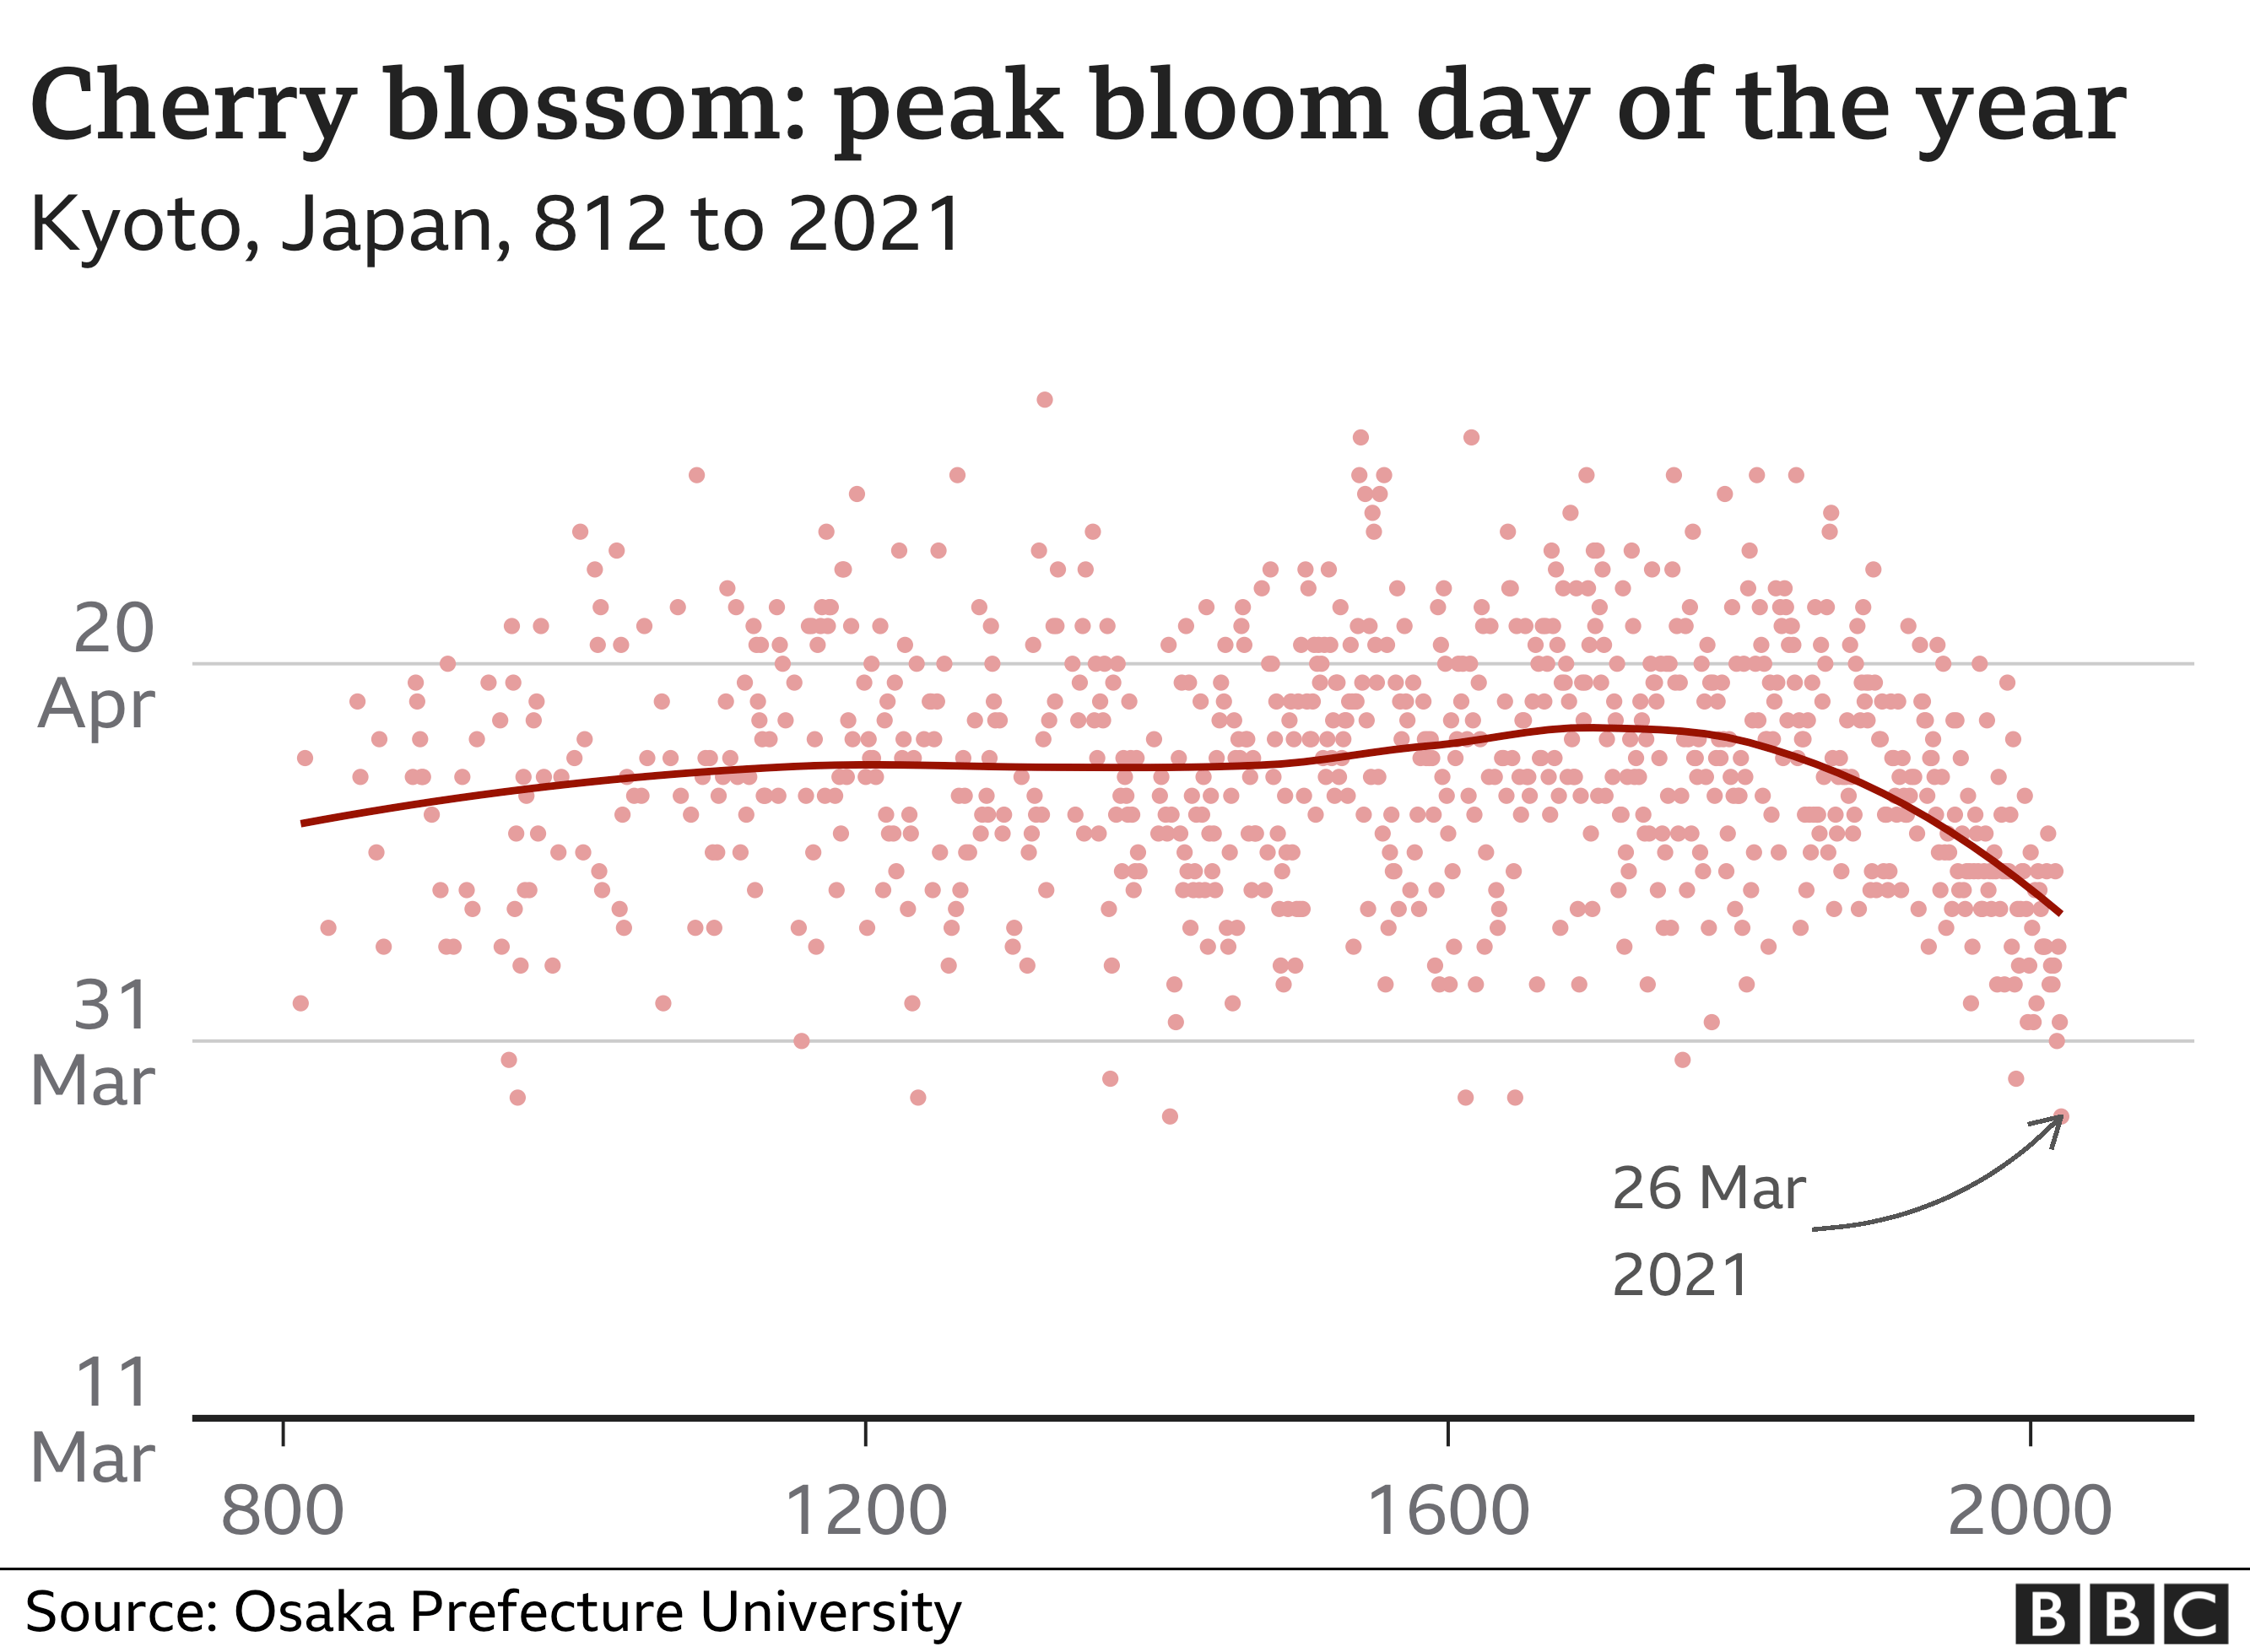
???? Hanami (as the cherry blossom festival is called) is of course celebrated to coincide with the cherry blossom and, as the upside-down hockey stick graph below shows, the blossom has on average not been arriving later in the year since about July 4th 1776, although inscrutably the 1777 Hanami did indeed come later than the 1776 Hanami (by about a year).
- It's planetary movements
MA Rodger at 21:19 PM on 29 March, 2021
You link to comment presented in Semi (2009-unpublished) 'Orbital resonance and Solar cycles' specifically p48 which says:-
The "wave" of approximate period of 934* years, which could also probably be anti-correlated with Sun spin rate, seems to match the climatologic events of Medieval optimum and Global warming, and also the Little Ice age of Maunder minimum, and similar periods in earlier ages (fig. 81)...
If this is right, now the Solar activity could drop a little, but will approach a larger maximum arround year 2050, not disturbed by the peak anomally, and then drop to a next little-ice-age arround 2400 AD. The time-lag between the spin rate change and activity change is still uncertain...
The periods of low scalar angular momentum (and higher Solar activity) roughly correspond to human civilization thriving: 1450BC Egypt, 600BC Greece, India and China, 200AD Rome and China, 1200 Medieval optimum (population growth in Europe), 2000AD (present "technical boom"). The periods of high scalar angular momentum (and lower Solar activity) correspond to crisis periods of human civilization.
According to this connection**, the current warming rate should slow down a little now, but will grow to local maximum arround year 2040, from which point it should drop to next little ice age arround year 2430 and to next warming arround year 2900. [**This referring to the paper's Fig 81 which plots the scalar sum of angular momentum of 9 planets and Sun with the climatologic data from Moberg et al (2005) which presents a 200-year NH hockeystick.]
This is all about a "wave" in the Scalar sum of Angular momentum and the page also presents a NOTE saying:-
NOTE: It was remarked, that Scalar sum of Angular momentum is a nonsense, which it is...
I think I would have to agree with this NOTE. Angular momemtum is considered maintained in a closed system and any heat-related effects that may work beyond a close system (the sun loses 130 trillion tons of mass a year through nuclear fusion) wouldn't make a great deal of difference to that, processes which themselves may show variation but again not significantly even if the sun's position relative to the solar-system's barycrentre were a factor (which Semi [2009-unpublished] asserts is when peak Scalar Sum of Angular Momentum occur).
Further to the NOTE, Semi (2009-unpublished) also does not set out this as an overall finding as it is unmentioned in either the abstract or conclusions.
Of course, that does not stop the swivel-eyed denialists. I note one of the two papers referencing Semi (2009-unpublished), Holmes (2018) 'Thermal Enhancement on Planetary Bodies and the Relevance of the Molar Mass Version of the Ideal Gas Law to the Null Hypothesis of Climate Change ' is cites Semi (2009-unpublished) as apparently showing "Yoshimura is in evidence throughout the climate system, and in proxy records, on all time-scales," (Yoshimura [1978] being cited to support a 55-year barcentric solar-system cycle but with zero actual mention of Earthly climate in that paper).
- Climate's changed before
Eclectic at 10:44 AM on 25 October, 2020Hal Kantrud , I would like to add a few disparate points which may be of interest to you. (And you may already have come across some of them.) As always, I shall be grateful if MA Rodger (who is extremely well-informed on climate matters) sees fit to make any corrective comment!
1. The term "BP" / bp stands for Before Present, but does not mean "up until right now this year of [2020]". BP is a convention used by the paleo scientists to standardize the reference to past ages - whether centuries, millennia or mega-years [ma]. BP at point zero is taken as year 1950.AD
Some "contrarians" have not been aware of this convention (for instance the slightly-contrarian scientist Loehle has had to go back and correct some of his work, because he was initially unaware of the paleo convention).
Hal, this paleo convention is enormously important, since there has been a huge rise in global surface temperature since 1950. Even today, some Denialist blogsites are publishing graphs which misrepresent reality, and are showing a graph's final temperature as 2000.AD or 2010.AD . . . when the original graph only went up to 1950.AD . . . and worse, the denialists have sometimes doctored or airbrushed-out the most modern temperatures. Sometimes this deliberate deception is outright concealed - and sometimes the deception is camouflaged under the term "Adapted from [a certain scientific paper]" .
Another small point is that some of the ice-core temperatures are recorded up until around 1855.AD , since later/shallower levels of ice are unrepresentative of their ambient conditions.
[You will have noticed how almost all science-deniers are still falsely (and vehemently) asserting that both the Holocene Maximum and the MWP were hotter than 2000.AD and current years.]
2. The Holocene Optimum [sometimes called Holocene Maximum] was roughly 8000 years ago, but as MA Rodger rightly points out, the Maximum was more of a plateau of roughly 5 millennia. Over the succeeding 4 or 5 thousand years, the temperature has dropped roughly 0.7 degreesC as part of the background cooling which would eventually lead into the next glaciation. But AGW has intervened - with global temperature rising like a rocket in the past 100-200 years (dare I say like the end of a Hockey Stick?) Hockey Stick is yet another term which causes Denialists to choke on their cornflakes.
As a consequence of the natural cooling down from the Holocene Maximum, the global sea level has reduced by about 1 or 2 meters . . . and that fall should have continued onwards as we slide into the next glaciation. Except for the modern AGW-caused rise in sea level, a rise which is slow but accelerating.
3. Each glaciation cycle of the past 800,000 has been subtly different, owing to differences in the variations of the Milankovitch cyclings. That makes it difficult to predict when the next glaciation would have occurred in the absence of human influence. One figure I recall seeing, is the next chilly glaciation being due in roughly 16,000 years. So we humans have plenty of time to fine-tune our climatic effects before any threat of severe glaciation! (Some denialists maintain that the "New Ice Age" was due in a few centuries from now . . . and our anthropogenic CO2 has fortuitously been raised only in the nick of time... )
4. I won't comment on your point of interest about the New World grasslands. The changes there would be quite minor in the overall picture.
- Models are unreliable
OH YES at 08:08 AM on 4 April, 2020Dr Michael Mann produced his "iconic" hockey stick graph ( model ) while working with the IPCC , which showed an exponential increase in global temperatures predicted .Dr Tim Ball publicly stated " Mann belongs in the state pen , instead of Penn State , because his model is a fraud , and his work was paid for by American taxpayers .Mann sued Ball for libel , in the supreme court of Canada ( Ball is Canadian) .Mann refused to show his raw data to the court , after 8 years of proceedings .Mann was charged with contempt of court for this . Ball was awarded all court costs , because he won the "Truth decision". Why was this climate change "trial of the century not " widely publicized ? It does not fit the government's agenda ! See the entire details at " Principia Scientific" .
- Milankovitch Cycles
michael sweet at 09:14 AM on 3 February, 2020MAP,
In general, if you think of a question scientists have answered it.
If not for humans the descent into the next glacial period would have started several thousand years ago. The hockey stick shows declining temperature until 1850. The descent would have been faster but human land use slowed it down.
- 2019 in climate science: A continued warming trend and 'bleak' research
Blueball at 08:00 AM on 23 January, 2020Sorry, I meant for this to be one post...
I am uncertain about this claim "twice as fast", shortly after this declaration, the Liberals announced a climate emergency. I am not sure what this amounts to but the rhetoric has certainly notched up recently.
When I visit Www.yourenvironment.ca I can look at the recorded temperature of any city in Canada dating back upto 150 years and I was expecting the hockey stick graph I see so regularity here, there and everywhere. But the graph is completely flat. No discernable rise in temperature in any city in any province.
What am I to believe? Who am I to believe?
- Hockey stick is broken
MA Rodger at 00:53 AM on 18 January, 2020alisonjane @166,
The paper you found had the broken link in the OP is McIntyre & McKitrick (2005) 'Hockey sticks, principal components, and spurious significance'
- Hockey stick is broken
alisonjane at 12:06 PM on 17 January, 2020Just joined and wanted to read background on hockey stick. I tried Mcintrye 2004, but it just goes to AGU home page. Is there a correct link?
Cheers
aJ
- Climategate CRU emails suggest conspiracy
TomJanson at 08:32 AM on 15 January, 2020Hilarious. ignore what they did and focus on the fact that a Board "cleared them".
About as persuasive as when the police review board clears a police officer for shooting people without proper cause.
the hockey stick and climate gate emails are scandalous. they cherry picked the series they wanted, deleted embarrassing data, and sticky taped it all together to produce the most compelling picture they could.
it singlehandedly did more to undermine climate science than anything else.
and we see no acknowledgement. No contrition. Just this whitewalling garbage that "they were cleared".
and you wonder why people have doubts?
- 2019 in climate science: A continued warming trend and 'bleak' research
michael sweet at 04:27 AM on 14 January, 2020Ritchieb,
I understand your frustration. Imagine how Michael Mann and James Hansen feel after trying to deal with this issue for 30 years.
The Earths energy imbalance and ocean heat content have only been accurately measured for a few years, less than 2 decades. There are no proxies to extrapolate the data into the far past. There are still large error bars for these measurements. The deep ocean (over 2,000 meters) is poorly measured.
By contrast, there are accurate thermometer temperature measurements going back to 1880. Proxies have been found that accurately go back over 800,000 years and much further with poorer resolution. There is a reason deniers deny the Hockey Stick graph so much. Current estimates of the world temperature anomaly have error bars of hundredths of a degree. People do not understand what 2E18 joules means. I have a very strong scientific background and 2E18 joules does not have much meaning to me except it is a lot of energy.
As you point out, many people do not recognize that 2C will have big effects. I remember 10 years ago I wondered if I would live to see obvious sea level rise, more fires, increased storms, Antarctica melting and other effects (I expect to live to 2045). Here in just 2020 we see all of those effects already. Scientists seriously underestimated what effects 1C would have. Remember that only a 5C decrease in temperature means a mile of ice over New York! The last time carbon dioxide was over 400 ppm sea level was 20 meters higher!! (that will not happen overnight, do you care about your decendants in 300 years?).
It was recently pointed out here that 2C world average means 4C over land which is 7.2F over the entire USA!! I knew all the math but had not connected all the dots to see how much change F 2C really was. We are heading for most likely 3C by 2100 (more after that!) which is 11F every day all summer! Are your audiences really prepared for 11F? How could you visit Los Vegas half the year?
The deniers will deny whatever measurement scientists make. EEI and OHC would make no difference. I try to focus on the effects we all currently see. Point out that they will get worse over time. Here in Florida people moan about 10 inches of sea level rise. Can Miami Beach continue to exist when they already have 8 inches of water in the streets? Fires worldwide are obvious and people know about them. Storms like Harvey, Florence and Sandy are unprecedented and people worry. They have had three 500 year storms in the last 3 years in Houston.
If you are speaking to the public use the numbers you are most comfortable with. One talk I heard used pictures of people and had no data. The speaker found people did not relate to data no matter what it described but related to stories of people whose homes were flooded or Koalas killed in the thousands. One moving picture showed the speakers' friend who lost their home in the Paradise fire and is now a climate refugee in the USA. This October I went diving in North Cuba and Cozumel, both world class coral reefs. Over 90% of the coral was dead in both areas.
Use what you find relates best to people. If you find you are successful in reaching people come back here and tell us what works best for you.
- Here Are 3 Climategate Myths That Have Not Aged Well
Eclectic at 17:52 PM on 2 December, 2019Nyood,
to add to Philippe's and Nigelj's comments, I shall yet again be rather tiresome to readers, in once again pointing out your major errors.
Lindzen and Curry are intellectual failures. And it must be very sad (for any true skeptic) that you are forced into the corner of admitting they are "the best" of the opposition to mainstream science.
Dr Curry is a minimizer who goes outside of scientific truthfulness, in order to give her uncritical followers the impression that hardly any global warming is the result of the Greenhouse effect. She creates a cloud of confused ideas ~ rather like the way a squid creates a cloud of ink to conceal things.
Prof Lindzen was a scientific force in the 1980's , but in the past decades his (initially reasonable) Iris Hypothesis has proven to be wrong, and his future projections of global surface temperature have proven to be very wrong. Worse still , he seems to have fallen into a religious belief that Jehovah would not permit the Earth to warm by more than a fraction of 1 degree. Quite unscientific.
Please note that I am not saying Lindzen and Curry are unintelligent or legally insane. The question of their intellectual sanity is arguable.
Nyood , it must be disappointing for you, that you cannot suggest anyone 'better' than Lindzen or Curry. Nor am I aware of any 'better' contrarians, capable of providing even a small amount of evidence to challenge the mainstream science.
And I will not bother to detail all the falseness of your ideas about the Hockeystick. It is one more area where you seem very reluctant to educate yourself ~ likewise with Climategate !
- Here Are 3 Climategate Myths That Have Not Aged Well
MA Rodger at 18:43 PM on 1 December, 2019nyood @28,
I fear you rely on the commentaries of climate change deniers rather than the source documents they cherry-pick from.
Tom Wigley was taking issue with Kevin Trenberth in 2009 not 1997 (1997 also the date of the hockeystick work) and it was an entirely civilised and understandable interchange (although the actual e-mail thread does suggest that there was some history to the interchange).
Wigley argued that the global temperature evolution 2000-10 could be explained by ENSO, volcano & solar variation (as per Foster & Rahmstorf 2011) but this was not entirely what Trenberth was saying (note the CERES reference). Then Trenberth responds pointing this inexactness out with perhaps allusions to some past interchange.
I fail to see how this 2009 interchange in any way relates to uncertainty in climatology being kept private, unless it is within the febrile mind of a climate change denier.
- Here Are 3 Climategate Myths That Have Not Aged Well
nyood at 02:16 AM on 1 December, 2019MA Rodger @25
You try to relativise the harsh critic by Wigley with the concluding sentence:
"Wigley's response is robust because that is how academics fire off at each other."
To me, you attempt to downplay the criticism here and putting the email in a larger context like you did with your post, does not change its explanatory power whatsoever.
The message of Wigley is crystal clear, alarmed and referring to general scientific principles and ethics and exactly the high responsibility we are talking about. Therefore, other users already tried to discredit Wigley himself as obsolete and dangerous, standing in the way of the 11; skipping your attempt of just downplaying the message of Wigley.
What Wigley foresees here is the onset of political thinking and acting, documented by numerous emails of the coming years. Wigleys apprehensions will be confirmed and peak with Mann´s Hockeystick.
This is another example from 2009 where uncertainty is expressed, but must never be admitted in public:
M.Mann to K.Trenberth:
"Thanks Kevin, yes, it’s a matter of what question one is asking. To argue that the observed global average temperatures of the past decade falsifythe model projections ..., as the contrarians have been fond of claiming, is clearly wrong. But that doesn’t mean we can explain exactly what’s going on."
T.Wigley continues:
"Kevin,I didn’t mean to offend you. But what you said was “we can’t account for the lack of warming at the moment”. Now you say “we are nowhere close to knowing where energy is going”. In my eyes these are two different things—the second relates to our level of understanding, and I agree that this is still lacking."
- Here Are 3 Climategate Myths That Have Not Aged Well
blub at 23:28 PM on 29 November, 2019I have a couple of comments to add regarding the part: The most recent and robust such reconstruction was completed by a team of over 5,000...which produced the following chart of global temperatures over the past 2,000 years. It shows temperatures today rapidly rising above the historical record like the blade of a hockey stick.
This study is based on proxy and some real measurements, manly tree rings. Proxy measurements are not significant due to meassurment errors. Nobody has actually measured the temperature on earth with sufficient little error before about 200 years ago, therefore causality of a proxy and a model is just impossible. A statistically based study based on proxy is unsuitable because every single conclusion is insignificant by definition.
Nobody is questioning global warming, but the methods and conclusions drawn are highly questionable. Way to less data and physical understanding. Apart from high energy physics, about every physical and chemical processes possible (probably billions) are happening on earth, which may influence climate. It is just that simple, no conclusions have to be made without sound understanding. This field of study is extremly complex and statistically averaging data will only add confusion.
The authors of this study mention:"Our inferences on the multidecadal GMST variability for the Common Era are robust to all these permutations (Supplementary Figs. 17–20). Nevertheless, we cannot rule out biases due to errors in the individual proxy records and the unequal spatiotemporal distribution of proxy data (Supplementary Fig. 1). Warm-season-sensitive records from the Northern Hemisphere high and mid latitudes dominate the collection of proxy records21 , thus our results may be biased towards this region and season,..."
In science or in humans in general there is something as confirmation bias, which seems to be advancing due to the internet and social media...
- CO2 effect is saturated
Eclectic at 05:26 AM on 25 September, 2019PringlesX ,
sorry, but your "sleeping bag" analogy simply doesn't fit the situation.
And there seems to be no connection between Greenhouse and the "hockey stick".
Since the Hockey Stick has been well validated by a number of subsequent scientific studies (even without tree-ring data) . . . then it sounds like "Manhattancontrarian" is probably just one of those many clickbait blogsites. You know ~ one of those clickbait sites with stuff like "Scientists prove Earth is flat" . . . "Infrared photos show English Queen is a Lizardperson" . . . "Russian lasers show Moon is green cheese" . . . and so on.
Really, PringlesX, if Mr Manhattancontrarian has some astounding new earth-shattering information on The Hockey Stick (info is which strangely unreported by the world's media) ~ then please, please give us readers a succinct summary of it. On the appropriate SkS thread, of course. Let's not go down the brainless clickbait path !
- CO2 effect is saturated
GwsB at 19:49 PM on 3 September, 2019In the discussion about the effect of CO2 on the climate there are certain images which may be said to incorporate the essential part of the arguments. Such iconic graphs are the driving force in changing one's view of the world. A good example is the sun with the planets rotating around it. This stopped all phantasies about what happens at the edge of the (flat) earth. This iconic image made it possible to sail Westward in 1492 in order to reach India.
For CO2 the iconic image is the rippled increasing graph of the CO2 concentration as measured at Mauna Loa from 1960 onwards, sometimes extended over the past thousand years by observations from tree rings and ice cores to obtain the "hockey stick". For the influence of CO2 on climate the iconic graph is given in Wikipedia https://en.wikipedia.org/wiki/Greenhouse_effect (last updated 23 August 2019)
Caption: "Atmospheric gases only absorb some wavelengths of energy but are transparent to others. The absorption patterns of water vapor (blue peaks) and carbon dioxide (pink peaks) overlap in some wavelengths. Carbon dioxide is not as strong a greenhouse gas as water vapor, but it absorbs energy in longer wavelengths (12–15 micrometers) that water vapor does not, partially closing the "window" through which heat radiated by the surface would normally escape to space."
The graph shows that the effect of water vapour, H2O, is much greater than the effect of CO2. It also shows the saturation of the absorption due to CO2. The first argument (about water vapour) is valid. We can't do anything about the concentration of H2O though, except perhaps by increasing the temperature. So we will just have to accept this effect. The second argument (about saturation) is also valid. The absorption at wavelength 4 - 4.4 μm is 100% over most of the region, and so too at 12-15 μm. In comparison with H2O the peaks of CO2 are very steep and the wings have little effect. It is only the thin peaks at 2 μm and at 4.9 μm which will grow significantly if the concentration of CO2 is increased.
The basic physics is simple: A photon of light at a wavelength of 14 μm is passed from one CO2 molecule to the next performing a kind of random walk until it exits the atmosphere. There are two exits, outer space and the earth. Saturation means that a photon starting from the earth has very little chance of exiting to outer space. It is almost certain to exit the atmosphere to the earth, where like shortwave radiation it will be re-emitted at a different wavelength. Even if the new wavelength with probability a half lies in an absorption band of CO2 or H2O, this only means a stay of execution. In the end the photon will escape to outer space through one of the long wave gaps in our atmosphere.
The graph in Figure 2 in Zhong & Haigh (2013) is perhaps more precise, but the vertical scale runs over twelve orders of magnitude, (twelve orders of magnitude is from one mm to a million km, or from one gram to a Megaton). The result of this scale is that I am not able to comprehend the significance of the graph. Figure 5b, bottom, gives the difference between the radiative flux for the present level of CO2 (389 ppmv) and a level increased by a factor 32 (12500 ppmv). The total negative impact is almost cancelled by the positive impact around 15 μm. This impression is reinforced by Figure 6a where the graph is practically horizontal beyond 400 ppmv. In Figure 6b we see an increase in the slope beyond ten thousand ppmv. In that graph the horizontal axis is logarithmic and runs up to a million ppmv, which is a pure CO2 atmosphere. These results are based on models and therefore should be taken with a pinch of salt.
The conclusion is: The direct impact on the temperature of the earth of the increase in CO2 from the present level of around 400 ppmv is relatively small. This is due to saturation at the bands where CO2 absorbs long wave radiation.
Is the graph above misleading? It is described as "(Illustration adapted from Robert Rohde.)". Clicking on Robert Rohde results in the message: www.globalwarmingart.com refused to connect.
If anyone knows a better graph I would be very happy to obtain a link.There is a nice course on climate denial presented by the University of Queensland https://courses.edx.org/courses/course-v1:UQx+Denial101x+1T2019/course/ The course is free of charge and contains a huge amount of good information on climate change. Unfortunately the course does not address the topic of the absorption of CO2 at specific wavelengths. Neither does the basic rebuttal by dana 1981.
The near saturation of CO2 at present levels makes it difficult to convince people to vote for a cut in CO2 emissions or for a tax on such emissions.
- Hockey stick is broken
TVC15 at 07:09 AM on 27 August, 2019I posted in a forum about the purpose of the "Hockey Stick" study and the fact that numerous proxy studies have been performed confirming the original hockey stick conclusion: that the 20th century is the warmest in the last 1000 years and that warming was most dramatic after 1920.
A denier swooped in and made this snarky comment and expects me to make a statement answering their question.
Which is immaterial and irrelevant.
State with specificity what the exact average global temperature should be now and the peer-reviewed science to support your conclusion.I have no idea how to answer as I don't know what the current global temperature "should" currently be?
- Models are unreliable
Rob Honeycutt at 08:45 AM on 12 August, 2019Or, here with the following passage...
"Claim 1.5: Carbon dioxide in the atmosphere may increase the thermodynamic mean temperature of the ground by 2.1-4.1°C
According to the claim 1.5 increase of carbon dioxide in the atmosphere causes progressive increase of the global mean temperature of the lower atmosphere (the hockey stick theory). The hockey stick theory proves unfathomable ignorance on radiative heat transfer because influence of increase of linear emission coefficient on radiation isn’t progressive but asymptotic."
Again, maybe it's just the translation but this comes off as word salad.
1) What's the point of continually repeating the phrase "thermodynamic temperature"? Ironically, they state on page 8, "It is undisputable that increase of the thermodynamic mean temperature of the ground (hence forward the Temperature)..." but then continue to use the full phrasing another 30 times over the following 85 pages. In fact, their only use of the term "thermodynamic" comes when they use the full phrase "thermodynamic mean temperature." It's just weird.
2) 2.1-4.1°C isn't "ground temperature" it's surface temperature. Yes, there's a difference because surface includes sea and land, but "ground" would only refer to land. But maybe that's a translation issue.
3) The hockey stick isn't the same as greenhouse gas theory. The hockey stick is merely a graph of the past 1000+ years of global temperature.
4) "[The] influence of increase of linear emission coefficient on radiation isn’t progressive but asymptotic." This is gibberish to me.
- 'No doubt left' about scientific consensus on global warming, say experts
Rob Honeycutt at 23:46 PM on 30 July, 2019Kuidaskassikaeb... This would just be yet another hockey stick. The first hockey stick was done by Mann, Bradley and Hughes back in 1998/99. It was merely a collection of local and regional temperature data series all combined that stretched back over the past 1000 years to show the changes in global temperature. Since then there have been lots of newer studies with refinements and the same answer comes back: human activities are rapidly warming the planet. And all that is merely a confirmation for what scientists already expected going back through 100+ years of science.
- Planetary health and '12 years' to act
Daniel Bailey at 02:55 AM on 24 June, 2019
Global temperature reconstructions show this to be untrue.

"how can anyone conclude this current round of warming is entirely manmade?"
Because actual scientists, using the well-understood physics of our world, have established that it is only when the anthropogenic forcing is included that the observed warming can be explained.
Natural vs Anthropogenic Climate Forcings, per the NCA4, Volume 2:

Fun Factoid: Changes in the sun's output falling on the Earth are about 0.05 Watts/meter squared.
By comparison, human activities warm the Earth by about 2.83 Watts/meter squared (AR5, WG1, Chapter 8, section 8.3.2, p. 676).

"What also troubles me is the fact that the Medieval Warm Period was written out of the history books by the IPCC hockey stick graph. As well the impact of the 500 year period of cooling known as the Little Ice Age"
Another meme. Here's the "Hockey Stick For The Most Recent 1,700 Years", from the Trump Administration in 2017:

"the Earth was a lot warmer when the Vikings settled Greenland and Iceland"
Alreay refuted, but here's global temperatures with the period of the Viking occupation of Greenland highlighted:

And here's the temperatures from the GISP2 core from Greenland, with the instrumental temperature measurements taken from that same location added in for context:

"the Earth was a few degrees warmer during the Medieval Warm Period than it is today, then the polar ice cap was smaller and thinner than even now"
Your temperature claims were already refuted, but we have observational data to 1850 and proxy data going back millennia documenting Arctic sea ice extent changes over time.
For example, here's the last 1,500 years, from NOAA's Arctic Report card 2017:

You'll need to raise your game to compete in this venue. In this venue, the onus is on YOU to be able to support your claims (each claim) with source citations, preferably to credible sources. Further, many of your claims are already refuted on separate posts here (thousands exist, use the Search function to find the most appropriate post to make your claims and to stake your reputation on).
I'm sure that the moderation staff would prefer to not intervene here, but I'm equally sure that they will if you continue to post what is essentially a Gish Gallop of memes refuted many times before (PRATT).
Read the Comments Policy and construct your comments to comply with it and my advice to you and all will be fine.
- Planetary health and '12 years' to act
Philosopherkeys at 01:15 AM on 24 June, 2019Being that the ice core samples from Greenland show that over the last 10,000 years, the earth has been on average 3 degrees celcius warmer than today, how can anyone conclude this current round of warming is entirely manmade? What also troubles me is the fact that the Medieval Warm Period was written out of the history books by the IPCC hockey stick graph. As well the impact of the 500 year period of cooling known as the Little Ice Age was not acknowledged by the hockey stick graph. Brian Fagan in his book, "The Little Ice Age" describes how glaciers in the European Alps or New Zealand in the Southern Hemisphere began growing once the earth began to cool. Entire villages and swaths of rainforest were obliterated by advancing glaciers. The hockey stick graph ignores the fact that the Earth was a lot warmer when the Vikings settled Greenland and Iceland. If as the ice core samples show, the Earth was a few degrees warmer during the Medieval Warm Period than it is today, then the polar ice cap was smaller and thinner than even now and quite possibly the alarm being sounded by certain climate scientists is uncalled for as this is a normal cycle that goes back and forth.
- Tree-rings diverge from temperature after 1960
MA Rodger at 22:04 PM on 8 June, 2019TomJanson @85,
The early reconstructions of pre-1880 temperatures were indeed dependent on tree ring data. Groveman & Landsberg (1979) was entirely tree ring data with a reconstruction back to AD1579 while Bradley & Jones (1993) did also employ ice cores in reconstructions back to AD1400, as did the Hockey Stick iteself (Mann et al 1998). But things have moved on a lot since then with many other proxy types giving confirmation that the tree ring reconstructions are providing useful data. The graphic below is from PAGES2k Consortium (2017).

The 'tree ring divergence problem' continues to be investigated but without resolution in sight. And those creating tree ring reconstructions are well aware of the issue. The tree ring reconstruction 'fit' to the instrument record is now a lot more impressive than that shown in the OP above. See for instance Fig 1b of St George & Esper (2019). (A rather tiny version of Fig 1 is below, 1a being the top graph.)

- Tree-rings diverge from temperature after 1960
TomJanson at 15:47 PM on 8 June, 2019I have read the article above and had a look at some of the papers. I’m just not sure why the pre 1880 tree ring data should be considered so reliable if nearly half the tree ring data after 1880 isn’t reliable and we don’t really know why.
as for the tree ring data being just one small piece, I thought it was quite important in producing the hockey stick? Without the trees is much more fuzzy isn’t it?
- The temperature evolution after 2016 suggests hotter future
MA Rodger at 21:28 PM on 19 March, 2019ThinkingMan @17,
The concept of a natural unforced climate cycle is part of the denialist armoury and is usually presented as a 60-year cycle. I think it gets lengthened to allow more abiguity when fitting it to data.
The sole basis of it is the global temperature record which can been seem as having peaks in 1880, 1940 & 2000 and dips in 1910 & 1970. Thus a 60-year cycle is proposed as causing these peaks and dips.

Those proposing the existence of such a 60-year natural cycle have failed to take the idea forward. Further the peaks and dips can be understood without the existence of some grand natural wobble.
Thus the so-called 'hiatus' of recent years can be explained by the impact of ENSO which is a natural wobble-maker. Yet such a natural wobble does not explain the slight cooling post-1940. This has more to do with a slowing of AGW positive forcings through those years and a massive increase in the rate of anthropogenic SO2 emissions. The 1940 peak is more of a challenge but over half of it results from forcing, most of this anthropogenic. And back to the 1880 dip, the volcanism during the latter part of the 19th century easily privide the dip without any 60-year wobble.
Another approach to finding a 60-year wobble is to seek evidence for the wobble within the known natural oscillation. As set out above, ENSO (& thus PDO) are not powerful enough to be a source of the size of wobble being talked about. One other candidate is AMO mentioned @16. AMO is an interesting phenomenon. It was fisrt identified within a proxy reconstruction of North Atlantic temperatures. This were part of the work that resulted in the famous 'hockeystick' reconstruction of Northern Hemisphere temperatures. And here's a thing - the AMO is not seen in the 'hockeystick', suggesting it too has not the power to provide a significant 60-year global wobble (IPCC AR5 also demonstrate the lack of power) although there is much work now showing the AMO is a true oscillation of roughly 60-year pitch.
- But their Emails!
nigelj at 12:02 PM on 4 December, 2018JP66, @ 21 & 22
"No. My quote was not previously released."
Yes it was. I found your quote on several other websites for example here, just by googling it and it certainly forms part of climategate according to them. Whether it does or does not doesn't actually seem that significant anyway, nobody is denying that it's real.
Why for example would it be wrong to stitch recent temperatures onto a paleo reconstruction? You don't say. I cannot see the problem. Science combines data sets all the time. Nobody has shown a specific problem in the way the data is stitched together, and obviously modern instrumental data is going to be more accurate than modern paleo data.
There were some criticisms of Manns statistics in the official enquiry, but this is a separate thing. Official reviews of his hockey stick did not say it was fundamentally wrong.
"and the original paper said it should only be a piece of the picture, but the posters here use it as THE proof."
Proof of what?
Like I said additional papers have been done using different approaches and found much the same result of a relatively weak MWP, so things do not hinge around M Manns original paper. This seems to be fairly compelling evidence relating to the MWP. Even if the MWP was warmer than today, what do you think that would prove?
"I will never post here again because it is apparent this site is against discussion. You just lost points in the war."
But your problem is you dont discuss things. You have not specifically addressed points people have raised above including myself. Instead you just repeat yourself and go onto new issues, and you just make assertions.
- But their Emails!
JP66 at 11:06 AM on 4 December, 2018No. My quote was not previously released.
A theory is valid until one piece of data invalidates it. 1 million papers become irrelevant if data invalidates the hypothesis.
The hockey stick graph is not a useful bit of data because it is too controversial and is based on a combination of proxy data and thermometer data. The NAS said it should not have been given the importance it was afforded, and the original paper said it should only be a piece of the picture, but the posters here use it as THE proof.
That is one example of why I remain on the fence.
People here are just as biased as the people on WUWT. For a layman interested in parsing the best evidence posters here are not helping.
- But their Emails!
barry1487 at 09:41 AM on 4 December, 2018JP66's cited email was part of the tranche hacked years ago.
Seems unlikely JP66 is reading the latest release, and instead is trawling contrarian blogs.
- Major PAGES 2k Network Paper Confirms the Hockey Stick
Sarmata at 01:12 AM on 7 November, 2018THen why so many papers about so many places measurements shows no unusual warming or cooling?
Could you elaborate on that?
- Republican lawmakers react to the IPCC report – ‘we have scientists’ too!
One Planet Only Forever at 00:32 AM on 23 October, 2018GregDance,
I agree, and would add that the human developed socioeconomic-political systems are the real problem because they discourage people from helping others. And they allow misleading marketing to influence people to develop and hold onto unjustified greed or intolerance based opinions (those opinions that conservatives would like to preserve).
Our sports have all been constantly developing improved regulations, monitoring and enforcement to sustain the legitimacy of the games played.
The Conservative-Right fight against any correction or regulation of their behaviour. They like systems that let them get away with actions based on what they have developed liking and dislike for. They choose to be very difficult to correct (like the bully hockey player who will not stop punching other plaayers, and whose team fans and management defend and excuse because they like the other things the player does or the impact on the games when the player punches someone from the other team)
In the Feb 29, 1960 issue of Time magazine Ayn Rand stated that “If any civilization is to survive, it is the morality of altruism that men have to reject.” and “Capitalism and Altruism are incompatible ... capitalism and altruism cannot coexist in man or in the same society.”
Ayn Rand's observations were correct, but she came to the wrong conclusion. Since every human can understand that it is better for the future of humanity if they behave altruistically, the correct conclusion is that capitalism discourages the development of altruism and encourages the development of anti-altruism if it can be gotten away with.
Capitalism that is not fully governed by altruism can be expected to be detrimental to the future of humanity. Anti-altruistic capitalism will create a hiatus in the advancement of humanity, or create damaging set-backs like the unsustainable burning of fossil fuels already has. Technological development is not necessarily advancement of humanity. It can actually be the opposite.
Any competition for impressions of superiority relative to others encourages the development of anti-altruism (egoism). It is seen all the time. And rules and enforcement to limit behaviour need to be developed whenever competition driven anti-altruism creates the potential for harmful results.
More potential for personal benefit creates more temptation to be anti-altruistic, because the less altruistic have a competitive advantage (advantage increasing the less altruistic they can get away with being). This is especially true in mass-advertised capitalism and politics.
- Does breathing contribute to CO2 buildup in the atmosphere?
Eclectic at 22:37 PM on 8 September, 2018MA Rodger @58 , as you well know, the "huge human bodily contribution of CO2 to our planetary atmosphere" is one of the many falsehood memes which is deeply imbedded in certain sections of the community, and is one which is a very uphill matter to correct. Not impossible to correct, but quite difficult.
Apropos nothing: I was looking through the Curry blog "ClimateEtc" just the other day, and found a comment that will amuse you. It was by "Russell Seitz" (regarding The Hockey Stick and its later replications/confirmations) :- "We are all indebted to [Mr X.] for so vividly illustrating the hazards of ignoring the climate science literature for decades on end."
~ Mr X. was one of the more intelligent of the crackpots to be found often in the blog's comments columns . . . but really, almost any denialist's name could have been inserted in its place.
- There is no consensus
scaddenp at 17:15 PM on 26 April, 2018"Facts are not arrived at by consensus"
This is a very tiresome strawman argument. We agree. However, the important facts are: a/ the consensus does exist and b/ scientific consensus (especially when strong), is the best guide to policy. A true scientific consensus is very seldom wrong and you would be an idiot to bet the planet on it being wrong.
Citing pre-scientific examples of societial consensus (a very different thing) is pointless.
"One of Micheal E. Manns (the hockey stick guy) claims in the defamation lawsuit against Mark Styen,et al., was that it is (or should be) a crime to defame a Nobel Prize winner." Citation please. What were his actual words?
- There is no consensus
windrunner at 13:42 PM on 26 April, 2018As this is your first post, Skeptical Science respectfully reminds you to please follow our comments policy. Thank You!
Found this forum on a link posted on a POW(Protect our Winters) EM article I recieved. I consider myself an open minded person and willing to listen to many points of view and draw my own conclusions from the facts presented, regardless of my personal opinions. My views have changed on several things over the years. Winston Churchhill, hardly a scientist but certianly one of the biggest influencers on the course of 20th century history, once said that "if you are not a liberal in your twenties you have no heart, and if you are not a conservetive in your forties you have no brain."
The heart creates passion, and passion emotionalizes arguements, obscuring the validity of points of contention. One of the obscured points is the method that one of the cited studies was conducted, the Doran study, conducted by Margeret R.K. Zimmerman, as a grad student under Doran's direction. Points that make you go huh?... 10,257 surveys were sent out. 3,146 bothered to respond. Does that mean 7,111 questionaires were not delivered? Or that the intended recipients had no opinions, yea or nay? Only 30%, give or take, bothered to respond. Only 79 respondents answers were eventually used to come up with the 97%- the other responses supposedly did not come from "climate scientists" so they were not used. Why were they even sent? There are other questions that arise from the conclusions that were drawn from this study but I think the point is made. When any survey requires closed answers the results must be considered with a skeptical eye.
Facts are not arrived at by consensus. If this were true, the earth would still be flat, and Giordano Bruno's burning by the Vatican Inquisition in defense of geocentrism would be justifiable. Aristotle's expansion on spontaneous generation were accepted as fact for over 2,000 years! Neaderthals are not ancestral to modern man! Micheal Bradley's assertation of Neanderthalic genitics in "The Iceman Inheritance" was laughed at and later decried as racist. Indeed, the scientific community's persecution of any one who questions the dogma of the alarmists who have made substantial financial gains espousing the global warming/end of the world would be entirely defensible. One of Micheal E. Manns (the hockey stick guy) claims in the defamation lawsuit against Mark Styen,et al., was that it is (or should be) a crime to defame a Nobel Prize winner. Of course he is not, and it is not. This claim was dismissed from the suit. The financial gains to be garnered by silencing any thought contrary to the prevailing AGW theocratic dogma is too great to be allowed a voice. This site has poo-poo'ed Judith Curry and some of her claims, but I have found more open minded and even handed writings on her site, on both sides of the issue. Humankind thinks that they are of gret consequence but the truth is we are like all other afflictions this globe has suffered, and when she tires of us she will shake us off like raindrops and without a second thought.
- 2018 SkS Weekly Climate Change & Global Warming News Roundup #16
nigelj at 07:20 AM on 24 April, 2018Other studies of MWP hockey sticks here.
- 2018 SkS Weekly Climate Change & Global Warming News Roundup #16
nigelj at 07:15 AM on 24 April, 2018Climate denialists still go on about the alleged " broken hockey stick" despite 1) The fact that Manns study wasn't shown to be incorrect 2) Numerous other studies have found essentially the same hockey stick and 3) Manns study is old now from 1998, and global temperatures are now significantly higher, so an even bigger hockey stick.
But denialists don't get this for god knows what perverted reasoning.
The media doesn't help, because it always highlights controversies without full context, and doesn't do follow up articles on what more recent research shows.
- Explainer: The polar vortex, climate change and the ‘Beast from the East’
MA Rodger at 21:36 PM on 16 March, 2018Jonbo69 @3,
I would suggest there is a vast level of complexity in what you ask but it can be knocked into shape.
The complexities of Polar Vortex-Solar Minimum linkage has been utilised by some denialists to create anti-AGW messages. So, for instance, this post at denialist site TheHockeySchtick rests on three published papers which are not entirely relevant or conclusive or credible.
Such denialist posts are often response to messages linking intense cold snaps of winter to our planet's atmospheric circulations that are evidently being impacted by AGW. Thus the likes of this report of an AAAS meeting results in the deniosphere responding with the likes of this nonsense at the planet Wattsupia.The complex variability of the Polar Vortex is in no way solely associated with solar output. Indeed, it is a relatively minor player. Thus Kim et al (2014) add the helpful concluding comment with solar activity the tail-end-Charlie of the list of possible factors:-
"(N)ote that Arctic sea-ice loss represents only one of the possible factors that can affect the stratospheric polar vortex. Other factors reported in previous works include Eurasian snow cover, the Quasi Biannual Oscillation, the El-Nino and Southern Oscillation and solar activity. Systematic consideration of these factors would extend our understanding of climate variability, possibly leading to the improved seasonal forecast Nonetheless, the relative contributions of each factor have not been systematically examined. As these factors may be interrelated, they may not control the stratospheric polar vortex independently. These issues must be examined further in future works.
Linkage between Polar Vortex and Solar Minimum is more a subject of research (eg Maycock et al (2015), Chiodo et al 2016) because the regional impact of Grand Solar Minimums is missing from the standard climatological assessment. Yet these papers make no startling claims and are setting the solar-minimum-effects within future AGW which is probably why denialists wouldn't dream of touching them with a barge-pole.
- What role did climate change play in this winter’s US freezes, heat, and drought?
Alchemyst at 07:12 AM on 9 March, 2018Nigelj 7:22 am 2 march 2011
"The article I referenced took no liberties with the data. Climate scientists have apparently postulated that the current cold weather in Europe is related to current high arctic temperatures and jet stream changes thats all. Its quite a good theory. Are you saying they are not entitled to postulate a theory? Remember we have empirical evidence that the jet stream has changed.
Nobody has claimed all storms in Europe are being caused by recent climate change. The recent warming trend in the artic is probably just making them more frequent or longer lasting, as the changed jet stream lets more cold air move south than normal. This may also have happened in the 1940s and 1960's, but its pretty obvious that higher temperatures in recent decades can only make it happen more frequently now."Nigel, please read page 2 of the refhttps://www.rmets.org/sites/default/files/abstracts/Mar/16032013-burt.pdf
In it there is a red graph that shows the 1962 incedent in context with historical events of which there were many at about 12 year intervals. It also shows that there has been no further similar events in the UK since 1963 date. the graph also show a slight hockey stick. Compared with the pre 1963 events, the 2011 event hardly registered in the graph.
The argument has not been that the arctic is getting warmer but that this is affecting western europe. The graph shows clearly that the so called more frequent events are not materialising. this is not computer modelling papers but real measurements. This is not surprising since as the arctic is warming, there is less difference in the temperature between the arctic and europe.
Please read the document fully as it predates all this new stuff by 4 years, we have seen documentaries about it
If you notice a set of headlines is given in another paper on this topic 7 march
https://www.skepticalscience.com/explainer-polar-vortex-beast-from-east.html
None of the British Papers did the same mistake of DW and linking the Beast from the East to Climate Change, because all of the Brits know that these storms were worse and more frequent before climate change. they have either lived through them or had their grandad/dad tell them and every so often theBBC will have a documentory.
We have empirical evidence that since global warming these storms are less frequent and milder.
- How to Change Your Mind About Climate Change
michael sweet at 21:07 PM on 17 February, 2018Alchemyst,
I was commenting in the same spirit as your post I was replying to.
Medical papers are a special case where comanies with much money to gain have gamed the system. Scientists have identified that there is a problem and are working on solving this problem.
By contrast, all the money in climate is on the denier side. Seminal papers have been reproduced many times. Arrhenius 1896 paper is still in the IPCC range and he did his calculations with a pencil. Many projections of temperature rise have been shown to be within the range of error after 30-50 years wile denier claims of flat ot cooling have been proved incorrect. Review the temperature comparisons here at SkS or at Realclimate. Jacobson has hundreds of citations that get about the same result as he did on using renewable energy. While there are undoubtedly errors in Jacobson's work, the replication of his work by so may others shows he was on the right path.
The consensus of evidence is what shows us that Climate Theory is on the correct path. Yout claim is false.
I see that as I expected, you trust experts most of the time. It is only when you do not like the result that you claim that they are always incorrect.
You inform no-one when you claim that peer reviewers do not re-do the papers they review. It is not their job. They are supposed to provide a filter to remove errors but they are not expected to be perfect. The good journels (like Science and Nature) do a pretty good job of removinng the chaff. Lower quality jourals are not as good.
Mann's hockey stick paper has been reproduced by other people using different data hundreds of times. How much replication do you need? Every global climate model (dozens of different models) makes a projection of future temperatures. That is in addition to the papers that sepecifically address the climate sensitivity by other means like comparison to past temperatures.
Replication by obtaining the same result by a different path, as has been done repeatedly in climate science, is better than re-doig the experiment. Your insistance on re-doing things over is rarely done.
Your argument is incorrect. Your claims do not withstand the slighest examination. You should apologize to the hard working scientists you have insulted.
- 2018 SkS Weekly Climate Change & Global Warming Digest #5
One Planet Only Forever at 07:37 AM on 8 February, 2018nigelj,
Thank you for the reply. I have found these comments to be very helpful as I try to increase my awareness and understanding of what is going on, particularly the ethics issues that have been unintentionally exposed by climate science.
My concern with competition is 'allowing unsustainable harmful behaviour to occur in the competition'. Every game has developed rules for exactly that reason (and most of them constantly add and edit rules as new unacceptable behaviour gets identified. The more reward that is at stake in the game, the stricter the monitoring and enforcement becomes - except in the games of economics and politics (Olympic Soccer/Hockey has drug testing and very experienced Referees, pick-up games of soccer/hockey rely on the good nature of all the participants with some participants penalized or banned from playing for good reason).
The global economy is the biggest game on the planet and should have the strictest monitoring and enforcement to ensure that only sustainable helpful activities get to compete; the more wealth at stake, or the more potential for harm, the more vigorous the monitoring and enforcement needs to be.
And I find terms like conservative and liberal to be gross generalizations that distract from the important focus on whether a person is being helpful or harmful. The objective has to be improving the future for all of humanity. Conservative people can be helpful by restricting freedom of people to do whatever they may want to try to get away with, and Liberal people can be harmful by demanding freedom to believe and do whatever they want.
What I currently see as a very serious developing problem is the Unite the Right movements that clearly strive to build a United base of support by tempting people to be greedier and less tolerant. Those groups claim to be Conservative because they know some people are almost sure to continue to vote for what they think is Conservative, not considering if they are being helpful or harmful, just doing it because that is what they learned to do and they are not interested in trying to learn any more.
Conservative/Liberal is also fairly ineffective because the key is limiting of the behaviour of the individual. Libertarians are bit of a combination of both and often claim that competition will 'bring out the best in them'. Without a shared understanding of what is helpful, and therefore allowed in the competition, what they consider to be 'Their Best' is exemplified by the likes of Trump, a Winner they are proud to support.
- Fake news is a threat to humanity, but scientists may have a solution
nigelj at 05:07 AM on 31 December, 2017Zippi62 @23
"Climate science doesn't base their findings on Michael Mann's "Hockey Stick Graph". Do they?"
No they dont, because it was only one early study and of average quality. The IPCC reports mostly do not to rely on single isolated studies, because that would obviously be sub optimal. I would have my doubts myself.
The IPCC rely on multiple studies whenever they can, and this is why a lot of research is done, like double entry book keeping in accounting it helps identify errors in research and improve research.
We have about 10 other more recent and thorough studies on the medieval warm period, that find very similar results and similar shaped hockey stricks to Manns original study, for example by Briffa, Esper and many others. Refer medieval warm period on wikipedia for lists of published research. The studies all take different approaches to researching the issues.
You think this is some giant conspiracy? If so,that is where we part company completely and irrevocably. I live in the real world (which is hard enough) not the Brietbart fantasy world.
- Fake news is a threat to humanity, but scientists may have a solution
Zippi62 at 14:33 PM on 30 December, 2017" ... The Fox Newsification of America ... "?
" ... 71% of Alabama Republicans believed the allegations were false ... "?
Does the writer (Dana) really know 450,000 republicans (650,000 voted for Roy Moore), who knew the allegations were false? C'mon! That's based upon a poll of a few thousand people.
Climate science doesn't base their findings on Michael Mann's "Hockey Stick Graph". Do they? His graph surely made it into the UN IPCC's Policymaking recommendations even though it wasn't "consensus" science information.
Are we talking political science or climate science?
I like the idea of a RED TEAM/BLUE TEAM forum. It surely wasn't the choice of James Hansen, Al Gore, or Michael Mann over the past 30 years. The science was "settled" to them.
I find this article to be based upon arrogant assumptions, just as is 'climate sensitivity to raised CO2 levels'. There is no consensus on the ideal CO2 level of our atmosphere.
- Greenhouse gas concentrations surge to new record
nigelj at 07:38 AM on 2 November, 2017I would suggest putting the two emissions graphs in the article right under the opening statement. This would answer the valid comments of both OPOF and eschwarzbach.
My own criticism is the first graph of 22000 years is confusing as it omits the CO2 hockey stick since 1900. You have to mentally join the two graphs. In fact I think you would get the essential message across fine with just one composite graph, even if it has slightly less detail on it.
But its a nit pick and very good article overall.
- Climate and energy are becoming focal points in state political races
nigelj at 07:38 AM on 11 October, 2017NorrisM @70
Regarding the carbon price issue. Yes I agree only about 30% of Americans believe we are changing the climate, but that is not the salient point. From Pew about 65% want more done about fixing the climate problem and implementing renewable energy, and this is more of a mandate for a reasonable carbon price etc. The discrepency in views is odd, but may say suggest more people think we may be warming the climate than are prepared to openly admit it.
However I agree you should start with a sensible carbon price simply because its politically easier. It can always be increased and should be increased in a couple of stages until its at the proper level.
Karl Popper promotes incrementalism and any one could agree with that in general terms. Blundering in with rapid reforms can sometimes be unwise.
But he was referring to social and economic ideas, not environmental disasters that might require a more rapid response by their very nature.
Its also a question of commonsense. Some things in the economic and environmental sphere are so obvious they deserve a rapid, simple response, others demand it due to circumstances, others require careful progress in stages, others can be dealt with by an experiment, then rapid implementation. Thats is your problem with philosophers, what they say is so general its often not a lot of use.
"But the other thing that I do not see with most commenters on this website (with the exclusion of nigelj) is an appreciation (or even reverence) for what FF have provided to us."
Please be careful there Norris. I dont recall ever saying anything like that, or that fossil fuels have been a wonderful thing. I may have said in passing that they powered the industrial revolution. But nobody on this website would deny such a thing anyway.
Sea levels have not been rising for 200 years. They were falling slightly from about ad 1500 - 1850 as below.
www.realclimate.org/index.php/archives/2016/02/millennia-of-sea-level-change/
Anyway the point with sea level rise is the accelerating and obvious uptick or hockey stick since about 1900. Its steeper than anything for millennia, and is caused almost entirely by burning fossil fuels.
I dont know why you keep writing essays on the past benefits of fossil fuel energy. Nobody denies the part they played in our history, and value they have had compared to burning wood for example. But that is past history, and clearly we now have alternatives. The electricity is the same regardless of the source. The same watts, volts, amps and all that stuff.
You also need to remember oil and coal is essentially very finite, and fracking is basically scaping the bottom of the barrel. Although peak oil is hard to pin point ,we are probably close, and it will definitely come sooner or later because oil is finite. So sooner or later we have no alternative than to move to other forms of automotive transport.
I suggest you look at the article today 11 sept on climate models. Note that they have predicted temperatures quite well on the whole. There are plenty of graphs to look at.
- The Mail's censure shows which media outlets are biased on climate change
MA Rodger at 16:59 PM on 1 October, 2017NorrisM @41.
It may be correct to say that there is differing opinion as to when is appropriate to define "pre-industrial" and thus at what level to set as the "pre-industrial" temperature, but I'm not aware of any disagreement over the temperature rise since 1900. Consider the SAT records, ((HadCRUT, GISS, NOAA, BEST) they each present a temperature anomaly for the late 1800s (perhaps the average for the 1890s would suit as a pre-1900 value) and an anomaly for the most recent calender year 2016, yielding the following temperature rises: 1.13ºC, 1.25ºC, 0.93ºC, 1.33ºC. This shows a spread of results but given the differing methods employed this is to be expected. The average is 1.16ºC which to 2dp is 1.2ºC. The WMO (who define "pre-industrial" as late 1800s) provide the following graph which demonstrates this rise.

My use of the value 1.2ºC @40 was not intended to carry much weight. Rather it was demonstrating the way in which Curry was mis-representing the hockey-stick analysis. I mention the rise since 1900, the IPCC has passed attribution on the rise since 1950 which is the majority of the rise since 1900. It is this IPCC attribution that lies at the heart of Curry's denialism, a subject on which she has blogged at length many times.
Concerning the El Nino, I would suggest that the El Nino is now behind us and the rise since 1900 to the last 12 months comes out as 1.06ºC.
- The Mail's censure shows which media outlets are biased on climate change
MA Rodger at 21:36 PM on 30 September, 2017nigelJ @39,
Note that within her spreading of doubt and denial about AGW, Curry is even happy to trash the temperature record. (This is perhaps odd as the temperature record is about the only thing she has to base her grand theory of there being a humongous natural climate wobble which has amplified the recent AGW over 1970-98 to create the present climate 'hysteria' with Wyatt's Unified Wave Theory being Judy's candidate for such an oscillation back in 2015.)Her stance in the temperature record is basically that 'there has been warming, but...' with the 'but' being followed by the buckets of doubt and denial. In many ways her comments about the temperature-record exemplifies her highly unscientific method. She will raises issues but almost always fails to set out clearly what she concludes from such issues. If she did, she would be slammed for promulgating serious denial with sky-high Monckton-ratings.
Consider her testemony about the temperature record in front of this 2015 Senate Committee:-
♠ Her citing of the hockeystick graph as showing "overall warming may have occurred for the past 300–400 years. Humans contributed little if anything to this early global warming," rather misrepresents the hockeystick. She is strongly suggesting that the possible 0.2ºC warming over a recent 300-year period (1600-1900) somehow brings into serious doubt the IPCC's attribution of the 1.2ºC warming since 1900.
♠ Her evidence on the relevance of the 'hiatus' never concludes. Rather it rambles on about "The growing discrepancy between climate model predictions and the observations", the raging debates over the recent Karl et al (2015), the 'hiatus' "clearly revealed" by satellite data (helpfully plotted by denialist Roy Spencer so the graph shows the now-superceded RSSv3.3 and the then-yet-to-be-released UAHv6.0 and with the RSS data re-based and curiously shorn of some of its maxs&mins and for good measure the graph stops short of the latest 2015 warmth), scientific disagreement over discrepancies between TLT & SAT records (and note where she stands on that with her oral testimony "we need to look at the satellite data. I mean, this is the best data that we have and is global"), convoluted statistical probability of 2015 becoming warmest-year-on-record, discrepancies amongst temperature data sets, a five years requirement to be sure the 'hiatus' has actually ended. It rambles on but the relevance of the 'hiatus', the message she is meant to be delivering, is never set out.
♠ Beyond her written testimony, Curry also expounds on SAT record adjustments, spreading yet more doubt:-"... And the adjustments, as you can see, are rather huge, OK?
So should we—so, to me, the error bars should really be much bigger if they are making such a large adjustment. So we really don’t know too much about what is going on in terms of, you know, it is a great deal of uncertainty. Yes, I do believe that we have overall been warming, but we have been warming for 200, maybe even 400 years, OK? And that is not caused by humans."After the digression onto the pet "warming for even 400 years,OK" Curry returns to adjustments but specifically ocean adjustments stating "I mean, the land datasets are sort of starting to agree, but there is a great deal of controversy and uncertainty right now in the treatment of the ocean temperatures." Poor Judy has failed to note that Chariman Cruz was asking for comment on USCHN data adjustments and her comment relevant to that data solely comprises "the land datasets are sort of starting to agree" and thus that the adjustments Cruz is complaining about are perfectly appropriate. Yet that is certainly not the take-away message she provides.
Curry gets away with talking this rubbish, even in written reports presented to a Senate Committe. She really should be taken to task for it.
- Temp record is unreliable
Eclectic at 18:14 PM on 23 September, 2017Randman @451, I have replied to you on this thread, because your concern seems to be more with the reliability/accuracy of surface temperature records, rather than with the ancient "predictions" made by Hansen last century.
And probably best if you stick with "standard degrees" instead of "Fahrenheit degrees" (Fahrenheit being rather 18th Century!) .
World temperature has risen approx 1.0 degrees since the pre-industrial age [the time of Fahrenheit himself!!!] . This rise is the average of local regional rises worldwide (this being far more useful and precise way of looking at the facts, rather than the vague/diffuse and somewhat unhelpful "world's average temperature").
Yes, the Arctic rise [i.e. local anomaly rise] is much higher than the "averaged" anomaly rise of 1.0 degrees — but it does not contribute much to the total anomaly, because the Arctic area is only a small fraction of total global surface area. Nevertheless, the Arctic rise is disproportionately highly important, because of its effect on ice-melting / ocean currents / Northern Hemisphere weather events / and feedback on global warming.
Randman, you will notice that the different organizations (such as NASA, and NOAA, and the Japanese Meteorological Organisation, etc) have a preference for comparing the very latest temperatures against a variety of baselines e.g. 1950-1980 or 1970-2000 or the full 20th Century etcetera. And this makes life unnecessarily complex for non-specialists [i.e. you and me].
But I am sure you appreciate, Randman, that whatever the baselines of of reference, the world is getting much warmer and doing it very quickly (whether things are expressed in degrees Celsius / Fahrenheit / Reaumur / or whatever). Whichever labels are used and whatever human yakking goes on . . . yet the real physical world shows strong evidence of rapid warming — wherever you look! Vasts amounts of polar ice are melting; sea levels are rising ever faster; glaciers are disappearing; and plants & animals are changing their activities accordingly.
To that extent, Hansen's various projections [scenarios] of future temperature are little more than of interest to historians. Yes, they're broadly far more accurate than those of science-deniers such as Lindzen . . . but nowadays we've had nearly 30 more years of experience in seeing the reality of the "Hockey Stick" rise in global temperatures. By whichever 30 / 50 / 100 year baseline you use, the recent years of 2014 / 2015 / 2016 / and so far in 2017, have been the hottest on record i.e since around 1880 (or by proxy measurement, the hottest in the past 2000+ years).
So, global warming is pressing ahead at high speed (in geological terms). And no sign of slowing down anytime in our near future.
btw, Randman, in your post you mentioned Hansen (who is famous enough in scientific circles to be referred to as just a single name — rather like Cher and Beyonce in pop music circles!). But who is the "Jones" you mention? Presumably not the Tom Jones of yesteryear!!
- Medieval Warm Period was warmer
NorrisM at 15:01 PM on 13 September, 2017Moderator
Thanks. I have read the above material and watched the video. I think the best summary of things is the National Academy of Sciences 2006 report which you have quoted above.
I think the full paragraph makes it clear that although they generally agree with the Mann representation they clearly disagree with some of his statements regarding the 1990's being the hottest on record:
"Based on the analyses presented in the original papers by Mann et al. and this newer supporting evidence, the committee finds it plausible that the Northern Hemisphere was warmer during the last few decades of the 20th century than during any comparable period over the preceding millennium. The substantial uncertainties currently present in the quantitative assessment of large-scale surface temperature changes prior to about A.D. 1600 lower our confidence in this conclusion compared to the high level of confidence we place in the Little Ice Age cooling and 20th century warming. Even less confidence can be placed in the original conclusions by Mann et al. (1999) that “the 1990s are likely the warmest decade, and 1998 the warmest year, in at least a millennium” because the uncertainties inherent in temperature reconstructions for individual years and decades are larger than those for longer time periods and because not all of the available proxies record temperature information on such short timescales."
My take on all of this is that no one is denying that there clearly was a MWP which, given the droughts in the SW US and the recent Chinese Academy of Sciences report on a MWP in China, suggests that this was probably prevalent in most of the Northern Hemisphere. It was not caused by humans so there had to be natural explanations for it. Those explanations have been provided which suggests higher solar activity and less volcanoes. But the evidence seems to be clear that these temperatures did not reach today's world levels. The "global temperature" at that time did not reach what we are experiencing globally today. At this same time, the sea levels did rise and drop matching the MWP and Little Ice Age but again not as significant as the sea level rise in the last 100 years or so. I also note that the Michael Mann 2008 EIV proxy data temperatures (which I believe he thinks are the best) no longer look like a hockey stick.
But the bottom line is that without some other explanation, given the significant increases in CO2 since the beginning of the Industrial era, most of the present temperature rise since 1800 has to be attributed to man.
Interesting, in my summary, I think you would have agreed with my analysis until I said 1800 and not 1950 as per the IPCC. Perhaps there is some other explanation for that part of the temperature rise that occurred from 1900 to 1950?
I am happy to move on to considering what the predictions are for the future and how best to deal with those predictions and the consequences.
- Climate's changed before
MA Rodger at 06:48 AM on 11 September, 2017NorrisM @554,
You sepcifically ask about the reference made in a comment on another thread which concerned data from Kemp et al (2011) and a Sea Level reconstruction used to make a comparison with the good-old hockey stick. The actual graphic shown was::-
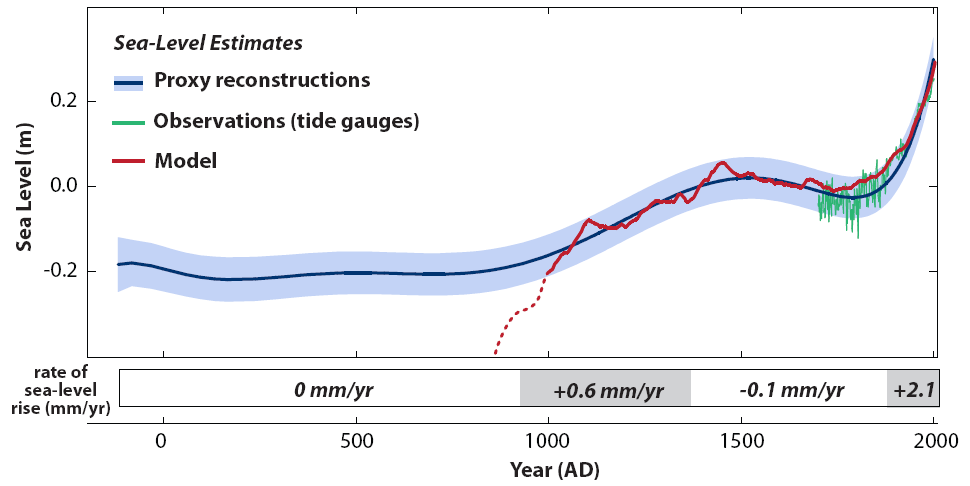
The fit with the hockey stick only works back to AD1000. Simplistically, the SLR found by Kemp et al is saying that (if the SLR is the result of global temperature changes) the temperature was in balance with sea level up to AD1000 after which average global temperatures rose by about 0.15ºC, a level maintained for a period of 400 years, then dropped back for a period of 500 years, after which we have the instrument record showing a global rise of 0.5ºC to 1950 and a similar rise since. So any MWP & LIA are globally very tiny features relative to post-AD1900 warming.
An alternative is that globally temperature was much flatter with the SLR resulting from regional temperature variation in places that SLR would be sensitive to; places like Greenland perhaps.
- Climate's changed before
NorrisM at 04:24 AM on 11 September, 2017Moderator
Thanks, I have now read your Policy Statement. I would have thought that my references to nigelj's comments re ocean temperatures (on another stream) somewhat corresponding to the periods "alleged" to be the MWP and the Little Ice Age would be considered "additional information" and not just repetition of earlier positions. Surely a matching of ocean temperatures tells you something about atmospheric temperatures at the same time.
Furthermore, my reference to the recent Chinese Academy of Science recent paper analyzing temperatures over the last 1,000 years in China was also something which shows that this was not just a period isolated to parts of the Northern Hemisphere. Does anyone have any comment on this? I have read somewhere else (and I do not have a citation) that during the MWP the tree line of the Rocky Mountains was much higher than at other times. This would just about "connect the dots" for all of the Northern Hemisphere since we have Northern Europe, Greenland, Newfoundland and China already.
The above graph has posted the Michael Mann 1998 hockey stick. My understanding is that sometime around 2007 he revised his graph. Could someone post his most recent one? For some reason, I thought it was not so "flat". Perhaps because it does reach back further than 1400 to cover the period from 800 AD. If this is totally "out of the blue" with reference to the Rocky Mountain treeline, I will find my source for this statement or acknowledge that I cannot find it. However, my guess is that you have heard this before.
I will again reiterate that even if there was an MWP, it does not prove anything about today's temperatures but only goes to show that this has occurred before when it was not caused by man.
- Climate's changed before
michael sweet at 01:39 AM on 11 September, 2017Eclectic,
Bob Loblaw's comments are always thoughtful.
Your understanding of the MWP and mine are much the same. There were various warm and cold periods worldwide but they were not all at the same time.
According to Mann's Hocky Stick from this SkS reference:

Where is the drop in temperature for the LIA? I do not see any noticable drop between 1600 and 1900. There is an overall drop over the entire graph (the Hockey handle) that is probably the descent into the next Ice Age that was stopped by CO2 emissions. As you would expect, there is some noise.
Since I see no special "LIA" I conclude that it never existed.
I see that the above graph confirms Mann's original Hockey stick as very close to the best data available ten years later.
- Climate's changed before
Eclectic at 23:42 PM on 10 September, 2017Michael @557 ,
please correct me if I have gained the wrong impression : that impression being --
(A) There was no global MWP, as the numerous "warm patches" of approximately 1,000 years ago were Northern Hemispheric and were minor and not contemporary. In other words, the so-called MWP is nowadays a Eurocentric "beat-up" from denialists who are using outdated ideas and who are being very economical with the truth.
(B) The so-called Little Ice Age actually "was a thing" : as it involved some cooling of both hemispheres (IIRC, caused by two Solar Grand Minima, helped along by a number of above-average volcanic eruptions). Also IIRC : the Little Ice Age was a rather minor affair, constituting a global temperature drop of only about 0.3 or 0.4 degrees below the natural long-term (multi-millennial) slow decline of global temperature [until the modern rapid "Hockey Stick" rise caused by AGW, of course!].
I often see denialists claim that the temperature rise of the 1800's and 1900's was nothing more than a "rebound effect" from the LIA. That argument seems [to me] to be a complete nonsense, since recent temperatures are higher than the extrapolated pre-LIA levels (and the Holocene temperature is on a natural down-curve). And those denialists are supposing that any changes in global climate simply occur for no physical reason. Perhaps they subconsciously think of global climate as being a sort of inner-spring mattress!
- Climate's changed before
michael sweet at 22:01 PM on 10 September, 2017NorrisM,
For this instance, the data very clearly shows that there was not a global MWP or little ice age. Since they never existed, they cannot be denied and your comment using the word denied appears to be deliberately offensive.
You have previously made statements about the MWP and LIA and have been referred to citations that show they were local events and the global temperature is shown by the Hockey Stick of Mann et.al. Since you have been shown data to support Mann et al and have provided no data (because it does not exist) to support your claim Mann was incorrect you are sloganeering by repeating an unsupported claim.
Many scientists have reproduced Mann's Hocky Stick using a variety of methods and data. It is completely accepted by anyone informed about AGW. Use the search button to find SkS references to educate yourself. If you have a question we are happy to help you understand, but claiming Mann is incorrect repeatedly makes it appear that you are not reading (or reading and ignoring) the answers people give you.
- Climate's changed before
NorrisM at 03:16 AM on 10 September, 2017nijelj
In looking for something else, I just saw this reply of yours on one of the blogs:
"Your understanding or information is wrong. Sea level rose from AD800 to around 1500 then fell until about 1900, then started rising as in the link below. This correlates reasonably well with burning of fossil fuels so all or nearly all this sea level rise can be attributed to fossil fuels."
Just curious but does this sea level rise and drop pre 1900 correlate quite well with the theory of the MWP and the Little Ice Age?
We now have the Chinese study which also seems to support both the MWP and Little Ice Age. If you need I cite for the Chinese study I can get it for you.
Again this does not prove anything about the existing warming but the denial of the MWP and the Little Ice Age is part of the "Hockeystick" theory suggesting that this present warming is anomalous over the last 2000 years.
- The Trump administration wants to bail out failed contrarian climate scientists
NorrisM at 16:47 PM on 3 September, 2017JW Rebel @ 19
I do not want to make a big deal of this but there is an underlying assumption you make. You assume that because one group may citicize the explanation of some theory that it is not acceptable to criticize that theory without coming up with an alternative theory. You are 100% wrong in that assumption.
It is perfectly acceptable to criticize a theory without coming up with an alternative. One may question the existence of God (for lack of evidence) without coming up with an alternative explanation of why we are here.
In the area of climate change, it is perfectly acceptable to criticize the existing theories without coming up with an alternative explanation. In science, it perfectly acceptable to simply say, this theory is wrong but we just do not know what the answer is. You do not have to come up with a viable alternative.
At this point in my personal deliberations, I am convinced that man has caused the temperature to increase because of CO2 emissions but I am not convinced that the models can accurately predict what the effects will be over the next 70 years or beyond. What troubles me is that these computer models have to make massive assumptions about the impact of clouds because they simply do not have the computer power to properly build them into the models. I think the term they use is "parameterizations". Another issue is how sensitive the climate is to the massive increases in CO2, namely, how much in "positive feedbacks" are created by water vapour, etc.. I would like to hear from both sides on this issue. I would also like to hear from both sides how successful the models have been in predicting temperatures since the models have been developed. I read Michael Mann's support for the James Hansen predictions in an recent article in Foreign Affairs but it seems to me that he "cherry picked" his predictions. Many of Hansen's predictions as to temperature increased in the last 20 yeas were quite far off which were not referenced.
I would also like to hear whether the experts agree on whether there really was a Medieval Warming Period and a Little Ice Age. According to Michael Mann there was no such thing in the promotion of this "hockey stick" which was to show that the temperature increase today is unprecedented in the last 2000 years. A recent Chinese study has shown that certainly in China there have been periods of warming corresponding to the MWP and periods of cooling corresponding to the Little Ice Age. This corresponds to the information we have both about Greenland and Europe.
I am not saying that proving there was a MWP or a Little Ice Age means that we do not have a problem today but I would just like to get the facts and I am not convinced Michael Mann et al have delivered same. I have to admit that Climategate seriously impacted my trust of Michael Mann and Phil Jones. I do not care that their respective universities "cleared" them of any wrongdoing. You have to have massive blinders on you not to read these emails and wince. Are they scientists or are they going beyond the science to promote what they think is the "right thing to do"?
Returning to your main point, it may very well be that there are so many factors involved that it is impossible to predict what the climate will do in 30, 70 or more years. And it may be impossible to predict what portion of today's temperature increase is attributable to anthropogenic influences. This does not end the argument. We clearly have polar ice caps and glaciers melting. Oceans are rising (although they have been for 150 years).
So it behooves us to consider what we should do.
I just had to comment on your premise that the "other side" has to come up with a viable explanation otherwise you just accept the present premise and predictions of future temperature increases and the concomitant effects.
So I am hoping that a red team blue team can deal with some of these issues. I do not have any preconceived views on what would be achieved but I would enjoy seeing each side go at each other.
For those who say that it is too complicated, I say "fooey". If you cannot hit the main points and come to a conclusion then we should not be going down the road of massive changes to our society because it is undemocratic. If you cannot distil these issues for the public and you therefore have to rely on arguments of "trust me" or "trust the IPCC" then I do not think you have a chance at all of convincing the majority of the US public to go along with the massive changes proposed. Gradually switching to RE, yes, but not massive changes which impact their economic well being. It is like asking the Oracle of Delphi to tell the ruler whether he should go to battle. I think we have got beyond that stage.
- Problems For Oil
Wol at 13:34 PM on 20 August, 2017My guess is that there will be a sort of hockey stick line in the EV take-up numbers. (With apologies to Michael Mann)
As more and more cars are EVs the demand for gasoline will obviously fall and as a result there will be a rise in the number of filling stations able to remain profitable.
As it becomes more difficult to find gas stations and with greater accessibility to charging points I reckon there'l be a near vertical end to the EV hockey stick.
- Medieval Warm Period was warmer
MA Rodger at 07:04 AM on 10 August, 2017It might be worth pointing out to commenter J Doug Swallow that while he may feel he is justified @243 in accusing Mann of falsifying work, the authors he cites in support of an such egregious accusation are not in any way supportive of the J Doug Swallow position. Four of the five authors of the paper he cites Viau et al (2002) are also the authors of Viau et al (2006) which considers the Mann 'hockey-stick' compatable with its own findings, stating "The results are remarkably similar, in spite of the different methods and proxies employed in these studies (Figure 6). This provides further evidence that our North American temperature reconstruction is reasonable and also representative of a large region of the Northern Hemisphere."

More recently two of the authors published Viau et al (2012) which surely supports the contention of this SkS OP as it kicks off its conclusions stating "The pollen-based paleoclimate reconstructions show that warmer conditions during the MWP and cooler in the LIA were all nevertheless cooler than the 1961–1990 base period, and this result emerges even without comparing the results to the instrumental record."
The other two papers cited by commenter J Doug Swallow are similarly inappropriate as support for his contentions.
- Medieval Warm Period was warmer
J Doug Swallow at 02:11 AM on 10 August, 2017From recent experience on this site and dealing with this topic "How does the Medieval Warm Period compare to current global temperatures?" I'm sure that neither Daniel Bailey & doug_bostrom will believe that this information below pertains to the Medieval Warm Period and, if not, they should tell me why it does not.
Since Michael Mann felt that he could get away with using falsified tree ring observations from two trees in Siberia to make his hockey stick graph when pollen records show something very different.
Widespread evidence of 1500 yr climate variability in North America during the past 14 000 yr
Abstract: "Times of major transitions identified in pollen records occurred at 600, 1650, 2850, 4030, 6700, 8100, 10 190, 12 900, and 13 800 cal yr B.P., consistent with ice and marine records. We suggest that North Atlantic millennial-scale climate variability is associated with rearrangements of the atmospheric circulation with far-reaching influences on the climate."
<http://geology.geoscienceworld.org/cgi/content/abstract/30/5/455>Climate Change Froze the Vikings Out of Greenland, Say Scientists
''What’s the News: Climate change may have sparked the demise of early Viking settlements in Greenland, according to a new study published online in the Proceedings of the National Academy of Sciences, when temperatures cooled rapidly over several decades. Around the time the Vikings disappear from the island’s archaeological record, temperature appears to have plunged. Nor were the Vikings the only people in Greenland whose fortunes rose and fell with the average temperature, the study suggests. Earlier cold spells may have played a role in the collapse of two previous groups on the island.''
<http://blogs.discovermagazine.com/80beats/2011/05/31/climate-change-froze-the-vikings-out-of-greenland-say-scientists/>
While we are dealing with the Vikings, may be either Daniel Bailey & doug_bostrom can inform me of how this information is off topic.
The farm under the sand
Researcher challenges conventional thinking on disappearance of Viking community
"The Norse arrived in Greenland 1,000 years ago and became very well established," says Schweger, describing the Viking farms and settlements that crowded the southeast and southwest coasts of Greenland for almost 400 years.
"The Greenland settlements were the most distant of all European medieval sites in the world," said Schweger. "Then the Norse disappear, and the question has always been: what happened?"Cross-sections of the GUS soil show the Vikings began their settlement by burning off Birch brush to form a meadow. Over the next 300 to 400 years, the meadow soil steadily improved its nutritional qualities, showing that the Greenland Vikings weren't poor farmers, as McGovern and others have suggested. "At GUS, the amount of organic matter and the quality of soil increased and sustained farming for 400 years," says Schweger. "If they were poor farmers, then virtually all the farming in North America is poor farming."
<https://sites.ualberta.ca/~publicas/folio/38/16/03.html>''We find that major temperature changes in the past 4,500 y occurred abruptly (within decades), and were coeval in timing with the archaeological records of settlement and abandonment of the Saqqaq, Dorset, and Norse cultures, which suggests that abrupt temperature changes profoundly impacted human civilization in the region. Temperature variations in West Greenland display an antiphased relationship to temperature changes in Ireland over centennial to millennial timescales, resembling the interannual to multidecadal temperature seesaw associated with the North Atlantic Oscillation. ''
<http://www.pnas.org/content/early/2011/05/23/1101708108.abstract> - 2017 is so far the second-hottest year on record thanks to global warming
John S at 04:37 AM on 2 August, 2017I just finished viewing a doc on You-Tube entitled “Climategate II Explained – NOAA Whistleblower – Data Manipulation – Global Warming Hoax” by Larouche PA published recently. Wikipedia’s account of Larouche PAC seems entirely economic, no climate change involvement indicated. The gist of the 72 minute lecture by an unidentified (?spokeperson for Larouche PAC?) was that ““NOAA breached its own rules on scientific integrity when it published the sensational but flawed report, aimed at making the maximum possible impact on world leaders including Barack Obama and David Cameron at the UN climate conference in Paris in 2015.” This was by Karl et all (2015) that claimed warming rate was twice what prior versions showed ( source Anthony Watts October (2015) and argued that truth was shown by satellite data from both UAH and RSS showing a flat line over this period. I know that Anthony Watts is a notorious climate change denial blogger, but rather than just dismissing the whole argument based on its source, I’d rather understand more of the background on this – basically is it true that, as alleged in this doc, NOAA fiddled the data, suppressed any internal dissention and then mysteriously “lost” the data all as revealed by whistleblower John Bates, a 40 year NOAA veteran and eminent climate scientist. I’m well aware that cherry-picking end-points over such a short period is no good way to consider the warming trend and that RSS put out a correction to its earlier data. What I want to know is any specific background on this specific accusation of wrong-doing by Karl et al exposed by Bates..
Later the talk characterizes such antics as typical for climate change advocates, citing the “broken hockey stick” supposedly exposed by McIntyre & MacKitrick in Energy and Environment. I heard Michael Mann’s response that their method was flawed but, again, I’d like to understand this on a deeper level than just “he said, she said”.
It also goes on about NASA supposedly lowering data before 1950 and raising it after 1950 thereby supposedly creating a warming trend. I heard about the correction of “bucket variances” for ocean data but I also thought I’d heard that these NASA adjustments created a lower warming trend not higher – so is the Larouche Pac presentation just a bald-faced lie or is there some more subtle fallacy involved in it?. The same accusation of NASA adjusting data upwards after 1950 was made in another doc on You-Tube, so, on the basis that where there’s smoke, there may be fire, I’m wondering where this story is coming from. I appreciate that adjustments to the temperature record have to be made to produce the best estimate of trend and so this can change retroactively and this fact alone allows the deniers to come in with clod-hopping boots, but as I said above, my understanding was that the net result of these adjustments was a lower warming trend not higher as alleged, so is that just a lie or what?
They also had a more fundamental question which I admit has confused me quite a bit also and that is how it is at all possible to calculate a global average from such a variety of circumstances affecting each temperature measuring device? I saw an explanation on NASA’s web-site of why changes were more reliable to average than absolute values but even so (and even after watching Cowtons’ excellent presentation on Denial 101x) it’s still a baffling subject. Maybe there is a good reference you can give me to read up on this. - Conservatives are again denying the very existence of global warming
nigelj at 06:45 AM on 13 July, 2017Earthking doesn't refute the article in detail, and resorts to calling people names, and raising other issues to score points, and distract attention. However the issues he raises are all nonsense.
For example, we are not reliant on Michael Mann's early hockey stick study. Numerous other studies using different data and / or statistical techniques have found much the same hockey stick, eg Briffa or Espers studies.
The so called pause is insignificant, plainly obvious in the nasa giss global data as below:
data.giss.nasa.gov/gistemp/graphs_v3/
It's the long term 20 year plus trend that counts, and can be estimated. This is driven by greenhouse gases and fundamental quantifiable solar issues. Nobody can predict the wiggles along the way, or decadal length variability related to ocean cycles, because its partly random.
- Conservatives are again denying the very existence of global warming
earthking at 23:00 PM on 12 July, 2017And then there is the hockey stick and the incriminating evidence "in writing" that damnably condemns the climate change sycophants; or would that be psychophants? There is no logical or scientific evidencial explanation for "the pause." Did man suddenly call on the cooling gods to reverse warming? It used to be that science was defined by theories based upon repeated experimentation and explainable from a formulated hypothesis. And even under that premise, honest scientists would admit, there is still a margin for error--possibly completely false--no matter the evidence. As is always the case: follow the money.
- Those 80 graphs that got used for climate myths
nigelj at 07:18 AM on 12 July, 2017More very unreliable, unrepresentative 80 studies research, with giant cherrypicks and manipulations and time frame problems.
The following link is a list of published research studies on past climate histories as at 2014. I did a rough count and there appear to be about 500 studies! They also say its far from a complete list.
So 80 studies proves nothing, and they have not demonstrated it is representative. Plenty of studies show a hockey stick eg Briffa, Esper, and they are proper, relevant studies
www.c3headlines.com/list-climate-history-studies-research-peer-reviewed.html
- Why the Republican Party's climate policy obstruction is indefensible
NorrisM at 09:16 AM on 11 July, 2017Thanks for the comments on my last post. My apologies to Tom Curtis for attributing the comment re Koonin to him. Eclectic your comment was not vicious in any sense but I do think we should stick to what people say and not who they are (although I have to admit if anyone has some "strong fundamentalist religious leanings" I cannot help but put a tick mark against anything else they say even though it may be completely rational).
This morning at home when I opened this website, the reply of Andy Laicy (sp) to Koonin opened in front of me magically. It was a detailed answer to the short questions I had posed relating to the "hard physics" which had been answered in short fashion by Tom Curtis (I had only asked for yes no answers at the time). Laicy's reply is pretty understandable even for a layman. So this explains the solid science based upon physics.
So there is a rational explanation that makes sense to most scientists whether they be climate scientists or other scientists.
So the question comes down to whether, using this science incorporated into a GCM, you can then actually predict the future. As a layman, the two things that puzzled me after being initially convinced by the Dessler book was: 1. If the models are capable of predicting the future then they should have had an answer for the supposed "hiatus" and 2. If the physics explain this 25 year increase in temperatures (1975-1998), how do you explain the temperature increases and decreases that I had referenced earlier, especially the .3C rise from 1900 - 1940 or so.
But for now, I would like to concentrate on what I believe is the "discrepancy" that Christy has proposed based upon his diagram. What surprises was the passive reaction of Santer and Held when questioned by Koonin about Christy's diagram. They made references to some studies that had examined this discrepancy in the past but did not comment on their conclusions nor did they strongly object to what Christy was alleging. Surely, if the difference was only marginal that they would have said so at that time. It was absolutely basic to their case.
I guess this "basic to their case" is another question. What has really troubled me is if you cannot reconcile major differences with the models and observations (if that is the case) then how can you still believe that we are still in the 3C range rather than 1-1.5C by 2100? Is this where Hawking and other non-climate scientists are? To them, is it irrelevant that the models are not sophisticated enough to predict the future? Or does it all come down to position that the models are predicting things?
In other words, does the case for anthropogenic warming of 3C stand or fall on the models? If not, then why?
But, I have to say, even if we are so sure that this period of warming was caused by humans, then surely there still has to be a full answer for why the temperature went up from 1900 to 1940. For me, notwithstanding Michael Mann's hockey stick, I would also like to have some explanation for the MWP (even his most recent graph seems to acknowledge this warming). But it would go a long way to at least have a rational explanation for the warming in the first 40 years of the 20th century.
I suspect that the answer to the model discrepancy is that it is a small discrepancy. But if this is the case, then why did Santer and Held not say so when they had the golden opportunity, knowing that the transcript of the APS hearing would effectively be read by the world.
To SkepticalScience Editor: I saw one attempt to "reconstruct" the Christy diagram but it was very confusing continually flashing from one thing to another. Could you not do a "simple" reconstruction showing where the "red line" should be and where the "blue dots" should be. Leave out the "ranges" just as Christy did or perhaps have three lines, High, Medium and Low Case. It would be very helpful.
- 2017 SkS Weekly Climate Change & Global Warming News Roundup #16
nigelj at 08:39 AM on 27 April, 2017Joe @3, thank's for your comment. I was indeed thinking of drainage basins in the very long term.
However I take your point, but I just think so what? I'm not sure what you think is so compelling about the river returning to a previous state / drainage basin.
The more important thing is we are melting the glacier, and altering the course of the river in that process. This could possibly cause us problems either in this specific case, or other cases, and regardless of whether it goes back to some previous state or not. It's also showing the impact of agw climate change, and is just another potential heaadache being caused by agw climate change.
Nothing personal, your comments were interesting and raised various issues. I didn't know about the tree stumps etc.
But I have the same reaction to the tree stump issue. Basically so what? It's well known that during the mpw some specific locations warmed more than others. The more important point is the mwp was rather weak overall, and climate change really "is" like a hockey stick according to all the studies I have seen.
But anyway Tom Curtis has cast very genuine doubt about whether you can conclude the region of the Mendenhall glacier was particularly warm.
- Correcting Warren Meyer on Forbes
Tom Curtis at 02:37 AM on 12 March, 2017Eclectic @31, Steven Mosher, as much as anyone, has a right to define the term, "luke warmer". And he has done so at WUWT:
"Over the years a few of us have worked to define what we mean by Lukewarmer and what defines the position.
1. Acceptance of radiative physics.
2. Acceptance of a lower bound to sensitivity. basically the no feedback estimate is 1.2C per
doubling. We think that the true sensitivity will be above 1.
3. over/under line. The over under line is 3C. That is, if offered a bet that the climate sensitivity
is either ‘between 1 and 3 or over 3, we take the under bet.ballpark:
less than 1.2 5%
1.2 to 3. 50%
3 to 4.5 45%
4.5+ 5%So if you believe that GHG can warm the planet and not cool it, and you think that the mean estimate of the IPCC of 3.2 is more likely high than low, then you are a lukewarmer. But you have to drop the crazy refusals over radiative physics."
In contrast, Meyer wrote:
"Not only may the feedback number not be high, but it might be negative, as implied by some recent research, which would actually reduce the warming we would see from a doubling of CO2 to less than one degree Celsius. After all, most long-term stable natural systems (and that would certainly describe climate) are dominated by negative rather than positive feedbacks."
The suggestion that ECS might be less than one removes Meyer from the Luke Warmer camp. (I have discussed his misrepresentation of the nature of climate feedbacks above.)
- CO2 lags temperature
Tom Curtis at 00:24 AM on 22 February, 2017Adri Norse Fire @549, your discussion is becoming increasingly wide ranging, and off topic. I am sure the moderators would appreciate your taking the various points to their most appropriate threads. In particular, where you say,
"The theory is essentially that solar observations are increasingly recording fewer sunspots and it is thought that solar cycle 25 or 26 will practically have no stains, a event that has precedents +200 years ago where especially the Maunder Minimum coincided with the colder phase of the Little Ice Age."
You should read, and take further discussion to this article.
Discussion of the MWP should be taken to one of numerous threads devoted to it, or that on Pages 2k. That includes discussion of farming in Greenland, although this thread would be more apt. Discussion of Holocene temperatures should probably be taken to a thread on Marcott et al.
- Whistleblower: ‘I knew people would misuse this.’ They did - to attack climate science
nigelj at 06:45 AM on 10 February, 2017Excellent points. The accusations against NOAA are another beat up, and vicious attack on climate science, without any real foundation. I agree with how you characterise all this. It is certainly a nothingburger, and hopefully it will very soon be a goneburger.
The bottom line is there is no evidence of significant policy breaches, and the data adjustments make only an incredibly small difference to the data, and have been verified by other agencies anyway. This will of course be lost on the denialist crowd, who obviously don't care about facts, honesty, or the big issues, merely scoring points, destroying careers over trivial issues, and advancing their own agenda. It's almost animal like behaviour.
The term "war on science" is a big term, but how else can it now be described, if not a war on science?
I'm intrigued by what would be Bates motivation. Firstly "in principle" whistle blowing has it's place, and that no organisation is above this. In fact I'm a strong believer in whistle blowing, and laws often protect whistleblowers.
But surely whistle blowing carries some big responsibilities as well? Huge moral responsibilites. You need to get your facts right before blowing the whistle. You could potentially damage peoples lives and your own cause. Surely you also need something substantial?
I can't see that anything NOAA did rises to these sorts of levels. It seems like Bates has got it all wrong. He has not got his facts right. He has claimed things that he is allegedly in no position to have the full information on, by what is now said.
It makes me wonder if he is an attention seeker, or disgruntled employee. Every organisation has one of these.
But it's another pseudo scandal with a lot of smoke and no real fire, and is now in the public domain. Its like climategate or the hockey stick controversy. These things are boldy presented in the media, and are in the public mind, as negative sorts of things, and the enquiries finding there was nothing wrong are posted in the media, usually in the fine print in the back that nobody is going to read. Apart froom a few websites like this, the media are unbalanced, and constantly letting us down, when they do this.
- We’re now breaking global temperature records once every three years
Richard McGuire at 09:32 AM on 26 January, 2017I have no scientific qualifications, but have keenly followed the debate over many years, from the hockey stick to the hiatus debate. Have watched and engaged climate change deniers who have cherry picked temperature data, especially UHA and RSS satellite data. The climate change debate remains highly politically charged. Which is why temperature data that is comprehensible to the media and public at large is so critical. So 2016 was warmer than 2015. The next obvious question is by how much ? Debates about margins of error and which of half a dozen temperature data sets is closer to the mark is unlikely to cut through in the wider world.
- NOAA was right: we have been underestimating warming
Tom Curtis at 10:13 AM on 8 January, 2017Further to Echo_Alpha_Zulu @7:
1) Echo_Alpha_Zulu, in a confused passage, says that he won't dispute my data because it is correct, but then disputes that current NH temperatures are greater than those shown for circa 900 AD (he continues to insist the graph shows temperature 2000 years ago); and that furthermore my "correct" data is misleading because:
"Even the past 400 years temperatures have been at a steady incline. I do not argue that. The point I am making is that this warming period has little to do with us. It would have happened even if humanity didnt exist."
Here is the graph in question:
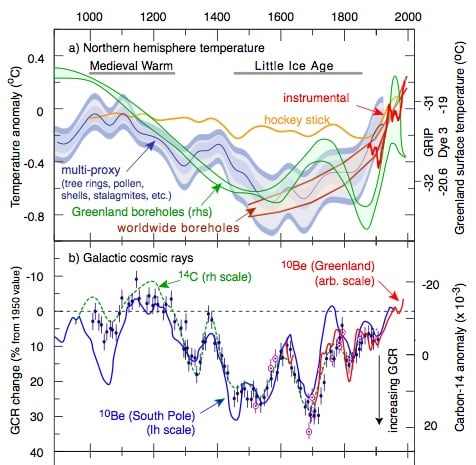
First, it is evident from that graph that the Greenland borehole data shows an increase in temperature, followed by a sharp decline until about 150 years ago. The "hockey stick" (Mann Bradley and Hughes 1999) shows declining temperatures until about 130 years ago. The "multi-proxy" (Moberg 2005) shows essentially flat temperatures, with a sharp rise starting about 1850. Finally, the instrumental record (HadCRUT3) shows declining temperatures from 1860-1900, a sharp rise to the 1940s, followed by a plateau for about thirty years followed by another sharp rise. The only "steady incline" over 400 years is from the "worldwide boreholes" (Pollack and Smerdon 2004), but that is because conduction within the rocks smooths out the signal so that no detailed signal can be expected. In short, Echo_Alpha_Zulu's claim to find a "steady incline" over 400 years comes in complete disregard of the information he himself presented.
It also disregards more recent multi-proxy temperature reconstructions such as the Mann (2008) global EIV reconstruction:
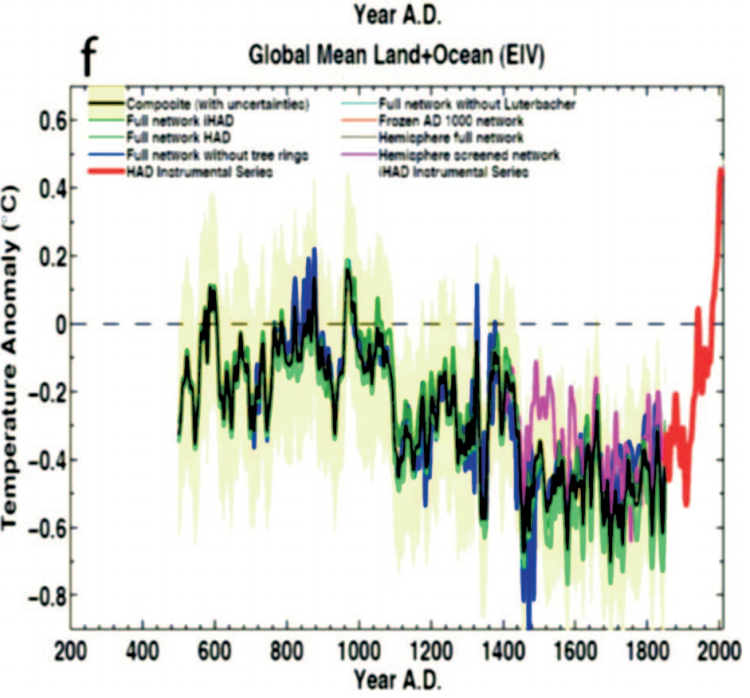
That, again, shows effectively flat temperatures from 1600 to 1900. Echo_Alpha_Zulu's "steady incline" in temperature over 400 years is a fiction.
Second, as already noted that HadCRUT4 temperature for the Northern Hemisphere "... shows an anomaly of 1.041 C for 2016, with all annual anomalies from 2001 forward being 0.554 C or higher". That is much more than the 0.3 C increase of the scaled ice bore temperatures (Left hand side of the graph). It is not more than the unscaled values (Right hand side), but the unscaled values differ between the two bore holes. That emphasizes the point that these are purely regional records, not agreeing in absolute value of change even between two fairly close locations in Greenland. So, if Echo_Alpha_Zulu insists that is the relevant scale, he needs to point out why we should expect Northern Hemisphere temperatures to match particular, different regional values. Failing that, his refusal to accept the actual data showing NH temperatures to be 0.2 - 0.7 C greater than the scaled borehole temperatures as showing they are in fact greater shows him to be in simple denial of the actual data which he vaunts himself on consulting.
2) Echo_Alpha_Zulu says:
"The sun is now just exiting one of the most violent maximums ever recorded in history. Fewer sun spots but the amount of energy released from CME's and solar flares was something we have never seen."
In fact the (possibly) most recent Solar Maximum had the lowest energy output of any since instrumental records of Total Solar Insolation began. That, however, is not what Echo_Alpha_Zulu is discussing. He limits the discussion to solar flares and Coronal Mass Ejections only. Unfortunately it is difficult to get direct information on that. Wikipedia states:
"In modern times, the largest solar flare measured with instruments occurred on November 4, 2003. This event saturated the GOES detectors, and because of this its classification is only approximate. Initially, extrapolating the GOES curve, it was estimated to be X28. Later analysis of the ionospheric effects suggested increasing this estimate to X45. This event produced the first clear evidence of a new spectral component above 100 GHz.
Other large solar flares also occurred on April 2, 2001 (X20), October 28, 2003 (X17.2 and 10), September 7, 2005 (X17), February 17, 2011 (X2), August 9, 2011 (X6.9), March 7, 2012 (X5.4), July 6, 2012 (X1.1). On July 6, 2012, a solar storm hit just after midnight UK time, when an X1.1 solar flare fired out of the AR1515 sunspot. Another X1.4 solar flare from AR 1520 region of the Sun, second in the week, reached the Earth on July 15, 2012 with a geomagnetic storm of G1–G2 level. A X1.8-class flare was recorded on October 24, 2012. There has been major solar flare activity in early 2013, notably within a 48-hour period starting on May 12, 2013, a total of four X-class solar flares were emitted ranging from an X1.2 and upwards of an X3.2, the latter of which was one of the largest year 2013 flares. Departing sunspot complex AR2035-AR2046 erupted on April 25, 2014 at 0032 UT, producing a strong X1.3-class solar flare and an HF communications blackout on the dayside of Earth. NASA's Solar Dynamics Observatory recorded a flash of extreme ultraviolet radiation from the explosion."
Note, however, that the solar flares from preceding solar maximum were far more energetic than those currently. Further, wikipedia is also clear that the largest flare observed was the September 1, 1859 Carrington event, a flare so large it was visible to the naked eye.
Given this, Echo_Alpha_Zulu's claims are at best, unsupported, and likely false. Absent his citing and linking to a credible source for this claim, I think we should regard it, as so many others of his claims, as so much spindrift.
(Note: I say "possibly" because it is not yet certain we have reached the maximum.)
- NOAA was right: we have been underestimating warming
Tom Dayton at 04:56 AM on 7 January, 2017Echo, you wrote "I will ask you to provide us with a chart of temperature records over the past 2000 years." Okay--see the post on the Medieval Warm Period. After you read the Basic tabbed pane, read the Intermediate one. For more information about the PAGES 2K study that is cited and graphed there, see a post on that. If you want to discuss those topics, do so in the comments on those or similar posts, where your comments will be on topic.
- Climate change in 2016: the good, the bad, and the ugly
nigelj at 08:44 AM on 4 January, 2017Michael Sweet, 1.5 degrees Celsius could well be true if you take it wider from 1750 right to this year. I personally have no argument with that.
However regardless of exact numbers and start and end points, studies like Marcott going back over 10,000 years show just how unprecedented recent temperatures are. I remain optimistic that if the public are made aware numerous studies keep duplicating the original hockey stick the facts will eventually sink in.
Debates are eventually won on the facts. Even Trump is going to find that out the hard way because right now all his policies (climate change, foreign policy, and economic etc) are all based on fallacies of various kinds, and are therefore very foolish policies. They are foolish for other reasons as well.
- There's no correlation between CO2 and temperature
victorag@verizon.net at 06:42 AM on 25 August, 2016#121 MARodger:
What Lovejoy's Figure 3a represents to me is how easily data can be distorted to support just about any theory, providing one is clever enough to adroitly juggle the statistics. And of course Lovejoy is not alone. I see this sort of distortion everywhere in the cli. sci. literature.
For some examples see the following list.
It wouldn't be so bad if the various attempts reinforced one another or were even consistent with one another, but in most cases they are not. Extraordinary claims require extraordinary evidence. It's not enough to pull a few rabbits out of a hat. The evidence must be there, it must be clear and it must be objective. While highly complex and even convoluted technical discussions are appropriate in a purely scientific paper, it should be possible to boil all that down into a clear and simple explanation that any educated person can understand. And no, simply reiterating over and over that "climate change is real" won't do.
- One Nation's Malcolm Roberts is in denial about the facts of climate change
nigelj at 10:31 AM on 6 August, 2016This webite is the voice of reason. Greenhouse fingerprints were the one thing more than anything else, that convinced me we are warming the climate.
This message needs wider public dissemination somehow. It shifts the debate away from endless arguments about hockeysticks and cosmic rays etc. Its something the wider public would generally grasp.
But I want to echo the comments by Chriskoz. How do these people even get elected? The trouble is politics is a "profession" open to anyone, and is sometimes persued by very uneducated people, or fanatics with ideological agendas.
Of course many politicians mean well and are nice people, but its the fanatics that get attention and sadly sometimes have influence. I don't know what we do, because democracy demands the political system be open and I generally support this. Sometimes democracy is its own worst enemy.
I imagine nothing will convince Malcolm Roberts, or he will soon forget, or is probably so invested in his particular world view he will be very reluctant to change. But we must still try to convince these people. I remain an optimist.
- Venus doesn't have a runaway greenhouse effect
Glenn Tamblyn at 16:44 PM on 19 June, 2016So to a basic point, and the link you gave to the hockeyschtick site is an example of this.
There are a number of climate denier sites that make this sort of argument, with dubious thermodynamics, that the existence of the Lapse Rate in some way invalidates the Greenhouse Effect. The 'Venus isn't hot because of the GH Effect, it is hot because of the Lapse Rate' type arguments. What they all uniformly don't get is something simple.
The Lapse Rate is a part of the Greenhouse Effect!
There are 3 processes that work together to create the GH Effect.1. Radiative Balance. The Earth has to radiate enough energy to space to balance the energy arriving from the Sun. If it doesn't radiate enough, heat builds up and everything fries, radiate too much and everything freezes. So 'the Earth' needs to be warm enough to generate the right amount of radiation to space. Too little and it warms until its right. Too much and it cools until it is right. Radiative Balance is always adjusting the temperature of 'the Earth' to keep it where it needs to be to match the flows.
Notice I have said 'the Earth'. Because actually it isn't the Earth, it is that part of the Earth where the radiation to space originates from. Radiation doesn't originate from 1000 meters down in the ocean for example. So Radiation originates from 'somewhere'. And Radiative Balance acts to manage the temperature of the 'somewhere'. Balance defines what that emission temperature is, but not where it comes from.
2. The presence or absence of GH gases in the atmosphere determines what altitude radiation to space originates from. More GH gases means it originates from hgher in the atmosphere. And if there were no GH gases present, then it would originate from the surface. GH Gases determine where the emission temperature is set by Radiative Balance.
For the Earth that is around 5 km up and the temperature is around -18 C. For Venus that is over 50 km up and -80 - -90 C. And if the amount of GH gases is changed, then the altitude changes. So if we added enough GH gases to raise the average emission altitude for the Earth from 5 km to 6 km, then the 6km level would then be driven to an average of -18 C by Radiative Balance.3. Then the presence of the Lapse Rate pump re-balances the vertical temperature profile around the temperature at the average emission level. Because importantly, the Lapse Rate defines relative temperatures vs altitude, not absolute temperatures. It is Radiative Balance that sets that and the GH gases determine where. The Lapse Rate then drives the average temperature of the rest of the atmosphere column to fall into line with that.
So in my example, if GH gases increased the emissions altitude by 1 km, then that level would warm to an average of -18 C, and the Lapse Rate pump would then drive matching temperature changes through the rest of the air column. Including the surface. If the actual value of the Lapse Rate remained constant* (at -6.5 C/km), then adding enough GH gases to raise the emission altitude by 1 km would result in all parts of the air column warming by 6.5 C right up to the limits where the Lapse Rate pump works.So the surface gets warmed because the upper atmosphere has to warm and atmospheric mixing propagates that up and down.
The Lapse Rate doesn't disprove the GH Effect. It is a part of it.
Sites like hockeyschtick, with their dodgy understanding, don't get this and end up spreading mis-information.
* Actually the Lapse Rate will change. In a warmer would there will be more evaporation and condensation. So the contribution from evaporation and condensation in determining the actual value of the Lapse Rate will be more important and the Lapse Rate will fall a little. This is called the Lapse Rate Feedback, it is a negative feedback, and offsets a little of the warming from more GH gases. - Venus doesn't have a runaway greenhouse effect
KR at 03:02 AM on 17 June, 2016That Nikolov and Zeller poster, not to mention the related Hockeyschtick blog post, could best be summarized as:
"We didn't like GHG physics, so we made up our own."
In short, utter nonsense. If you want actual physics, I would suggest reading the quite approachable Pierrehumbert 2001 article, "Infrared radiation and planetary temperature".
- Venus doesn't have a runaway greenhouse effect
Mike Hillis at 23:20 PM on 16 June, 2016The greenhouse effect doesn't explain why the dark and sunlit sides of Venus are the same temperature, and why the poles are as hot as the equator. This does:
http://hockeyschtick.blogspot.com.au/2016/06/new-paper-demonstrates-gravito-thermal.html
Venus is not like earth, in that its atmosphere directly absorbs sunlight on the way in, via the H2SO4 clouds. That heat absorced by H2SO4 is transferred to the surface via the gravity pump described here.
The reason the temperature everywhere on Venus is the same is, gravity is the same all around Venus.
More than 100 comments found. Only the most recent 100 have been displayed.
More than 100 comments found. Only the most recent 100 have been displayed.


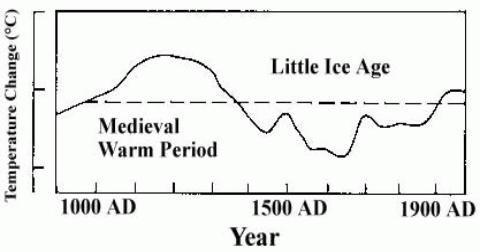
THE ESCALATOR

(free to republish)