


 Arguments
Software
Resources
Comments
The Consensus Project
Translations
About
Support
Arguments
Software
Resources
Comments
The Consensus Project
Translations
About
Support
![]()
![]()
![]()
![]()
![]()
![]()
![]()
![]()
![]()
![]()


![]()


Latest Posts
- Skeptical Science New Research for Week #18 2024
- At a glance - Clearing up misconceptions regarding 'hide the decline'
- Pinning down climate change's role in extreme weather
- 2024 SkS Weekly Climate Change & Global Warming News Roundup #17
- Fact Brief - Is Antarctica gaining land ice?
- Simon Clark: The climate lies you'll hear this year
- Skeptical Science New Research for Week #17 2024
- Water is at the heart of farmers’ struggle to survive in Benin
- At a glance - The difference between weather and climate
- India makes a big bet on electric buses
- 2024 SkS Weekly Climate Change & Global Warming News Roundup #16
- EGU2024 - An intense week of joining sessions virtually
- Skeptical Science New Research for Week #16 2024
- How extreme was the Earth's temperature in 2023
- At a glance - Is the science settled?
- What is Mexico doing about climate change?
- 2024 SkS Weekly Climate Change & Global Warming News Roundup #15
- Fact Brief - Did global warming stop in 1998?
- Skeptical Science New Research for Week #15 2024
- EGU2024 - Picking and chosing sessions to attend virtually
- At a glance - The Pacific Decadal Oscillation (PDO) is not causing global warming
- Climate Adam: Is Global Warming Speeding Up?
- 2024 SkS Weekly Climate Change & Global Warming News Roundup #14
- Gigafact and Skeptical Science collaborate to create fact briefs
- Skeptical Science New Research for Week #14 2024
- How can I make my retirement plan climate-friendly?
- At a glance - Global warming and the El Niño Southern Oscillation
- A data scientist’s case for ‘cautious optimism’ about climate change
- 2024 SkS Weekly Climate Change & Global Warming News Roundup #13
- Skeptical Science New Research for Week #13 2024
Comment Search Results
Search for solar AND forcing
Comments matching the search solar AND forcing:
- Climate - the Movie: a hot mess of (c)old myths!
nigelj at 05:38 AM on 3 April, 2024Two Dog @65. All that additional heat energy accumulating in the oceans has to come from somewhere. Possible candidates are anthropogenic warming, increased solar activity, and an increase in sub sea geothermal or volcanic activity.
Scientists have ruled out solar forcing and geothermal or volcanic activity. It's really hard for me to see where else that quantitiy of energy could come from if not those three possibilities. Just waving your hands and saying there may be something else isnt remotely convincing to me. Its just so implausible and such a vanishingly small possibility and so unlikely.
- Climate - the Movie: a hot mess of (c)old myths!
nigelj at 04:41 AM on 2 April, 2024Two Dog @55
"You make the same point I am searching for - namely that "blips" in the temperature record can be driven by natural factors. What puzzles me is others on this thread, whilst they recognize these natural impacts, appear confident that the natural factors that we are aware of are "temporal and not significant" (my words) when pitted against the powerful impact of human GHG emissions"
Nobody has claimed natural factors are all 'insignificant' forcings. Only that the natural cycles are in a cooling or flat phase in recent decades so cannot explain the recent warming trend. However the solar cycle is not a particularly powerful factor, and if it was in a warming phase it would struggle to explain more than a small amount of the recent warming. Refer to the climate myth "It's the sun" on the left hand side of this page.
"They rely on climate scientists for this - a group who are highly unlikely to admit the strength and frequency of natural factors is unpredicatble and hard to measure."
Incorrect. Climate scientists freely admit that the frequency of natural factors can be unpredictable to an extent. I provided you with data on the solar cycle, ENSO, and The PDO oscillation which depicts the degree of regularity of these cycles. You can see there is a repeating cycle bit its not perfectly regular.This data is prepared by climate scientists.
In addition whether they are not precisely predictable doesnt stop us detecting how they are affecting temperatures at any given time.
Climate scientists are quite open about accuracy of data. If you dig into the details the data has error bars. However the data has generally good accuracy. Solar irradiance in particular is meaured by satellite sensors with reasonable accuracy, and the Sorce network used since 2003 is highly accurate:
www.ngdc.noaa.gov/stp/solar/solarirrad.html
ENSO index is not that hard to measure with decent accuracy:
www.ncei.noaa.gov/access/monitoring/enso/technical-discussion
"I think this is where the climate scientists tend to differ from the physicists and geologists, whose very existance does not require them to claim knowledge of all factors that impact the climate."
Incorrect. Most climate scientists are in fact physicists, geologists, chemistry graduates etc. There is a degree in climatology, but its very recent and not many climate scientists have that degree. It typically has modules in physics and geology anyway. I suggest google it for your local university.
- I drove 6,000 miles in an EV. Here’s what I learned
prove we are smart at 23:49 PM on 28 December, 2023Ok, I believe in keeping an open mind with most things these days.
RH@2, I agree, it wasn't a "review". You know, I will often just click on various parts of a video, to be sure I have the right tone of it- judging a book by its cover,I learnt long ago.
Nigelj@3 Sorry you only lasted 4minutes longer, I suppose that was a lot considering you said " I already know the downsides of EVs, and I doubt some motor repair mechanic will add anything."
By the way, the "you" in my moniker is for any replies I read on this blog site- I have learnt a lot following yourself and others replying to many with inaccurate info.
I reckon at least you got the patronising, piss-taking, swearing and taking ages to get to point right with JC If you could have toughed it out,( I'm sure against your better judgement) we might have agreed with some of his observations and disagreed..
I"m not agaist EV cars, far from it but a smart person can check out many sources of info and recheck again from others to get the big picture and not a green washed fervour towards the complicated issue of EV cars.evse.com.au/blog/how-much-carbon-dioxide-does-an-internal-combustion-hybrid-and-electric-car-emit/
"We need more renewable wholesale electric to support clean electric cars. This is where some detractors have valid points when they argue that electric cars are shifting the problem."www.energy.gov.au/energy-data/australian-energy-statistics/electricity-generation
Every electric car is forcing these electricity generators to work harder. In Australia thats 68% worth from fossil fuels. There is a lot to do and time is running out-( a familiar comment) for us as we are already behind the 8 ball. www.drive.com.au/news/electric-car-battery-recycling-australia-environmental-harm/
These and a few other issues are mentioned by our smart arse mate Mr Codogan-don't ask him about EV fires.. In truth, I believe hybred cars are better during this transition, ask Mitsubishi and Toyota-at least for Australia,www.drive.com.au/news/electric-vehicles-worse-for-environment-than-petrol-cars-report/
You wrote.."There is a group of people on the hard left of politics and academia who dislike EVs (and sometimes wind and solar power) because they are the product of the capitalist society and industrial society and because rich people drive them and profit from their manufacture. You see this in internet discussions sometimes.
While unrestrained greed and laissez faire capitalism is not my thing, their reasoning seems shallow and emotive. It is a fallacy of perfectionism - where a perfect, implausible socio- economic utopia is prioritised, and more realistic attainable compromise solutions are discarded."
Your talking to a guy who has worn many hats, and speaks simply because of all the fake people and their entitled behavior, here is another one, see if you can stomach the guy and tell me are his facts correct?..www.youtube.com/watch?v=SiRzpKWshwU
- 2023 SkS Weekly Climate Change & Global Warming News Roundup #44
michael sweet at 07:28 AM on 10 November, 2023Dean,
I think the explaination of current heat caused by " El Nino, uptick in 11-year solar cycle, Hunga-Tonga and reduction in aerosols due to 2020 phaseout of sulphur dioxide" is not very satisfying.
The El Nino has just started. Usually the effect of El Nino is felt most at the end of the year and the year following. That means we are just now feeeling the El Nino effect. In addition, the current El Nino is described as moderately strong, not extremely strong source. To me that means that only a little of the extrordinary heat of the past 4 months could be attributed to El Nino. Dr. Zeke Hausfather here primarily attributes the current extreme record temperatures to El Nino. I doubt the El Nino has contributed so much heat so early in the cycle. We will see how much hotter next year is. I think El Nino contributes less than 0.1 C.
The solar cycle only contributes about 0.2 C to warming from the top of the cycle to the bottom. While the cycle has increased a lot this year, it is still not peaking out. The solar cycle is not much different from earlier record years. This contribution is also less than 0.1 C.
The volcano is harder to evaluate. Most volcanoes cool the surface but this one shot a bunch of water into the Stratosphere. Since that has not happened before it is hard to estimate. I think the volcano contributes less than 0.1 C.
October was 0.4 C above the previous record year which had a much stronger El Nino, September was 0.5 C above record, August 0.3 C, July 0.43 C higher. These records are usually broken by hundredths of a degree. The past years had stronger El Ninos and the solar cycle was comparable.
Hausfather's estimates of all the forcings do not add up to 0.5C for September. Hansen has been saying for decades that aerosols reduce temperature much more than the models indicate. I fear that Hansen is correct and the unaccounted for warming is coming mostly from the reduction in aerosols. This is due primarily to the change in marine fuels with some coming from polllution controls in China.
If the record heat is caused primarily by the reduction in aerosols it will be permanent. Next year will be hotter because of the El Nino. Future years will build off a new base that is about 0.4 C higher than it was three years ago. Hansen predicted before this year that 1.5 C would be exceeded before 2030. If this year is above 1.5 C becasue of aerosol reduction than by 2030 it is very likely all years will be above 1.5 C and Hansen will be correct. If the volcanoes effects have been underestimated than after next year the temerature should go down for a few years.
Pray that Hansen is incorrect and the volcano caused this years extraordinary temperatures.
Keep strongly in mnd that Drs Mann, Hansen and Hausfather are way more informed about these matters than individuals who post on the internet, including me. I recommend you try to read as many of their postings as possible to determine who you think is being the most consistent.
- CO2 effect is saturated
MA Rodger at 18:47 PM on 27 October, 2023chuck22 @709,
I would suggest it is more that Venus shows what a thick atmosphere does to climate while Mars shows it for a thin atmosphere. Both have an atmosphere comprising about 95% CO2. Yet the surface of Mars has zero GH-warming while on Venus it is an impressive +407ºC.
Venus has about 80% of the solar warning relative to Earth, this due to its higher albedo (left hand graphic below) which more than compensates for being closer to the Sun. Thus the "naked planet" temperature for Venus (230K) is lower that Earth's (254K). Venus has a 92 bar atmosphere and the clouds in such a thick atmosphere are a major insulation mechanism preventing IR across the entire spectrum from escaping to space from anywhere near the surface.

Zhong & Haig (2013) show (their Fig6b) that the climate forcing on Earth from CO2 (which at 389ppm provides with feedbacks GH-warming of +34ºC) would be perhaps trebled by CO2 levels up near the 90% mark, (Fig6b shows the direct forcing up to ~30% CO2) an unrealistically high level, but it does show that additional CO2 does not "saturate".
- CO2 is not the only driver of climate
Bob Loblaw at 07:54 AM on 9 May, 2023piotr @ 73:
I am not sure what your "not directly" statement refers to. I presume that the Martin Mlynczak quote is the one in comment 69. To put it simply, the thermosphere and the earth's surface respond to solar radiation in very different ways. You can read about the thermosphere on Wikipedia. Note that the thermosphere is at very high altitudes (>80km), and its temperature structure is the result of the absorption of UV radiation. It also has very low density, so even though average kinetic energy is high ("temperature") it does not hold a lot of heat. It is not strongly linked to the surface, which is heated by the absorption of solar radiation over the full spectrum.
This paper by Lean, Beer, and Bradley (1995) shows in figure 2 that variations in total solar irradiance are much less than for the UV range (in %).

To use the 4W/m2 drop in that figure, you need to first reduce it by a factor of 4 (area of a sphere vs. area of a circle), and then adjust for global albedo (0.3), giving an overall forcing of only about 0.7 W/m2. Sustained over only a period of about 50 years, this is not going to have a major cooling effect on its own.
You say that "it noticeabl[y]e cooled large parts of the no[r]thern hemisphere", which I presume is a claim with respect to surface temperature responding to these solar variations. You then throw in volcanic effects. You seem to grossly overestimate those solar effects, though - with no references to any supporting information. If you look at this SkS post, the first figure shows that reconstructed global temperatures for that period are much smaller than your claimed "decrease up to 1.5°C".

In your second paragraph, you start talking about "The past 10.000 years where up and downs in global mean temperature like +/- 2°C for dozen decades, even for nearly 2000 years - as we can reconstruct with little data-points." This starts to wander into the last glacial period, where Milankovitch cycles start to play a role. You are mixing together a lot of different forcing mechanisms, as if they are all equivalent in some fashion.
You then start into urban heat island effects, and finish off with a couple of paragraphs that represent an argument from incredulity. If you actually want to learn something about temperature reconstructions from proxies, Wikipedia has a decent article on this, too. The Wikipedia page also has a graph that shows even less variation in temperature than the one above:

The numbers you are throwing around in your "just imagine" scenarios seem to be ones that you have a lot of confidence in. The problem is that they also appear to disagree with broad swaths of the scientific literature. You appear to be claiming that science is unsure of what happened in the past - but you are. It seems highly unlikely that you are correct.
If you want to have any credibility here, you are going to have to provide references to the numbers you post. This is not a site where you will be permitted to post a lot of unsubstantiated opinion. As you are a new user here, I strongly suggest that you read the Comments Policy.
- Solar cycles cause global warming
MA Rodger at 19:51 PM on 31 March, 2023retiredguy @60,
A pointed out by responding comment, Beer et al (2000) is quite old and struggles with its solar irradience reconstruction. A more recent paper of which Beer is a co-author is Gray et al (2010) 'Solar influences on Climate'. This concludes by saying:-
Despite these uncertainties in solar radiative forcing, they are nevertheless much smaller than the estimated radiative forcing due to anthropogenic changes, and the predicted solar cycle‐related surface temperature change is small relative to anthropogenic changes.
- Solar cycles cause global warming
Bob Loblaw at 11:09 AM on 31 March, 2023retiredguy:
You have linked to the publisher's site, which only has a portion of the paper visible (along with "Access through your institution" and "Purchase PDF" buttons). Google Scholar led me to a full version here.
The first half of the paper simply reiterates a variety of reasons to expect variation in solar input to the earth system on a variety of time scales, without getting into specific solar irradiance values. They also talk about the importance of spectral variations - in addition to simple variations in total energy input.
In section 3.1, they cover "the reconstruction of the past solar irradiance". In that section, they state (emphasis added):
"Our own irradiance reconstruction is based on the frequency of the Schwabe cycle because we find a better fit with the temperature data if we assume a linear relationship between cycle frequency and irradiance (Fig. 7).
Their figure 7 is a graph of the reconstructed solar irradiance. It shows a solar irradiance value of about 1362 W/m2 in 1850, and a value of about 1366 W/m2 in 1990, for a difference of 4 W/m2. The wiggles in their reconstruction go as low as 1361 W/m2 in 1900, up to 1364 W/m2 from 1920-1950, and down to 1362 W/m2 around 1965.
Skeptical Science also has another page on "It's the sun". On that page, we see another solar irradiance reconstruction:

Note that the reconstruction from the paper you linked to shows much more variability and range. Their figure 7 mentions a "14-y low-pass filter", so it should probably be compared to the 11-year average in the above figure.
So, the first thing is that they have estimated a much larger change (about 4x) in solar irradiance over the 1850-1990 period than most other sources. This would explain their conclusions that solar forcing is a strong effect.
So, you have to ask, which solar reconstruction is better? Well, I think the clue is in the section I quoted and highlighted above, regarding their choice of method of reconstruction:
"...because we find a better fit with the temperature data..."
To put it bluntly, to claim that solar forcing is an important factor affecting temperature after choosing a solar reconstruction "because we find a better fit with the temperature data" is plain bad science. In all likelihood, they have erroneously fitted other causes of temperature change into their solar reconstruction, which leads to an overestimate of the magnitude and importance of solar forcing.
I notice their figure 10 is also for northern hemisphere temperature, not global. They do talk about the two hemispheres in the text, but I don't see an explanation as to why they did not use global temperature in their final evaluation.
In short, the main weakness is that they have a really bad solar irradiance reconstruction.
- It's not bad
PollutionMonster at 11:08 AM on 21 February, 2023Eclectic @410
Right now I am talking with a person who's position is ambiguous. The individual claims they are not a climate denier. Yet, they make many of the denier's talking points. Similar to dog whistling. My guess is they are a climate change denier, but won't admit it.
Instead, hiding behind how much the "working class" is harmed by "rip off merchants". Sample argument below:
"But I'm not a Trump supporter or a climate change denier I'm concerned about costs to the working classes you claim you are also yet you sound exactly like one of the rip off merchants who feign concern over the planet yet profit significantly from forcing people into green schemes they cannot support, you have no explanation on how it's in anyway reasonable to expect people to pay for electric cars or solar panels, you also want to punish them further by insisting they cycle long distances to work in every sort of condition." sample probably climate change denier argument
This seems like classis motte and bailey strategy to me. My advice to you is push a little further than you feel comfortable into the innermost motte by pushing climate change action. Giving no place to retreat, this advice is from the skeptics guide to the universe book by Steven Novella, MD.
I've found very few climate change deniers will straight out deny warming. Instead, hiding behind more "moderate" stances. The result is the same whether a hardcore or moderate denier, slothful climate action. Anti-vaxxers do the same, "I'm not anti-vaxx I am anti-mandate and mask".
I. Ban Gasoline leafblowers. One of my favorites to show climate change mitigation can be very small. Many people want to get rid of them anyways.
II. Transfer fossil fuel subsidies to renewable. Showing the true cost of fossil fuels.
I think you are 100% correct about persuading the onlookers. Good points on A, B, and C I will try them. C seem very interesting the part about denialists hating the idea of refugees and migrants. :)
- It's the sun
MA Rodger at 19:14 PM on 12 February, 2023Philippe Chantreau @1312,
While Curry is evidently referring to the ACRIM gap of 1989-91 when she talks of "a gap in the satellites measuring the sun's output that occurred at the time of the Challenger shuttle disaster" of 1986, mainly because there is no other "gap". But her reference to AR6.6 'Short-lived climate forcers' as giving discussion of some "great uncertainty in the amount of solar forcing in the late 20th century" that "arises" from the ACRIM gap is deluded nonsense. AR6.6 concerns aerosol forcing and thus the solar aspects of this and nowhere considers any gaps in TSI data.
As you say, the ACRIM gap was an issue of long ago although I think it remains an issue when used in historical proxy TSI reconstructions and whether the Maunder Minimum TSI was 1Wm^-2 or 2Wm^-2 lower than today. But this is not apparently what was Curry attempting to describe in her deluded rant. (The graphics below are from an Andy May discussion of TSI dated 2018.)


- It's the sun
MA Rodger at 02:10 AM on 12 February, 2023The link given @1305 leads me to a bunch of YouTube adverts but if you specify a time with the link, the Curry/Peterson nonsense appears. Thus:
https://www.youtube.com/watch?v=9Q2YHGIlUDk&t=60s
Below the video there is a box that can be expanded with a 'show more' tab and that shows a list of a couple of dozen parts to the video (called Chapters) and one of these does mention things solar (which was what panhuag @1306 was asking about) 'The Challenger explosion, how the sun affects climate'. This provides the following from Curry:-
"Once you get into the sun, it's even crazier. The IPCC has pretty-much dismissed the role of the sun in the last 150 years but the interesting AR6.6 finally acknowledged the great uncertainty in the amount of solar forcing in the late 20th century and this arises from ... a gap in the satellites measuring the sun's output that occurred at the time of the Challenger shuttle disaster... So one solar sensor was running out and they were supposed to launch another one but all the launchers were put off for a number of years until they sorted out... (the launchers). So there's a so-called gap which depending on what was happening in that gap, you can tune the solar variability to high variability or low variability. So all the climate models are being run with low solar variability forcing.
For the first time in AR6.2 (2.2.1), the observational chapter acknowledges this issue, that there are huge amounts of variability.
And this doesn't even factor in the solar indirect effects.... It's not just the heat from the sun. There's a lot of issues related to UV and stratosphere and cosmic rays and magnetic fields and all these otehr things that really aren't being factored in. They're at the forefront of research but they're certainly not factored into the climate models so there are so many uncertainties out there that affect certainly the projections of what might happen in the 21st century but also our interpretation of what's been going on with the climate for the last 100 years and exactly what's been causing what.
A quick look at AR6.2.2.1 shows Curry is doing particularly well ast spouting nonsense here.
- From the eMail bag: A Review of a paper by Ellis and Palmer
Bob Loblaw at 03:43 AM on 9 October, 2022The albedo argument of Ellis and Palmer is an odd one. They explicitly state in their section 3.2 that they think it is incorrect to consider the albedo effect as a global one. In discussing the common approach to albedo feedback amounts, and comparing it to the CO2 feedback, they state:
The strength of the albedo feedback was calculated as being in the same range, or about 3 W/m2 over the full interglacial cycle (Hansen et al., 2012, Fig. 5c and p12). This figure was derived by equating albedo with sea levels, and therefore with ice extent, which spreads the albedo effect out across the entire globe in a similar fashion to the calculation for CO2. But this is likely to be an erroneous procedure.
They go on to argue that their localized "one day, one latitude" calculation of radiative effects is the proper one to use. They conclude one paragraph with:
As Fig. 3 clearly demonstrates, interglacials are only ever triggered by Great Summer insolation increases in the northern hemisphere and never by increases in insolation during the southern Great Summer, so why spread the influence of albedo across the entire globe?
To put it simply, the change in local or regional albedo represents one part of global albedo. To address the question of how much solar radiation the globe absorbs (which is the proper question for looking at global climate), you need to consider all of the globe - each latitude, each day, and each individual surface cover. The contribution of a single location is directly proportional to the area it covers - as a fraction of the total area of the planet.
Global changes in global albedo, caused by large white ice sheets replacing dark forests (or the reverse), is an important feedback. When climate science speaks "albedo feedback", it is this large scale issue that they mean, not Ellis and Palmer's local microclimate one.
The Rapp et al unpublished paper that MA Rodger refers to is an interesting side note. It still focuses on albedo and high-latitude insolation. It at least considers the entire year, not just the summer solstice, but it's efforts at modelling still are extremely simplistic - empirical fits between ice volume and variations in solar input. No actual climate model to provide precipitation inputs or melt processes, or glacier dynamics models to accumulate ice and move it from zones of accumulation to zones of melt.
The Rapp et al paper also seems to be rather confused about CO2 as a feedback vs. CO2 as a forcing. They argue against a straw man: that mainstream climate science thinks that CO2 is supposed to force the glacial/interglacial cycles. (It does not.) CO2 is one feedback. The overall CO2 level influences whether climate will respond to Milankovitch cycles by producing glacial/interglacial cycles, but it does not cause the individual glacial/interglacial periods. A world at 200 ppm CO2, a world at 300 ppm CO2, and a world at 450 ppm CO2 will not respond to orbital changes in solar insolation in exactly the same way.
- There's no tropospheric hot spot
MA Rodger at 01:01 AM on 23 August, 2022Cedders @33,
On boosting search rankings, the promotion from page 1,000 up to page 900 because a URL is used a single timesomewhere on the inerweb in my view is not very significant. If you want to give your webpage a proper boost, you'd use other means. But saying that, I do get criticised occasionally for using denialist URLs and thus boosting their rankings (and I am no expert in the matter). You can apparently make such a use without any boost whatever using the 'nofollow' extention in the HTML of a URL (but I'm not sure how you'd use that in the SkS URL inserter).
On the URL content, I haven't looked down that URL yet. And it is useful to take the whole argument thus presented (so I 'look forward' to all 24 pages of it) as one approach to dismissing a difficult bit of debunking is to point to all the obvious nonsense argued alongside the difficult debunking. This is of course an ad homenem logical argument but without the difficulty being resolved (one way or the other) it is not in any way a logical fallacy.
On atmospheric cooling from CO2, the equilibrium in the energy balance will be restored following a CO2 forcing. This would result in the troposphere warming by +1ºC per 2xCO2 increase (without feedbacks) which will act over the whole blackbody emissions spectrum of 7.5 to 100 microns, this balancing the +3.7Wm^-2 forcing from the CO2.
When it comes to the CO2 forcing itself, CO2 emissions only acts over a small part of the global emissions spectrum. See fig 5b3 of that useful paper Zhong & Haig (2013) 'The greenhouse effect and carbon dioxide' which shows the spectrum of a CO2 increase 389ppm to 878ppm (2xCO2 from 2013) and how the central micron of the emissions are already past the tropopause and thus cooling the planet rather than warming it. Thus the 3.7Wm^-2 CO2 forcing comes from a rather narrow part of the spectrum 13¼ micron to 16¾ micron (less that central 14½ to 15½ now operating to cool the planet). To make this narrow band have such a big effect, it has to result from a cooling of the emissions altitude, a cooling far bigger than the average that would be required over the full blackbody spectrum. So that emissions altitude increases on average enough to perhaps give you 10ºC drop in temperature.
Do note that the CO2 emissions will be reaching space from vastly different altitudes. The central part of the emissions are up in the stratosphere while the edges of the emissions will be low down in the troposphere. The bits inbetween the edge and the centre will thus stretch all the way up. So this effect will apply to the whole troposphere.
So the emissions altitudes post forcing will rise and thus become cooler by a far bigger amount than the compensating warming of the troposphere to reach post-forcing equilibrium. And that cooling will drop the emissions into space. So any diural temperature variation due to loss of daytime solar warming will be less due to this cooling/drop of IR emissions.
On the significance of this cooling. Meanwhile, because the emissions altitude is higher, there will be a drop in the pressure of the emissions altitude although only for the O2 & N2. The extra CO2 will presumably mean CO2 will be effectively constant. And this drop in pressure will mean a drop in the air's Specific Heat Capacity. (The temperature effect on SHC will be pretty flat.) And this drop in SHC will mean that for a constant loss of energy through the night, any diurnal cooling will be larger. This then operates in the opposite direction to the reduction in IR caused by the cooler emissions altitudes which will lower the energy loss and thus reduce the diurnal range.
And so the question is which effect is the larger? Indeed, are they of a significantly similar size? And given that, is the effect significant for the diurnal temperature range?
Given the proposal comes from this denialist URL, that is perhaps the first place to look for answers. So I will be looking at those 24 pages (although prior to that my own very cursory work on the first two of those questions suggests the pressure/SHC is the larger effect with a ration of 3:1).
I hope all that makes sense.
- It's the sun
MA Rodger at 22:04 PM on 3 August, 2022cgfree59 @1301,
The best initial assessment of any work by the Connolly brothers or Willie Soon is to assume it is yet another pile of their usual nonsense (I was much surprised recently seeing an NSIDC blog actually citing one of their papers for real!!) and given the lengths they go in obfuscating and misdirecting folk, this is not entirely a falacious use of an ad hominem argument.
There are responses to this particular serving of nonsense Connolly et al (2021) 'How much has the Sun influenced Northern Hemisphere temperature trends? An ongoing debate' (thus a layman's efforts or a reply from the numpties themselves to a criticism of press coverage of their paper) but I do not see anything here at SkS.
The conculsions of Connolly et al (2021) are to assert that the IPCC is premature with its conclusions as it ignores certain estimates of TSI and thus solar forcing which provide radically different results to the global warming attribution reached by the IPCC.
"Different TSI estimates suggest everything from no role for the Sun in recent decades (implying that recent global warming is mostly human-caused) to most of the recent global warming being due to changes in solar activity (that is, that recent global warming is mostly natural)."
You could expend time and effort trawling though Connolly et al (2021), picking out the obfuscation and misdirection they employ but the crux of it is the crazy method they use. That is they the employ blind curve-fitting of their preferred solar-caused climate forcing onto some crazy NH temperature estimates and only after this first-step into the lunatic asylum do they then get to attributing the left-overs of any temperature trends to anthropogenic forcings.
So the results are pure nonsense.
Further a rather telling observation is that of these TSI estimates which they claim are being ignored (TSI High Variability Estimates all plotted out in their Fig 3), only two would allow any naive correlation between rising global temperature with TSI through the all-important "recent decades."
One of these two exceptional TSI estimates was scaled from a postage-stamp-size graphic in Ammann et al (2007), a paper which contradicts the muppets in that it concludes:-
"Although solar and volcanic effects appear to dominate most of the slow climate variations within the past thousand years, the impacts of greenhouse gases have dominated since the second half of the last century.
The second is cherry-picked TSI estimate is from yet another tiny graphic (Fig 5b of Egorova et al 2018) in turn the trace being based on Muscheler et at (2016) which employs proxy data to create estimates of TSI, so not a precise method you would want to put much faith in.
The numpties offer no comment on such an obvious problem with their grand thesis, that it has such a narrow and less-than-reliable basis for the singularly important calculation within their account. Such an omission is a sign that you have strayed from reasonable analysis and entered the lunatic asylum. - From the eMail Bag: a review of a paper by Ziskin and Shaviv
Bob Loblaw at 10:14 AM on 3 August, 2022Hello, yanirdz. Welcome to Skeptical Science, and I hope that this is a useful resource.
The short story is that the model used by Ziskin and Shaviv introduces an "indirect solar effect" that is based on an index (the AA index) that starts positive and grows over time (figure 4). All other forcings (direct solar, CO2, aerosols, etc.) represent a departure from equlibrium - i.e., they would have a value of zero in a stable climate, and a non-zero value would push temperatures away from that equilibrium (warmer, or colder, depending on whether the value is positive or negative).
Since the AA index is always positive, it is always "causing" a warming trend in the model output of temperature. And since the AA index increases over time, it pushes the temperature warmer and warmer. The AA index never has a value of zero, so it can never not contribute to warming in the model.
...and as a result, the observed warming over the past century gets "explained" by the "indirect solar effect", because the model is created in such a way that the "indirect solar effect" absolutely must cause warming. And since the "indirect solar effect" must cause warming, the fitting of the model to actual observations must reduce the warming effect of anything else (e.g., CO2).
Really short version: they assumed continuous warming due to the "indirect solar effect" when they built the model, and therefore their "conclusion" is not a conclusion, it is their original assumption.
Minor point: they have a multiplier (fudge factor) for the "indirect solar forcing" that hypothetically could have a zero value, making the AA index always zero, or even negative (see the last row in table 2 in their paper). The fitting process, though, finds it easier to use the always-positive AA index to "explain" the warming, instead of CO2 or direct solar, etc.
Feel free to ask any further questions.
- Skeptical Science New Research for Week #28 2022
One Planet Only Forever at 08:15 AM on 15 July, 2022“Communication of solar geoengineering science: Forms, examples, and explanation of skewing” is interesting with some points meriting some consideration. I have not thoroughly read the item. But I have read enough to make the following critical observations (making no mention of points I consider worthy of consideration). I will carefully read the entire document to see if my initial impressions presented below need to be revised.
1. The author appears to have sought out examples that fit their desired conclusions. Then they played some games to get a 'best fit'. They provide no examples of the opposite of the type of examples they chose to focus on.
2. The author appears to be unaware that there is an important distinction between solar radiation modification (SRM) and medical treatments (they make many subjective comparisons between SRM and medical treatments - like "This important distinction can be clarified by analogy. Despite its own risks and negative side effects, chemotherapy is sometimes used to treat cancer."). Most medical treatments by something like:
- initial rigorous testing on non-humans,
- if the non-human treatment passes that initial testing then testing is done on a small number of carefully selected humans,
- if that testing is passed then testing is done on a larger and broader population,
- if that testing is passed then testing is done on an even larger and broader population.
And medical treatment tests are often done for a long periods of time to potentially discover unanticipated long-term consequences. COVID-19 vaccine testing was an exception to the longer-term testing of other medical treatments because of the clear evidence of the risk of significant harm done by COVID-19 infections.
There do not appear to be any non-planetary objects to meaningfully experiment SRM on. There are not hundreds of planets to have the second testing run on. There are not thousands of planets to have subsequent testing done on. There is this only one planet that, without humans messing it up by behaving like an asteroid, should be habitable for humanity for 10s of millions of years.
It is absurd to suggest that it is acceptable to run a global experiment on the planet. It is especially absurd to suggest the ‘need for, and benefit of, an SRM global experiment’ because leaders will not do what needs to be done (disappoint a portion of the global population that believes it is superior). Global Leadership needs to rapidly end the continued forcing of CO2 and other ghgs into the atmosphere )(which is an unacceptable global experiment that is not ‘mitigated’ by additional global scale experimentation).
3. The conclusions by the author regarding reasons for concern about how scientific presentations on SRM may be interpreted fails to mention the potential for political leaders (policy-makers) to be tempted to consider the potential for SRM to be a ‘solution’. The author appears to be unaware that some policy-makers have already exhibited a willingness to seek excuses for increasing harm to be done to future generations by the global leadership of the current generation failing to effectively reduce the harm being done. Some political game players may even selfishly consider it acceptable to delay the reduction of harm done, do more harm, because ‘future generations should be able to develop and use SRM’.
That said, climate science is complex. And the diversity of action plans in response to the undeniable harm being done deserve consideration - never losing focus on the need to limit the harm done, and never forgetting how unexpectedly harmful human actions can be.
- It's albedo
Bob Loblaw at 09:04 AM on 3 March, 2022I have been watching this discussion for a while, and I too have a really difficult time understanding what blaisct's real purpose or argument is. With respect to albedo, it seems as if he is implying that albedo causes the change in climate, while ignoring the possibility that other factors are changing the climate and albedo is responding to that - the classical albedo feedback that is a standard part of climate science.
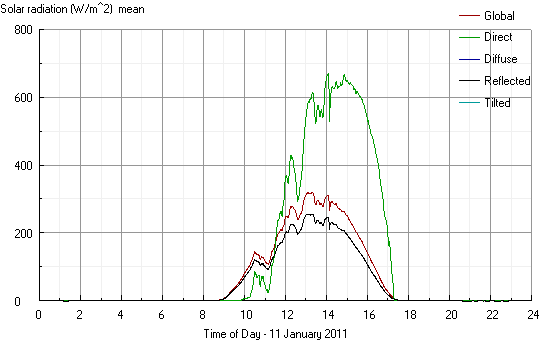
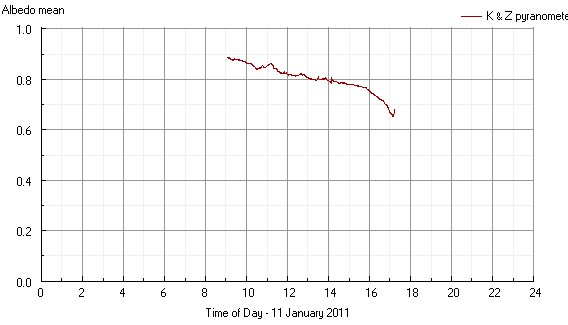
I have access to some high temporal resolution surface radiation data from a continental location. Let's look at four graphs of daily values:
January radiation and albedo:
...and the same location in July
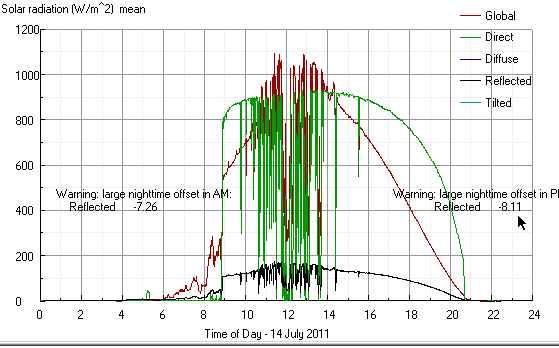
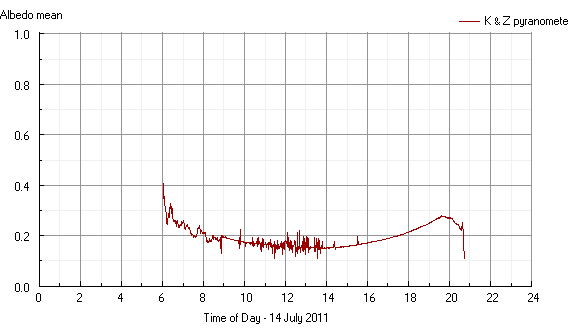
Let's talk about the last two first. It's a mostly sunny day. with some morning cloud and mid-day scattered cloud. Global radiation peaks at over 1000 W/m2. There is a strong diurnal pattern to albedo - lowest in mid-day (less than 0.2), and highest around sunrise and sunset (around 0.3).
Then let's compare these to the first two, from January. A similar day in the sense of morning cloud and afternoon clear skies, but global radiation is much lower - (peaks at about 300 W/m2). Albedo is quite different - it drops from about 0.9 in the morning to
I also know a bit about the temperatures on each day. In July, it was much cooler in the morning and evening, and hottest in the early afternoon. January was much, much colder.
Should I assume that the differences in albedo have caused those temperature differences? After all, there is a strong correlation: albedo drops, and temperature rises. Very high albedo? Very cold temperatures!
...but all I have done is shown that winter is colder than summer, so you can get snow on the ground instead of agricultural crops. After all, the energy input from solar radiation in January peaks at 30% of what it was on that July day, even if we don't account for the higher January albedo and shorter daylight period.
And the diurnal cycle in July? It is well-known and well-documented that surface albedo shows variability with solar zenith angle in clear skies. The sun is high in the sky at solar noon (which is about 1pm clock time on these graphs), and low in the sky at sunrise and sunset. It's not the albedo that is driving temperature differences: it is the change in solar input.
Nothing surprising here. Albedo differences are the result of other factors that affect weather and climate.
I think the same applies to blaisct's humidity and cloud arguments. There is nothing that I can see in his comments that gives any evidence that albedo or humidity are the driving force behind changing climate - they can (and are more likely to be) the result of a changing climate. A feedback, not a forcing.
- It's albedo
MA Rodger at 23:36 PM on 10 February, 2022blaisct @115,
And concerning your second question - "If all the global warming, GW, came from CO2 radiative forcing alone would not a graph like @111 be flatter...?"
The 'graph @111' is Fig 3 of Dübal & Vahrenholt (2021) and specifically shows a quite-dramatic reduction in albedo 2001-20 with a trend of -0.70Wm^-2/decade. Fig 1 shows a reduction in solar of -0.03Wm^-2/d. Thus Figs 1 & 3 matches Loeb et al (2021) Fig 2d with Absorbed Solar 2002-20 given as +0.67Wm^-2/d. Loeb et al Fig 2d also presents an attribution of this increased absorbed solar warming 2002-20, ☻ 60% cloud albedo, ☻ 7% water vapour, ☻ 4% GHGs, ☻ 26% surface albedo, ☻ 3% aerosol. And note also that Loeb et al Fig 2a shows this 'quite-dramatic' effect occurs almost totally 2013-20.
To explain this attribution; if 4%+7% of this increase-in-Absorbed Solar (decrease-in-albedo) is attributed to GHGs, this means additional GHGs+water-vapour is directly preventing solar being otherwise reflected away and instead directly absorbed by the increased GHG+water-vapour. The underlying cause for the water vapour increase is of course AGW.
Your question implies that you consider there is something other than AGW and increased CO2 driving a significant part of this increase-in-Absorbed Solar (decrease-in-albedo) 2002-20. I don't think I could agree.
Loeb et al does identify the geography of the various components of the net EEI, mapping them out in Fig 3 and pointing to the Surface effect being "greatest in areas of snow and sea-ice, where significant declines in coverage have been observed in recent decades." It is, of course, easy to see that the ice-loss is due to AGW.
And for the biggest component, Cloud, Loeb et al says "Regional trends in net radiation attributable to changes in clouds are strongly positive along the east Pacific Ocean, while more modest positive trends occur off of the U.S. east coast and over the Indian, Southern, and central equatorial Pacific Oceans." Is this the finger print of AGW? If it isn't, it would require an alternative causation.
If AGW is the cause, note that the increase-in-Absorbed Solar (decrease-in-albedo) 2002-20 is mainly occuring 2013-20 which matches the global temperature record showing 70% of the 2002-20 warming occurred in the period 2013-20.
So without further explanation, I see no reason to expect a "flatter" slope from CO2-forcing alone, the slope being presumably all down to AGW.
- It's albedo
MA Rodger at 21:07 PM on 15 December, 2021blaisct @108,
I would strongly suggest that you take the assertions regarding the underlying causes of trends in EEI set out in the papers you call "Earthshine 20 years" (aka Goode et al 2021) and "CERES 20 years 1" (aka Dübal & Vahrenholt 2021) with a large pinch of salt. Their speculations about the reasons for the EEI data are entirely unsubstantiated.
The third paper you cite as "CERES 20 years 2" (aka Loeb et al 2021) is a more considered analysis as it uses a modelled analysis (setout in its section 2.3) to derive the underlying causes of recent trends in EEI. Shown in their Fig 2f, Loeb et al find the overall EEI trend is dominated by 4 positive and 1 negative factor. You appear not to grasp that the positive factor "other" is the GHG forcing (with a small negative contribition from solar forcing through the period 2002-20). Also the water vapour factor results from a GHG forcing feedback. Thus your speculation doubting the contribution of "any AGH global warming mixed In with the TOA (red) data" is entirely misplaced. And do note that this is the change in EEI through the period. An EEI had been established by GHG forcing prior to this period while the analysis looks solely at the trends (ie changes) 2002-20.
Simply I do not see Loeb et al (2021) anywhere "express doubts on the current understanding of climate change."
I find most of the latter part of your comment most bizarre. I refrain here from explaining where you appear to be in error as you do run such a long way with your theorising. But if you wish such explanation, do say.
- It's albedo
blaisct at 05:08 AM on 15 December, 2021Once again thanks for your comment (MA Rodger and the editor) and the additional papers on the subject. I will try to do better with the links.
The earlier data I was referring to was earthshine 10 years and CERES 10 years which showed that the data for the earths albedo was very noisy and flat. The flat part was what was expected for anthropogenic greenhouse gas , AGH, global warming. My initial understanding of AGH radiative forcing was that AGHs absorbed radiation (got hot) and that the higher the AGH concentration (at constant radiation) the more heat it could hold back thus the temperature would increase but the energy in vs out of the zone where this occurred would be the same (albedo would be flat). My understanding has been expanded to include: AGHs hotter temperature will reduce humidity and thus reduce cloud cover, expose more earth surface to the sun thus reduce earths albedo; therefor, albedo vs time for AGHs may not be flat.
The new (new to me) data I sited Earthshine 20 years showed a decrease albedo from both earthshine and CERES data – my only interest is this report was the agreement with earthshine an CERES data. The editor’s link CERES 20 years 1 and another link CERES 20 years 2 provided a lot more CERES data with different analyses. These three papers are the first time I have seen data showing a decrease in albedo (increase in TOA radiation) vs time. If all climate change was due to AGHs this graph would be flat. Using the CERES 20 years 2 graph for TOA radiation out. (of the three links I chose this one because it has the In Situ data (earth surface temperature)) one can see the good correlation between In Situ data and CERES data

Figure 1
“Comparison of overlapping one-year estimates at 6-month intervals of net top-of-the-atmosphere annual energy flux from the Clouds and the Earth's Radiant Energy System Energy Balanced and Filled Ed4.1 product (solid red line) and an in situ observational estimate of uptake of energy by Earth climate system (solid blue line). Dashed lines correspond to least squares linear regression fits to the data.”
. If there was any AGH global warming mixed In with the TOA (red) data it would have a slope lower than the In Situ data. The report CERES 20 years 1 did look for the AGH flat line signal and found it in the “Clear Sky” LW (long wave) data but nowhere else (1 of four graphs).
Two of these reports put a lot of emphasis on clouds decrease (new to me). (Decrease in cloud cover increased surface exposure to suns radiation and heats the earth more.) The report CERES 20 years 2 also found correlation to Water vapor, trace gases, surface albedo, as well as clouds. Both of these reports express doubts on the current understanding of climate change and make recommendation to further understand what is causing cloud cover to change.
While this new data is interesting and worth following up on it is still very noisy (low R^2) and another 20 years would be better.
I recognize that AGH global warming would promote other forcing including reduce clouds, reduced ice, reduced snow cover all exposing more surface to direct rays of the sun. Other man-made albedo changes can do the same thing. Here are two examples that may relate to the new papers.
Let’s start with the “heat island effect”, UHI. While the global warming from UHI’s lower albedo is small it does have observable effect on cloud formation, CERES 20 years 2.

“Figure 3
Attribution of Clouds and the Earth's Radiant Energy System net top-of-atmosphere flux trends for 2002/09–2020/03. Shown are trends due to changes in (a) clouds, (b) surface, (c) temperature, (d) combined contributions from trace gases and solar irradiance (labeled as “Other”), (e) water vapor, and (f) aerosols. Positive trends correspond to heat gain and negative to loss. Stippled areas fall outside the 5%–95% confidence interval. Numbers in parentheses correspond to global trends and 5%–95% confidence intervals in W m−2 decade−1.”
When air rises from a UHI it is hotter than the incoming air without a source of moisture to saturate it; so, it leaves as dryer air. This air generally rises and moves to the east. Look at figure 3 (a) and see the lower cloud formation change off the coast of east USA, Tokyo, and downwind Europe. With time (1880-2021) the UHI does not get hotter but it gets bigger thus the volume of low moisture air gets bigger. I am not going to argue the significances of the albedo part of UHI other than to recognize it is lower than 1 W/m^2 but not zero. What UHI is not given credit for is what happens downwind to this hotter low humidity air. Does it cool the ocean, reduce the snow line, melt ice, or reduce the cloud cover down wind, since this hot dry air should rise the clouds should be the first target. I can also see a chain of events: Hot low moisture air (from AGHs, UHIs, or other land changes) rises and go downwind, reduces cloud cover, over water the sun heats the ocean, the hotter ocean currents circulate to the poles, and melt some ice.
I’ll leave the quantification of this observable (figure 3 (a)) new (to me) correlation to others. A new UHI contribution to GW will be the albedo effect + the lower cloud effect + any other.
Second, is land use changes such as forest to crop or pasture land or grass land to crop land. Albedo decrease in grass land to crop land change is documented in Grass to Crops. Forest to crop land change increase in albedo is documented in Forest to Crops. Over 205 years the paper Global albedo study calculates that all the pluses and minuses add up to little change in albedo from land use changes. It is assumed (by me) that decreased albedo of a parcel of land means an increase in temperature and vs/vs. The study Amazonia Forest to Crops shows that increasing albedo does not always mean cooler temps. This report shows that when rain forest was replaced with crop land that the temperature increased, the rain decreased, and the cloud cover decreased. The Figure 3 (e) above shows bright red spot for “water vapor” (I assume that is change to lower humidity) in Amazonia. This is not an uncommon effect from replacing forest with crop or pasture land. The report Forest study observes that forests vs crop/pasture conversion gets warmer as the conversion gets south of 35’N latitude.
This unintuitive (to me) observation that an increase in albedo does not always result in a decrease in temperature can be explained by moisture. The resulting temperature depends on a constant enthalpy (total heat in the air= gases + moisture). Enthalpy is usually determined by the albedo (higher albedo lower enthalpy vs/vs); therefore, land exposed to the same albedo (enthalpy) can have a wide range of temperatures depending on the moisture (relative humidity) of the albedo (enthalpy). This relationship has been captured in a psychrometric chart,
(Sorry for the poor quality of this chart)
Example of a rain forest conversion to crop land: Start out with a rain forest at 25’C (bottom scale) go straight up to 90% humidity curve; this is our hot humid rain forest. If we convert this rain forest to crop land with a higher albedo, we move to a lower enthalpy line (anyone will do). The constant enthalpy line run diagonal (upper left to lower right). If the moisture is maintained at 90% the temperature will drop as expected for the higher albedo. Following the same enthalpy line (same albedo) go to a lower humidity curve that may result (and does in Amazonia) and one will see the temperature will increase (even to above the starting rainforest temperature at very low humidity).
A concern is how NASA and the IPCC pair surface temperature data with relative humidity and albedo. The three all connected in enthalpy. A misunderstanding of climate change could occur if Amazonian (rain forest to crop land) high albedo, high temperature, lower humidity type data was included in correlations with Canadian (forest to crop land) lower albedo, cooler temperatures, high humidity, type data. Does anyone know if this has been looked at? The report CERES 20 years 1 has looked at ocean enthalpy correlations. I have not seen any land enthalpy data. - It's the sun
cph at 21:57 PM on 11 November, 2021
Diagram showing the monthly fluctuations in total global cloud cover since July 1983. During the observation period, the total amount of clouds fluctuated from about 69 percent in 1987 to about 64 percent in 2000. The annual variation in cloud cover follows the annual variation in atmospheric water vapor content, which presumably reflects the asymmetrical distribution of land and ocean on planet Earth.
Within the still short period of satellite cloud cover observations, global cloud cover reached a maximum of about 69 percent in 1987 and a minimum of about 64 percent in 2000 (see diagram above), a decrease of about 5 percent. This decrease corresponds roughly to a net change in radiation of around 0.9 W / m2 within a period of only 13 years, which can be compared with the total net change estimated by the IPCC 2007 report from 1750 to 2006 of 1.6 W / m2 for all climate drivers including greenhouse gas emissions from fossil fuel burning(cooresponds to your mentioned 2,5-3W/m² in 2021). These observations leave little doubt that cloud cover variations can have a profound impact on global climate and meteorology on almost every time scale considered.
The total reflectance (albedo) of the planet earth is about 30 percent, which means that about 30 percent of the incident short-wave solar radiation is reflected back into space. If all the clouds were removed, the global albedo would drop to around 15 percent and the short-wave energy available to warm the planet's surface would increase from 239 W / m2 to 288 W / m2 (Hartmann 1994). However, long-wave radiation would also be affected, which emits 266 W / m2 into space compared to the current 234 W / m2 (Hartmann 1994). The net effect of removing all clouds would therefore still be an increase in net radiation of around 17 W / m2. So the global cloud cover has a significant overall cooling effect on the planet, although the net effect of high and low clouds is opposite.
HK: - "but also through its warming effect through its strong greenhouse effect, which is the most important of all positive (reinforcing) feedbacks on a global level."

According to the current status, the net radiation effect of clouds is -19W / m² (Wild 2019) and corresponds very well with + 0.9W / m² per 5% less cloud cover.
High levels of global cloud cover are associated with low global temperatures, demonstrating the cooling effect of clouds. A simple linear fit model suggests that a 1 percent increase in global cloud cover corresponds to a global temperature decrease of about 0.07 ° C.
- SkS Analogy 24 - Atmospheric Carbon Loans
RedBaron at 09:35 AM on 28 October, 2021The kinds of food you eat have from little to nothing to do with Anthropogenic Global Warming (AGW) caused climate change, one way or the other. Rather, how and where what you eat is produced would have a much bigger impact. In fact being vegetarian worldwide could even be counterproductive in the fight to end climate change.
The reason for the confusion is what they call a “life cycle assessment” in calculating carbon footprints.
Product Life Cycle Accounting and Reporting Standard: This standard involves understanding GHG emissions related to a specific product, based on raw materials used, production, distribution, and disposal. [1]
Just to simplify things a little, lets break down the carbon footprint of a tomato.[2]
The primary importance in calculating tomato carbon footprints depend on the season and the type of production system as well as transportation, storage and refrigeration.
Basically you figure out the amount of fossil fuels used in the chain of supply from the farmer to the fresh market. Greenhouses need heated in winter, and cooled in summer. The fertilizer used could possibly be made from haber process nitrogen[3] which is made from Natural gas. Trucks deliver the tomatoes to markets and burn fossil fuels to get there. The market probably uses electricity made from fossil fuels to keep the air the ideal temp for storage and prevent them from spoiling. All of these factors added up together give us a quantified idea of the total fossil fuels used and a carbon footprint is calculated for each pound of tomatoes. Basically the tomato itself, like all food, has no global warming effect at all, but all the other things like fertilizers, production, distribution, and storage do!
So how do we fix this?
Well starting with fertilizers. Instead of haber process nitrogen used to make NPK fertilizers, we could use natural fertilizers like compost and manure. That would greatly reduce the carbon footprint of food production worldwide. Geothermal and solar heated and cooled greenhouses eliminate the need for fossil fuel use in out of season tomatoes.
Next is location. The backyard grown garden tomato has no transportation needed. A local organic farmer might have some fuel costs to drive to the local farmers market, but minimal if a close neighbor. Also electric vehicles, powered by electricity produced by hydroelectric, wind, solar, nuclear, have almost no carbon footprint. So transportation improvements and shopping local or growing a garden can reduce the tomato carbon footprint a lot. If you need a fresh tomato out of season, make sure the greenhouse growing the tomato is local. If it is an organic, geothermal heated, local greenhouse produced tomato, all the better!
One thing typically not included in calculating the carbon footprint of a tomato is soil carbon. It should be, but isn’t typically included because data is limited. Certain production methods (mostly organic and permaculture methods) have been shown to improve soil carbon dramatically. This soil carbon would need to be subtracted off the emissions side of tomato production. It is theoretically possible then to produce a tomato that has a negative carbon footprint, as long as the production method increases soil carbon more than the emissions caused by fertilizers, production, distribution, and storage.
Soils from organic farms had 26 percent more potential for long-term carbon storage than soils from conventional farms, along with 13 percent more soil organic matter (SOM).[4]
Better data would be needed to actually calculate carbon footprints based on soil carbon. But it is clear that some farmers have been able increase the carbon in their soils, and as long as the other side is not too high by using some of the above solutions to reduce emissions, we should be capable of mass producing tomatoes with negative carbon footprints! We are not now, not at any scale to speak of at least. But we potentially could!
Being a vegetarian could in fact be quite helpful in mitigating climate change, as long as the vegetables were fertilized, produced, distributed, and stored in these improved ways! Every bite you took of vegetables you eat could actually by a tiny amount mitigate climate changes caused by us humans! Not a lot mind you, but there are billions of people on this planet, and if enough of them did this, a little multiplied by billions of bites could indeed add up to a big improvement!
What about meat?
There is one thing that needs addressed though. Meat production is very similar to the above. Carbon footprints of meat production are all life cycle calculations as well! Most the carbon footprint for animal foods also lies in production, distribution, and storage! However, if what we feed a chicken or a cow etc has a positive carbon footprint, and the animal eats lots of that food to grow itself, then the carbon footprint becomes multiplied by how much food it eats![5] Some animals can actually eat so much that their feed conversion is as much as 10x! Certain industrialized production methods for meat production can have insanely huge life cycle assessment carbon footprints for this reason, as much as ten times higher than vegetable carbon footprints. That’s why you see so many campaigns to reduce meat consumption in the media these days. Keep in mind though, these are also life cycle assessments. The meat itself is carbon neutral or close to it, it's the fossil fuels used in production mainly to blame for the multiplied effect.
“The number one public enemy is the cow. But the number one tool that can save mankind is the cow. We need every cow we can get back out on the range. It is almost criminal to have them in feedlots which are inhumane, antisocial, and environmentally and economically unsound.” Allan Savory
But here is the nuance. If what we fed those animals had a negative life cycle assessment of carbon footprint for the feed we gave it, then we would be multiplying that number by as much as 10x too! So in theory we could produce animal foods with as much as ten times better NEGATIVE carbon footprints as vegetable foods! And by the way, people are doing that right now in fact. There actually are farmers raising both crops and animals with such improved NEGATIVE carbon footprints.
So you see? It's not the food, it's how that food is produced and distributed.
“Yes, agriculture done improperly can definitely be a problem, but agriculture done in a proper way is an important solution to environmental issues including climate change, water issues, and biodiversity.”-Rattan Lal
In that potential future case where all our future foods are produced, distributed and stored properly, then a vegetarian would not be helping end human caused climate change as much as a standard diet. But right now, that future does not exist. Right now being vegetarian does indeed help! However, changing the entire worlds dietary habits would seem to be much harder than just raising our food better to begin with! We had made that effort to produce the so called "green revolution" and that worked. We could do the exact same strategy again, this time emphasizing reducing carbon footprints in agriculture. It could work. And without the obvious dead end that simply forcing the world to become vegetarian has.
- It's albedo
coolmaster at 10:43 AM on 3 September, 2021Also in response to blaisct's comment #66 posted over on the Urban Heat Island discussion.
The albedo is relative ... and depends primarily on the wavelength of the light that hits the body. We should therefore always specify a wavelength range for Albedo. Otherwise, strictly speaking, the entire spectrum of the sun is decisive. This relativity to the albedo is particularly important for an element as widespread worldwide as H²O.
As water vapor, it absorbs (28W / m²) largely only in the long-wave range and lets most of the visible light pass through.
As liquid water on the surface, it absorbs long-wave and short-wave light very strongly, although as a cloud in the same aggregate state, finely distributed in the atmosphere, it again reflects a high proportion (-47W / m²) of the high-energy, short-wave radiation.
As solid ice or snow on the surface, it reflects short-wave radiation as well as clouds. On the other hand, in the long-wave range it behaves like a black body and a layer of ice over the open sea isolates the one below
warmer water and prevents it from emitting its heat radiation to the atmosphere and space which in turn relativizes the ice albedo effect.
So @bleisct is not that wrong if he ascribes the Earth's albedo a major influence on global temperatures. The atmosphere (and every single component - including CO² molecules) also has an albedo if the solar spectrum is viewed holistically across all wavelength ranges and light refraction and transmission are taken into account as factors. Higher levels of GHG lower earth`s albedo by absorbing ~20% of radiation energy.
@MA Rodger is right when he remarks that the cloud albedo ingeniously has the strongest albedo and the global albedo(change) is of very minor importance over urban areas.
With a global mean surface albedo of 13.5% and net shortwave clear-sky flux of 287 Wm−2 at the TOA this results in a global mean clear-sky surface and atmospheric shortwave absorption of 214 and 73 Wm−2, respectively. From the newly-established diagrams of the global energy balance under clear-sky and all-sky conditions, we quantify the cloud radiative effects(CRE) not only at the TOA, but also within the atmosphere and at the surface.

 cloud radiative effects (CRE)")
When assessing the earth`s albedo, it`s also helpfull to have a look to the different radiation balances from land and sea and the fact that the cloud albedo is very closely interlinked with latent heat flux of evaporation in the radiation balance.
Do not confuse the strongly cooling CRE (-19W / m²) with the warming cloud radiative feedback CRF of ~ + 0.42Wm-2 ° C-1, which is a missing +RF in the above graphic by @Bob Loblaw as is also the radiative forcing of the ice Albedo effect.
.


- It's albedo
Bob Loblaw at 02:35 AM on 15 August, 2021Also in response to blaisct's comment #66 posted over on the Urban Heat Island discussion.
Blaisct:
You continue to make poor choices in the numbers and calculations that you are doing. Going over your latest effort by number:
1. You continue to select an albedo for urban areas that is too low for anthropogenic surfaces, and you have failed to cite a reference for your value. In my comment # 64 on the Urban Heat Island discussion, I gave a reference to several artificial surface materials, all with albedo values that exceed the the value you have chosen. "Urban" areas are a mix of things like grass, roads, houses, etc. You would need to calculate how much of the surface is covered by each type, and work out an albedo for an "urban" area that way. If that is what you have done, you need to show your detailed calcuations on how you arrive at the 0.08 value.
2. There are no assumptions in the 0.31 albedo value for the earth as a whole. That is based on satellite measurements, and includes reflection from the surface, clouds, clear atmosphere, etc. Note that the only part of the surface reflection that reaches space is the part that makes it back out through the atmosphere and cloud cover. To calculate this in a model (which is what you are trying to do), you need to account for spatial variations (and daily/seasonal cycles) of solar input, surface albedo, cloud cover, and atmospheric conditions.
3 to 14. You continue to make unreasonable assumptions about the area that is undergoing a surface change, and how it relates to population. There is no reason to think that they are related through a simple proportion.
15 to 20. You continue to make errors in converting solar output (1367 W/m^2 measured perpendicular to the sun's rays) to an areal average over the surface of the earth. As MIchael Sweet points out, there is a factor of 4 involved, not a factor of 2. I also mentioned this in my earlier comment. If you do not understand why this is the case, then it is difficult to see how you can expect to do any useful calculations. You also need to consider seasonal variations in solar radiation distribution and seasonal albedo.
21. Converting radiative forcing to global temperature change involves looking at the top-of-atmosphere changes (what is seen from space), not surface changes alone. To properly incorporate surface changes into a calcuation, you need to use a much more complicated model of climate response to surface albedo changes.
22. You still get a wildy incorrect answer, due to bad data input and bad assumptions.
I have not bothered to follow the link to the Mark Healey document you mention. If that is the source you are getting your incorrect ideas from, then it is not worth bothering. The result you quote (that albedo changes can account for all the obsvered temperature rise) is completely inconsistent with the science.
Over at RealClimate, they have recent posted several articles on the just-released IPCC reports. One of those summarizes 6 key results. In that post, they provide the following graph from the IPCC report, which shows the estimated temperature response due to a variety of factors over the last 100 to 150 years. "Land use reflection and irrigation" is the second-last bar on the right. Note that the calculated effect is minor cooling, not warming.

Michael Sweet's suggestion to read the IPCC reports is a good one. I often suggest that people start with the first 1990 report, as this covers a lot of the basic climate science principles in a manner that is easier to understand for the non-expert. In the 1990 report, they mention the Sagan et al paper I linked to in my first comment. Google Scholar can probably help you fnd a free copy.
https://science.sciencemag.org/content/206/4425/1363.abstract
- Clouds provide negative feedback
MA Rodger at 01:46 AM on 23 June, 2021sunnyx @258,
The level of CO2 in the atmosphere during the early Earth is usually assumed to be very high because the sun was a lot weaker (it has been brightening by something like 5% every billion years) and we know from rocks that there was liquid water so the Earth could not have been very cold. For the period back to 500My the CO2 level can be assessed from proxy data and also modelled. This shows CO2 was a lot higher than today for most of the last 500My. The impact on the climate is a matter of how many doublings of CO2. So three or four doublings would suggest a climate something like 10ºC-13ºC warmer. But the loss of 2½% of solar heating with the weaker sun back 500My would equal perhaps two of those CO2 doublings. So much of the climate forcing of the additional CO2 was negated by there being a cooler sun.
Changes in climate result from the feedbacks as well as the CO2/solar forcing and will not have chaned greatly. But the net feedback would have to be large to have caused a runaway warming. Imagine ECS=3ºC. That is the net feedback (the sum of positive and negative) result in trebling the temperature increase initially caused by the CO2. But that is all you get - a trebling. It would take a stonger net feedback to become runaway (actually 50% stronger).
(The ECS=3ºC is a compound result in that the warming of the feedback itself induces feedbacks. The trebling of ECS=3ºC is equivalent to a simple feedback of 0.67. As Philippe Chantreau @259 says, the magic number to achieve runaway is 1.0, an increase on 0.67 of 50%.)
I hope that makes sense for you.
- The New Climate War by Michael E. Mann - our reviews
nigelj at 08:31 AM on 11 June, 2021Nick Palmer @23
I didn't say Exon had clear and certain knowledge of the dangers of climate change way back then. I think the oil companies knew there was a problem, but not the full extent, like anyone else at the time. Remember I said this "Exon knew there was a climate problem but told the public a different story. Theres no way of excusing this. Even if Exonn didnt really understand the true extent of the problem it doesn't change the utterly mixed messaging."
While you're right that companies use lobbying organisations to fend off government regulation, its very hard to believe that big oil funded these lobby groups but didnt realise they were promoting denialism, or didn't fund them to assist in promoting denialism . The most I would concede is that not all fossil fuel companies would be the same.
Yes many of the very active environmentalists lean very left politically and want to smash capitalism. Michael Moore's film Planet of the Humans perhaps falls into that category. It was a very frustrating film full of inaccurate information and anti renewables rhetroic. I fall into the camp that thinks capitalism needs some reforms, but I don't think anyone has come up with a completely new alternative thats workable or ever will. I find the far left almost as annoying as the far right. But environmental activists will do what they do and believe what they beleive just as libertarians do the same.
However its not tenable to claim these far left environmentalist somehow triggered right wing climate denialism. If you look at the history of denialism of science in general its driven by a variety of things from vested interests, political views, religion, human psychology and some of these are politically neutral things. The far left environmentalists might have added a bit to the polarisation of the climate issue. But so have the far right denialists! Hugely so.
Of course big oil won't have its own internal documents talking about denialist myths like solar forcing and cosmic rays. They are not stupid. They outsource this to the lobby groups. But like I said in my previous comment, demonising the oil industry on and on seems ultimately a bit pointless.
Ok maybe I was too dismissive of Stephen Schneider. However the point I'm trying to make is the number of climate scientists that come across as serious, over the top alarmists is in a minority. In my admittedly anecdotal experience most seem pretty measured in their comments. The IPCC reports are very measured. So its unfair to accuse the scientific community of over stating the nature of this climate problem. One or two scientists go crazy, claiming climate change will kill billions of people in a decade, etc,etc. I find this rather frustrating because it feeds the denialists, but they are in a small minority.
- Greens: Divided on ‘clean’ energy? Or closer than they appear?
michael sweet at 00:15 AM on 22 May, 2021I mostly agree with Nigelj:
Nuclear and CCS are both uneconomic and will not be built. We are discussing goals set for 2035. Both CCS and nuclear take 10 or more years to build and no-one is planning any new builds. I think nuclear is best left unsubsidized and the plants can shut down as they start to lose money. Maybe someone in 10 years will come up with an economic CCS plan that helps the climate crisis. I doubt it.
Biofuels are a little more complex. My cousin works in an electrical facility that burns trash and biowaste from yards/ They have a good scrubber. That seems OK to me. The wholesale felling of forests to ship pellets to coal plants in England is unsustainable. I think it would be best to pass this legislation and then come back later to deal with biofuels.
The most important thing is to encourage the building of wind and solar plants as rapidly as possible. Then encourage electric cars. You cannot just shut down all the coal plants tomorrow, you must have generation in place to replace them. As more renewable energy is built the uneconomic fossil plants will shut down.
Texas is building a lot of wind and solar this year. No government mandate. It will be inteesting to see how that works out. It is not Greenies who are building those plants. I saw an article about South Australia that also suggested that renewables are forcing out fossil fuels. There is not a government mandate, just people installing solar on homes and utilities building renewable farms.
- Is Nuclear Energy the Answer?
John ONeill at 23:39 PM on 16 April, 2021'In a renewable energy world baseload power is very low value. Peak power on windless nights is most valuable. Current baseload plants are dinosaurs.' At least three nuclear designs going through certification - the Bill Gates/Terrapower sodium cooled reactor, the Canadian Terrestrial Energy molten salt graphite design ( based on the Oak Ridge Molten Salt Reactor Experiment ), and Moltex (an innovative fast reactor using plutonium chloride salt in fuel tubes similar to those of current reactors) - propose directly heating nitrate salts, as used in concentrating solar power plants. This would enable the reactor part to make heat 24/7, at ~ 500 megawatts, but store it to make power on demand at 1000 or 1500 MW, with only an additional turbine or two. This would integrate well with wind, which usually manages a 30-40% capacity factor. This would be much better than the current scenario, where part time wind, backed by natural gas, is undercutting baseload nuclear. Overall emissions rose after the closure of Vermont Yankee and San Onofre. They will certainly go up again when Indian Point, near New York, closes. Andrew Cuomo, governor of NY state, admitted that the closure of upstate reactors would lead to more gas being burnt, but would not relent on forcing the Indian Point reactors, which provided about a third of the city's power, to shut. They had been in the process of getting a twenty year licence extension, and could probably have had a further twenty years, as have several similar power plants.
https://www.electricitymap.org/zone/US-NE-ISNE?wind=false&solar=false
- It's planetary movements
Daniel Bailey at 02:45 AM on 30 March, 2021
"there is no effect on our climate"
Likeitwarm, while the Sun can influence the Earth’s climate it isn’t responsible for the warming trend we’ve seen over the past few decades. The Sun is a giver of life; it helps keep the planet warm enough for us to survive. We know subtle changes in the Earth’s orbit around the Sun are responsible for the comings and goings of the ice ages. But the warming we’ve seen over the last few decades is too rapid to be linked to changes in Earth’s orbit, and too large to be caused by solar activity.
One of the “smoking guns” that tells us the Sun is not causing the recent warming of Earth’s surface and ocean comes from looking at the amount of the Sun’s energy that hits the top of the atmosphere. Since 1978, scientists have been tracking this using sensors on satellites and what they tell us is that there has been no upward or downward overall trend in the amount of the Sun’s energy reaching Earth.
A second smoking gun is that if the Sun were responsible for global warming, we would expect to see warming throughout all layers of the atmosphere, from the surface all the way up to the upper atmosphere (stratosphere). But what we actually see is warming at the surface and cooling in the stratosphere. This is consistent with the warming being caused by a build-up of heat-trapping gases near the surface of the Earth, and not by the Sun getting “hotter.”
Scientists have quantified the warming caused by human activities since preindustrial times and compared that to natural temperature forcings.
Changes in the sun's output falling on the Earth from 1750-2011 are about 0.05 Watts/meter squared.
By comparison, human activities from 1750-2011 warm the Earth by about 2.83 Watts/meter squared (AR5, WG1, Chapter 8, section 8.3.2, p. 676).
What this means is that the warming driven by the GHGs coming from the human burning of fossil fuels since 1750 is over 50 times greater than the slight extra warming coming from the Sun itself over that same time interval.

https://science2017.globalchange.gov/chapter/2/#fig-2-3
The reality is, over the past 6 decades of significant global warming, the net energy forcing the Earth receives from the Sun had been very slightly negative. As in, the Earth should be cooling, not warming, if it was the Sun driving the observed warming of the past 6 decades. Does this mean the Sun is dimming? No. Over the centuries, the Sun’s output waxes and wanes between more active periods of time, like during the 1950s and 1960s, and periods when it is very quiet for decades like in the1600s (called a Grand Solar Minimum). However, the difference between the more active periods and the quieter periods isn’t very great and is not by itself long enough or great enough to propel Earth’s climate into either a runaway heating (like happened on Venus) or into an “snowball Earth”. Overall, the Sun has increased its output by roughly 10% per billion years of its life.
https://climate.nasa.gov/faq/14/is-the-sun-causing-global-warming/
https://www.climate.gov/news-features/understanding-climate/climate-change-incoming-sunlight
"brightening of the Sun is unlikely to have had a significant influence on global warming since the seventeenth century"
https://www.nature.com/articles/nature05072
What this means, in plain English: the warming caused by the greenhouse gas emissions from the human burning of fossil fuels is 6 times greater than the possible decades-long cooling from a prolonged Grand Solar Minimum.
Even if a Grand Solar Minimum were to last for a century, global temperatures would still continue to warm. Because the Sun is not the only factor affecting global temperatures on Earth.
https://agupubs.onlinelibrary.wiley.com/doi/full/10.1029/2010GL042710
https://agupubs.onlinelibrary.wiley.com/cms/asset/6dbf95a2-e322-4c92-838a-faf4dd77fa93/grl26938-fig-0002.png
https://agupubs.onlinelibrary.wiley.com/doi/10.1029/2011JD017013
https://agupubs.onlinelibrary.wiley.com/cms/asset/50198c16-0139-4e49-a7f2-e3e66e3af759/jgrd17754-fig-0006.png
https://agupubs.onlinelibrary.wiley.com/doi/full/10.1002/grl.50361
https://agupubs.onlinelibrary.wiley.com/cms/asset/a4f99608-109a-410d-99e6-d1c80799bccc/grl50361-fig-0002-m.jpg
https://agupubs.onlinelibrary.wiley.com/doi/full/10.1002/grl.50806
https://agupubs.onlinelibrary.wiley.com/doi/full/10.1002/2014JD022022
https://www.nature.com/articles/ncomms8535
https://www.nature.com/articles/nature21364
https://www.swsc-journal.org/articles/swsc/abs/2017/01/swsc170014/swsc170014.html
https://academic.oup.com/astrogeo/article-abstract/58/2/2.17/3074082
https://iopscience.iop.org/article/10.3847/2041-8213/aaa124/meta
https://www.atmos-chem-phys.net/18/3469/2018/
https://www.sciencedirect.com/science/article/pii/S0277379118307261
https://www.nature.com/articles/s41561-019-0402-y
https://journals.ametsoc.org/doi/abs/10.1175/JCLI-D-19-0059.1
https://climate.nasa.gov/blog/2953/there-is-no-impending-mini-ice-age/
https://www.nasa.gov/press-release/solar-cycle-25-is-here-nasa-noaa-scientists-explain-what-that-means
The human forcing is now the dominant forcing of climate, dwarfing all natural forcings combined. Even that from the Sun.
- Gillett et al. (2021) global warming attribution study
Bob Loblaw at 07:00 AM on 19 February, 2021jamesh@5:
You are not expressing yourself sufficeintly clearly. For example, you first say
"Dr. Mann in his publication dated 01 April 19 Titled Global-scale temperature patterns and climate forcing"
[emphasis mine], and then you say:
"the atmosphere could not have forced the sequesteration of carbon in the earths sedimentary rocks."
The two uses of the term "force" have entirely different meanings in these contexts.
Mann's statement - and any statement that has to do with CO2 forcing climate changes - is due to the radiative properties of greenhouse gases. They absorb and emit IR radaition, which alters the flows of energy, and do this in such a fashion that the global balance between absorbed solar radiation and emitted IR (to space) is affected. As a result, the earth warms in response to increased atmospheric CO2.
In your second use of the term forced, you seem to be talking about changes in the global carbon cycle. How the carbon cycle responds to the burning of fossil fuels is a different question from how increased atmospheric CO2 alters the radiation transfer.
To claim that CO2 cannot force climate because the atmosphere cannot force geological carbon sequestration is a non sequitur.
There are threads her that discuss the carbon cycle and how we know that the burning of fossil fuels is leading to increased atmospheric CO2. There are other threads where the role of CO2 as a greenhouse gas is discussed, including how the greenhouse gases lead to a warmer surface.
Such confusion in what you write needs to be clarified. We can only know your thoughts by how you express them. If your writing is confusing, we have no way of knowing if you are just expressing yourself poorly, or whether you are failing to understand some aspect of the science. Right now, it looks like there is a lot you do not understand.
- 2021 SkS Weekly Climate Change & Global Warming Digest #1
MA Rodger at 01:37 AM on 13 January, 2021Dr. S. Jeevananda Reddy @16,
♥ Indeed, your book Reddy, S.J., (2008) 'Climate Change: Myths & Realities' is mostly available to read on a Google Books preview up to page 87 but pages 88-193 "are not shown in this preview".
♥ And nobody would mistake the critique within the 'blog' by William Connolley as your work.
♥ As for your assertion that my use of the adjective "erroneous" is not backed up by science, that is yet more "erroneous" input from you.
I haven't read past your comment @6 but that yields conclusive findings for me.
Your suggestions that solar or wind power are contributing to global warming is plain silly. A wind farm mixes air, and actually extracts energy locally to be transported for use elewhere. Temperature increases are simply the result of mixing of air, not the generating of warming.
A solar farm will decrease albedo but the additional solar energy absorbed is comparable to the waste heat from a fossil-fuelled or nuclear powerplant. And this is without the CO2 from a fossil-fuelled powerpalnt which will add to AGW.
Any positive climate forcing raises global temperature and this in turn will be amplified by feedbacks, particularly through the resulting higher specific humidity.
Thus you write condescendingly @6: "increased CO2 raises temperature slightly and that produces an increase in water vapour, which does have the capability of raising atmospheric temperature" but with the added comment "However, it is not the case." So how is it that a climate forcing from increased CO2 (at 3.7wm^-2 per doubling) does not increase global temperature and thus initiate further warming from feedbacks? What scientific principle could you invoke to argue such a thing? - Milankovitch Cycles
scaddenp at 13:28 PM on 5 August, 2020Hmm I think Hansen & Sato calculated this and reported in AR4. More like 4% for global solar change, 21% for albedo change and remainder from GHG (CO2 + CH4). However, locally (65N) the milankovich forcing is very high, enough to determine whether snow melts out in summer or not and so trigger the large scale albedo changes.
- We're heading into an ice age
Lawrence Tenkman at 03:11 AM on 22 April, 2020Ralph Ellis suggests that the warming that ends glaciation is not from CO2 greenhouse effect, but instead dust storms cancelling albedo on northern ice sheets. He proposes that the inertia of natural cycles is towards glaciation: cold orbit forcings eventually start ice sheet formation, which adds albedo, which adds cold & more ice sheets, etc. When it gets cold enough, oceans draw in CO2, and at a critical point (low enough temp & low enough CO2) rapid plant death ensures at certain elevations. This allows for erosion / dust storms, which land on ice sheets to cancel their albedo. Although the dust effect he speaks of would not have as widespread effect throughout the world, it would have a local strong effect on the ice to break the feedback process. Because the critical cold temperature may take several Milankovitch cycles to reach, his theory may explain why not all Milankovitch spike result in glaciation escape. I’m curious what experts think about his theory. (I am not an expert.) To me it seems to make sense and seems like a very disciplined paper. Maybe he uncovered the a key strong variable for escape of glaciation.
In light of his dust-albedo cancellation being a strong effect, Ellis then concludes that CO2 is too weak to threaten overheating us or runaway greenhouse effect, and we shouldn’t worry about it… afterall CO2 of 280 ppm had too weak an effect (about 3.7 W/m2?) to prevent entry into glaciation. Ellis suggested that its almost like we were put here to burn fossil fuels to prevent an ice age.
I hesitate to follow him to all of his conclusions though. For one, why the two must be mutually exclusive? If his strong local “trigger” indeed matters more for glaciation exit, why must CO2, which is cumulative, lasting, global, & rapidly rising not matter at a high enough level in our situation? I’m most concerned that temp is quickly rising despite cooling forces from solar & orbital cycles… and we’ve only begun to make CO2 at a very rapid rate.
In terms of “preventing an ice age”. Many above suggest we’ve already prevented or much delayed it. Also, many above suggest, CO2 is like a gas pedal that recoils slowly once pressed. Future generations could always press the pedal further if determined necessary for ice age avoidance thousands of years in the future. But if we determine that we’ve pressed it too far, and are now in danger… too late. Can’t draw CO2 down rapidly.
I’m no expert though… so I’d much appreciate an expert’s reflection on the significance of Ellis’s paper.
http://science.uwaterloo.ca/~mpalmer/stuff/ellis.pdf
- Milankovitch Cycles
MA Rodger at 03:33 AM on 31 March, 2020mkrichew @32elsewhere,
The inclination of our slightly-less-than-round Earth doesn't appear to impact the area subject to insolation by very much. The Earth's dimensions are given as a polar minimum radius of about 6,357 km and an equatorial maximum radius of about 6,378 km. If we were to consider the Earth as an elipsoid with these dimensions, its area facing-the-sun with a pole pointing at the sun would be just 0.3% greater than with the tropics-facing-the-sun but that would be assuming the axis is tilting through 90º relative to the sun and staying there throughout the year. Yet the actual change in tilt is nothing like 90º and is only fully acting at the solstices.
The tilt varies between 22º & 24½º through its 40,000 year cycle, so just a 2½º variation, and that inclination is achieved relative to the sun only at the solstices, twice a year. So the increase in Earthly area facing the sun would vary by perhaps (0.3% x 3% x 70% =) 0.006% or a forcing of very roughly 0.015Wm^-2. That's only about 4-months-worth of AGW so not exactly significant. And bear in mind the bigger winter/summer temperature range at the two poles resulting from any increase in tilt. That would firstly see more energy leaking away into space (as the energy loss to space is T^4 so a constant temperature is more energy-efficient than hot-summer:cold-winter) and secondly the albedo change from the greater area of winter snow will reduce solar warming. These two cooling effects should well-exceed the warming from the greater earthly area catching the sun from there being a greater axial tilt.
(Note also the calculated effect of orbital eccentricity in the link @54 is 0.167%, some 30x greater. Even with this larger increase in insolation leads John Baez to the conclusion "if changes in eccentricity are important in glacial cycles, we have some explaining to do.")
- Multi-agency report highlights increasing signs and impacts of climate change in atmosphere, land and oceans
MA Rodger at 00:30 AM on 16 March, 2020As a way of disentangling ENSO etc from the temperature record, Foster & Rahmstorf (2011) used Multiple Linear Regreession to factor out ENSO as well as volcanic forcings and solar variation for the period 1979-2010. Foster (aka Tamino) repeated the exercise last October for the period 1950-2018 and the graph of the adjusted annual temperature series for the various surface records is presented below:-
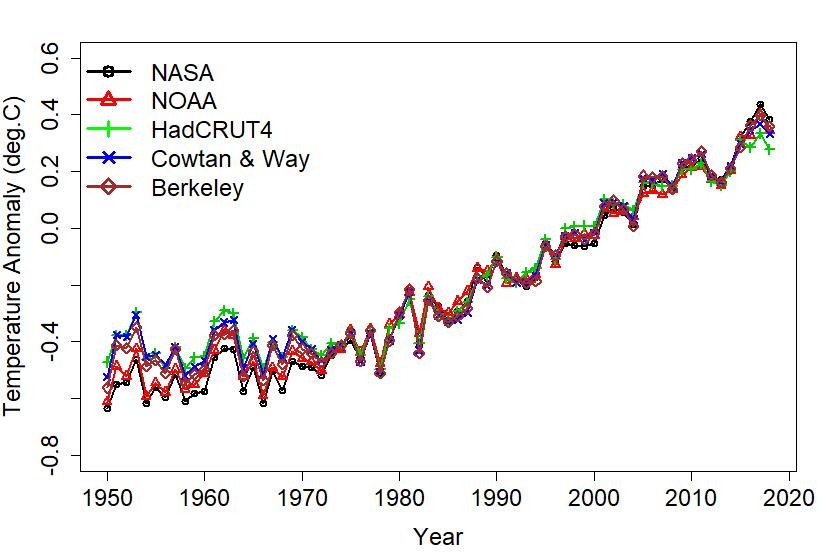
- Australia's wildfires: Is this the 'new normal'?
Mark Thomas at 09:26 AM on 20 February, 2020Nigelj@19, I was thinking along very similar lines. Comparing temperatrure trend over time against deforrestation rates and global warming trend, humidity and rainfall.
Forest Hydrogeology and impacts of deforestation evidence points to big contributions to climatic change, at much more than a localised climate. Articles I have refered so far in this thread have many references within (I can if people want a list). I mean now that I think about this it comes across as common sense. When you visualise Australia, and compare pre-european invasion land cover to the current land cover ... I can see it would drive up temperature, increase arid conditions and reduce moisture. I will further support this idea with references below.
The comparison of an area deforested to forested and moisture and temperature impacts is presented in my first comment (Mark Thomas @3) which shows a regional area in Western Australia before and after measurements. Shows dramatic impact.
Regarding Australia wide...
Available for free online (woohoo!! how all science should be) at AGU100 this paper presents modelling comparions on climate in Australia pre-european and modern day conditions.
'Modeling the impact of historical land cover change on Australia's regional climate' 2007 by C. A. McAlpine J. Syktus R. C. Deo P. J. Lawrence H. A. McGowan I. G. Watterson S. R. Phinn
The report discusses in detail the modelled variability in temperature and moisture. (I am going to try to link in some figures ... this is my first time writing on a science discussion site, )
The report investigation aim (Introduction) "...The question then is ‐ is Australia's regional climate sensitive to land cover change?....."
..."However, the effect of LCC [Land Cover Change] on the Australian climate has been a secondary consideration for climate change projections, despite the clearing of over 1.2 million km2 or ∼13% of the continent since European settlement.
The regions of greatest LCC are southeast Australia (New South Wales, Victoria and South Australia, cleared 1800‐mid 1900s), southwest Western Australia (1920–1980s), and more recently inland Queensland [Australian Surveying and Land Information Group (AUSLIG), 1990; Barson et al., 2000]. Nair et al. [2007], using satellite observational data, showed that replacement of half the native vegetation by croplands in southwest Western Australia resulted in a decrease of 7 Wm−2 in radiative forcing. They argue that general circulation models tend to underestimate the radiative forcing of LCC by a factor of two."
in section 3.2 discusses pre european and current forest modelling temperature trends 2002/2003 drought.

"[18] The simulated warmer and drier conditions in eastern Australia are cumulatively impacting on surface and sub‐soil moisture, and likely to be affecting vertical moisture transport processes, changing the partitioning of available water between runoff and evaporation. This has important, largely unrecognized consequences for agricultural production and already stressed land and water resources. Further, the simulated increase in temperatures in the sensitivity experiments, especially in southern Queensland and New South Wales, for the 2002/2003 drought, is consistent with the observed trend of recent droughts being warmer than previous droughts (1982, 1994) with a similar low rainfall [Nicholls, 2006]."
The report concludes
..."[19] The findings of our sensitivity experiment indicate that replacing the native woody vegetation with crops and grazing in southwest Western Australia and eastern Australia has resulted in significant changes in regional climate, with a shift to warmer and drier conditions, especially in southeast Australia, the nation's major agricultural region. The simulated changes in Australia's regional climate suggest that LCC [Land Cover Change] is likely a contributing factor to the observed trends in surface temperature and rainfall at the regional scale. While formal attribution studies are required, the outcomes raise important questions about the impact of LCC on Australia's regional climate, and highlight a strong feedback effect between LCC and the severity of recent droughts impacting on Australia's already stressed natural resources and agriculture."
Now at a global research level for Land Cover Change .....
Research paper in Science Direct, presented in the Global Environmental Change Journal, Volume 43, March 2017, Pages 51-61
Trees, forests and water: Cool insights for a hot world
".....As illustrated in Fig. 2, solar energy that might otherwise drive transpiration and evaporation remains in the local landscape as heat, raising local temperatures. This can result in dramatic changes across different land-use environments. Heatwave conditions can amplify these effects. Warmer temperatures appear to result in greater temperature differentials between forested and open-field environments, though broad-leaved species may have stronger impacts on cooling than conifers (Renaud and Rebetez, 2009, Zaitchik et al., 2006). Maintaining tree cover can reduce high temperatures and buffer some of the extremes otherwise likely to arise with climate change."

Fig. 2. Surface temperature distribution in a mixed landscape with forest.
For me, I am seeing that ecology needs to play an equal part of the conversation regarding climate change mitigation as much as CO2. The more I read about land cover changes and their impacts the more I see it needs to be a bigger part. They are not seperable. I note the following conclusion from the above reference 'Trees, forests and water: Cool insights for a hot world'.
... in section 9 "Though the 2015 UNFCCC Paris Agreement has again turned attention to the carbon-related role of forests, the agreement likewise emphasizes that mitigation and adaptation agendas are to be handled in synergy. Much can still be done to improve implementation.
The effects of forests on water and climate at local, regional and continental scales provide a powerful adaptation tool that, if wielded successfully, also has globally-relevant climate change mitigation potential....."
Thankyou Nigelj for encouragement to do comparison trends of climate and land based conditions and potential impacts, I see how important this is to turning the tide of climate change and anthropogenic damage, I have a new project it seems :)
- Earth is heating at a rate equivalent to five atomic bombs per second
MA Rodger at 21:44 PM on 16 February, 2020rip71749,
Regarding the energy from burning fossil fuels, there is an SkS graphic illustrating the relative size of the various global energy inputs.I feel that 3.7Wm^-2 figure requires some further explaining. It is the value of Climate Forcing, the global energy imbalance, that would result from a doubling of CO2 which, without feedbacks, would result in a global temperature increase of +1ºC. These values are explained by the solar warming (less albedo) being globally 240Wm^-2 which thus gives an effective planetary temperature of (240/5.67e-8)^0.25 = 255K. Add 3.7Wm^-2 and it becomes 256K. These values, of course, apply high up in the atmosphere but the temperature increase from any forcing also applies to the surface temperatures as the lapse rate acts in a linear fashion down through the atmosphere.
Additional to the initial forcing, there are feedbacks which increase the warming. They act as the global temperature rises, this temperature rise meaning the initial climate forcing is being equalised. Thus the feedbacks do not appear as an increased energy imbalance but instead extend the temperature effect of the climate forcing as it equalises with rising temperature.
Now, at any particular time during AGW (where the Climate Forcing is applied slowly over a period and not all at once) the energy imbalance which is warming the globe (and so theoretically available to melt Greenland ice) will be far smaller than the accumulative Climate Forcing since pre-industrial times. Much of this Climate Forcing (and as negative forcings are poorly defined, the value of net Forcing since pre-industrial is imprecisely known but it is usually quoted as very roughly 2Wm^-2) will have been balanced by the global temperature increase since pre-industrial. It is solely the remaining energy imbalance that is available for melting ice caps, this running presently at something like 1Wm^-2.
From the imbalance, there is then perhaps something like 16ZJ/year entering the climate which, if it could be brought to bear on Greenland's ice, would melt Greenland in something like 50 years. Of course, getting all that energy imbalance to Greenland would be impossible but if the ice were to set off across the oceans, it does become possible. Indeed, having melting icebergs bobbing about at lower latitudes would lower the global temperature and this will increase the global energy imbalance. (This is the mechanism behind the hypothesis set out in Hansen et al 2016.)
Hope all that makes sense. - CO2 lags temperature
Philippe Chantreau at 03:44 AM on 3 February, 2020I believe that I had read Map's initial comment correctly and that he is indeed referring to what some call the Mid-Pleistocene transition. This is an area of active research and, although his posts are poorly formulated, I do not see that map deserves scorn for enquiring about it.
The recent regime of 100,000 years interglacial was preceded in the paleo record by a longer period where the 41,000 years cycle dominated. Wikipedia has a good explanation and plenty of links to scientific literature, including some recent ones.
Citing the wiki page:
"There is strong evidence that the Milankovitch cycles affect the occurrence of glacial and interglacial periods within an ice age. The present ice age is the most studied and best understood, particularly the last 400,000 years, since this is the period covered by ice cores that record atmospheric composition and proxies for temperature and ice volume. Within this period, the match of glacial/interglacial frequencies to the Milanković orbital forcing periods is so close that orbital forcing is generally accepted (emphasis mine). The combined effects of the changing distance to the Sun, the precession of the Earth's axis, and the changing tilt of the Earth's axis redistribute the sunlight received by the Earth. Of particular importance are changes in the tilt of the Earth's axis, which affect the intensity of seasons. For example, the amount of solar influx in July at 65 degrees north latitude varies by as much as 22% (from 450 W/m² to 550 W/m²). It is widely believed that ice sheets advance when summers become too cool to melt all of the accumulated snowfall from the previous winter. Some believe that the strength of the orbital forcing is too small to trigger glaciations, but feedback mechanisms like CO2 may explain this mismatch."
Further down: "During the period 3.0–0.8 million years ago, the dominant pattern of glaciation corresponded to the 41,000-year period of changes in Earth's obliquity (tilt of the axis). The reasons for dominance of one frequency versus another are poorly understood and an active area of current research, but the answer probably relates to some form of resonance in the Earth's climate system. Recent work suggests that the 100K year cycle dominates due to increased southern-pole sea-ice increasing total solar reflectivity."
Worth noting:
https://agupubs.onlinelibrary.wiley.com/doi/full/10.1002/2016GL071307
There are plenty of other interesting references in the Wiki.
Map,
To have a productive exchange here, you can not be vague with statements like "I have read somewhere" and such. These are used all the times by people who argue in bad faith and trigger the corresponding response from other posters, for which you can not blame those who respond. Scientific references are a must. Specific inquiries and precise questions are helpful.
It should be noted that the regime in the paleo record has now been completely replaced and that we are in entirely new conditions because of the massive injection of CO2 in the atmosphere from the past 100 years.
- COP25: Key outcomes agreed at the UN climate talks in Madrid
John Hartz at 01:13 AM on 19 December, 2019From SkS's handy-dandy Climate Glossary:
Greenhouse Effect
Greenhouse gases effectively absorb thermal infrared radiation, emitted by the Earth’s surface, by the atmosphere itself due to the same gases, and by clouds. Atmospheric radiation is emitted to all sides, including downward to the Earth’s surface. Thus, greenhouse gases trap heat within the surface-troposphere system. This is called the greenhouse effect. Thermal infrared radiation in the troposphere is strongly coupled to the temperature of the atmosphere at the altitude at which it is emitted. In the troposphere, the temperature generally decreases with height. Effectively, infrared radiation emitted to space originates from an altitude with a temperature of, on average, –19°C, in balance with the net incoming solar radiation, whereas the Earth’s surface is kept at a much higher temperature of, on average, +14°C. An increase in the concentration of greenhouse gases leads to an increased infrared opacity of the atmosphere, and therefore to an effective radiation into space from a higher altitude at a lower temperature. This causes a radiative forcing that leads to an enhancement of the greenhouse effect, the so-called enhanced greenhouse effect.
Definition courtesy of IPCC AR4.
- It's cosmic rays
Daniel Bailey at 06:22 AM on 4 December, 2019jmh530, the best available evidence we have is that there is no direct linkage between the sun’s output and cosmic rays impacting the Earth’s climate. Now that’s a broad statement, but let’s examine some more in-depth evidence on those individual components.
Scientists use a metric called Total Solar Irradiance (TSI) to measure the changes in output of the energy the Earth receives from the Sun. And TSI, as one would expect given the meaning behind its acronym, incorporates the 11-year solar cycle AND solar flares/storms.
The reality is, over the past 4 decades of significant global warming, the net energy forcing the Earth receives from the Sun had been negative. As in, the Earth should be cooling, not warming, if it was the Sun.
The scientists at CERN designed an experiment called CLOUD to evaluate the potential impacts of cosmic rays on clouds and cloud nucleation (Cloud Condensing Nuclei = CCN).
Per CLOUD director Kirkby:
"At the present time we can not say whether cosmic rays affect the climate."
Looking at the results of CLOUD, if cosmic rays were a significant factor in affecting our climate, the Earth should have been cooling, not warming. Instead 8 of the warmest 10 years have all occurred in the most recent 10 years.
Erlykin et al 2013 - A review of the relevance of the ‘CLOUD’ results and other recent observations to the possible effect of cosmic rays on the terrestrial climate
“The problem of the contribution of cosmic rays to climate change is a continuing one and one of importance. In principle, at least, the recent results from the CLOUD project at CERN provide information about the role of ionizing particles in ’sensitizing’ atmospheric aerosols which might, later, give rise to cloud droplets. Our analysis shows that, although important in cloud physics the results do not lead to the conclusion that cosmic rays affect atmospheric clouds significantly, at least if H2SO4 is the dominant source of aerosols in the atmosphere. An analysis of the very recent studies of stratospheric aerosol changes following a giant solar energetic particles event shows a similar negligible effect. Recent measurements of the cosmic ray intensity show that a former decrease with time has been reversed. Thus, even if cosmic rays enhanced cloud production, there would be a small global cooling, not warming.”
Modern CCN are pretty much insensitive to cosmic rays and changes in TSI from the Sun, compared to the very much larger anthropgenic and natural contributions (volcanoes, oceanic oscillations and wildfires):
"New particle formation in the atmosphere is the process by which gas molecules collide and stick together to form atmospheric aerosol particles. Aerosols act as seeds for cloud droplets, so the concentration of aerosols in the atmosphere affects the properties of clouds. It is important to understand how aerosols affect clouds because they reflect a lot of incoming solar radiation away from Earth's surface, so changes in cloud properties can affect the climate.
Before the Industrial Revolution, aerosol concentrations were significantly lower than they are today. In this article, we show using global model simulations that new particle formation was a more important mechanism for aerosol production than it is now. We also study the importance of gases emitted by vegetation, and of atmospheric ions made by radon gas or cosmic rays, in preindustrial aerosol formation.
We find that the contribution of ions and vegetation to new particle formation was also greater in the preindustrial period than it is today.
However, the effect on particle formation of variations in ion concentration due to changes in the intensity of cosmic rays reaching Earth was small."
And
"...solar cycle variations of ion concentration lead to a maximum 1% variation of CCN0.2% concentrations. This is insignificant on an 11 year timescale compared with fluctuations due to, for example, the El Nino-Southern Oscillation, variations in wildfires, or volcanoes."
Gordon et al 2017 - Causes and importance of new particle formation in the present-day and preindustrial atmospheres
And the coup de grace for cosmic rays, being proven to unable to significantly affect clouds and climate, is that CCN respond too weakly to changes in Galactic Cosmic Rays to yield a significant influence on clouds and climate.
Pierce 2017 - Cosmic rays, aerosols, clouds, and climate: Recent findings from the CLOUD experiment
Scientist Richard Alley pretty much killed the cosmic ray hypothesis here (the relevant part of the lecture starts at 42:00)
"We had a big cosmic ray signal, and the climate ignores it. And it is just about that simple! These cosmic rays didn’t do enough that you can see it, so it’s a fine-tuning knob at best."
To recap, the Laschamp excursion (the strongest cosmic ray event in the past 40,000 years) hammered climate for 2,550 years about 40,000 years ago. The flux of beryllium-10 produced by cosmic rays greatly increased as the Earth’s magnetic field weakened by 90%.
Here is the chart he’s referring to, showing how the flux of beryllium-10 produced by cosmic rays greatly increased as the Earth’s magnetic field weakened by 90% about 40,000 years ago.

From the AR5, WG1, Chapter 7, p. 573:
"Cosmic rays enhance new particle formation in the free troposphere, but the effect on the concentration of cloud condensation nuclei is too weak to have any detectable climatic influence during a solar cycle or over the last century (medium evidence, high agreement). No robust association between changes in cosmic rays and cloudiness has been identified. In the event that such an association existed, a mechanism other than cosmic ray-induced nucleation of new aerosol particles would be needed to explain it. {7.4.6}"
- Sea level rise is exaggerated
Daniel Bailey at 09:28 AM on 1 December, 2019Not sure what your definition of "uniformly even" is. Did you expect them to be so?
Firstly, global sea level rise is a global average and the surface of the oceans are anything but level (the surface of the oceans follow the gravitic shape of the Earth and are also subject to solar, lunar, sloshing and siphoning effects and oceanic oscillations, etc, all of which need to be controlled for).
From the NCA4, global average sea level has risen by about 7–8 inches since 1900, with almost half (about 3 inches) of that rise occurring since 1993:

From NOAA STAR NESDIS:

"Only altimetry measurements between 66°S and 66°N have been processed. An inverted barometer has been applied to the time series. The estimates of sea level rise do not include glacial isostatic adjustment effects on the geoid, which are modeled to be +0.2 to +0.5 mm/year when globally averaged."
Regional SLR graphics are also available from NOAA STAR NESDIS, here.
This is a screenshot of NOAA's tide gauge map for the Western Pacific (NOAA color-codes the relative changes in sea levels to make it easier to internalize):

Clicking on the Funafuti, Tuvalu tide gauge station we see that sea levels are rising by 3.74 mm/yr (above the global average) there, with a time series starting around 1978 and ending about 2011:

However, the time series used by your BOM link for Funafuti (1993-2019) is shorter and the BOM also does not apply a linear trend line to it like NOAA does:

Feel free to make further comparisons, but comparing a set of graphics with no trend lines vs those with trend lines is no comparison at all.
From the recent IPCC Special Report 2019 - Ocean and Cryosphere in a Changing Climate - Summary for Policy Makers, September 25, 2019 release (SROCC 2019), the portions on sea level rise:Observed Physical Changes
A3. Global mean sea level (GMSL) is rising, with acceleration in recent decades due to increasing rates of ice loss from the Greenland and Antarctic ice sheets (very high confidence), as well as continued glacier mass loss and ocean thermal expansion. Increases in tropical cyclone winds and rainfall, and increases in extreme waves, combined with relative sea level rise, exacerbate extreme sea level events and coastal hazards (high confidence).A3.1 Total GMSL rise for 1902–2015 is 0.16 m (likely range 0.12–0.21 m). The rate of GMSL rise for 2006–2015 of 3.6 mm yr–1 (3.1–4.1 mm yr–1, very likely range), is unprecedented over the last century (high confidence), and about 2.5 times the rate for 1901–1990 of 1.4 mm yr–1 (0.8– 2.0 mm yr–1, very likely range). The sum of ice sheet and glacier contributions over the period 2006–2015 is the dominant source of sea level rise (1.8 mm yr–1, very likely range 1.7–1.9 mm yr–1), exceeding the effect of thermal expansion of ocean water (1.4 mm yr–1, very likely range 1.1–1.7 mm yr–1) (very high confidence). The dominant cause of global mean sea level rise since 1970 is anthropogenic forcing (high confidence).
A3.2 Sea-level rise has accelerated (extremely likely) due to the combined increased ice loss from the Greenland and Antarctic ice sheets (very high confidence). Mass loss from the Antarctic ice sheet over the period 2007–2016 tripled relative to 1997–2006. For Greenland, mass loss doubled over the same period (likely, medium confidence).
A3.3 Acceleration of ice flow and retreat in Antarctica, which has the potential to lead to sea-level rise of several metres within a few centuries, is observed in the Amundsen Sea Embayment of West Antarctica and in Wilkes Land, East Antarctica (very high confidence). These changes may be the onset of an irreversible (recovery time scale is hundreds to thousands of years) ice sheet instability. Uncertainty related to the onset of ice sheet instability arises from limited observations, inadequate model representation of ice sheet processes, and limited understanding of the complex interactions between the atmosphere, ocean and the ice sheet.
A3.4 Sea-level rise is not globally uniform and varies regionally. Regional differences, within ±30% of the global mean sea-level rise, result from land ice loss and variations in ocean warming and circulation. Differences from the global mean can be greater in areas of rapid vertical land movement including from local human activities (e.g. extraction of groundwater). (high confidence)
A3.5 Extreme wave heights, which contribute to extreme sea level events, coastal erosion and flooding, have increased in the Southern and North Atlantic Oceans by around 1.0 cm yr–1 and 0.8 cm yr–1 over the period 1985–2018 (medium confidence). Sea ice loss in the Arctic has also increased wave heights over the period 1992–2014 (medium confidence).
A3.6 Anthropogenic climate change has increased observed precipitation (medium confidence), winds (low confidence), and extreme sea level events (high confidence) associated with some tropical cyclones, which has increased intensity of multiple extreme events and associated cascading impacts (high confidence). Anthropogenic climate change may have contributed to a poleward migration of maximum tropical cyclone intensity in the western North Pacific in recent decades related to anthropogenically-forced tropical expansion (low confidence). There is emerging evidence for an increase in annual global proportion of Category 4 or 5 tropical cyclones in recent decades (low confidence).
B3. Sea level continues to rise at an increasing rate. Extreme sea level events that are historically rare (once per century in the recent past) are projected to occur frequently (at least once per year) at many locations by 2050 in all RCP scenarios, especially in tropical regions (high confidence). The increasing frequency of high water levels can have severe impacts in many locations depending on exposure (high confidence). Sea level rise is projected to continue beyond 2100 in all RCP scenarios. For a high emissions scenario (RCP8.5), projections of global sea level rise by 2100 are greater than in AR5 due to a larger contribution from the Antarctic Ice Sheet (medium confidence). In coming centuries under RCP8.5, sea level rise is projected to exceed rates of several centimetres per year resulting in multi-metre rise (medium confidence), while for RCP2.6 sea level rise is projected to be limited to around 1m in 2300 (low confidence). Extreme sea levels and coastal hazards will be exacerbated by projected increases in tropical cyclone intensity and precipitation (high confidence). Projected changes in waves and tides vary locally in whether they amplify or ameliorate these hazards (medium confidence).
B3.1 The global mean sea level (GMSL) rise under RCP2.6 is projected to be 0.39 m (0.26–0.53 m, likely range) for the period 2081–2100, and 0.43 m (0.29–0.59 m, likely range) in 2100 with respect to 1986–2005. For RCP8.5, the corresponding GMSL rise is 0.71 m (0.51–0.92 m, likely range) for 2081–2100 and 0.84 m (0.61–1.10 m, likely range) in 2100. Mean sea level rise projections are higher by 0.1 m compared to AR5 under RCP8.5 in 2100, and the likely range extends beyond 1 m in 2100 due to a larger projected ice loss from the Antarctic Ice Sheet (medium confidence). The uncertainty at the end of the century is mainly determined by the ice sheets, especially in Antarctica.
B3.2 Sea level projections show regional differences around GMSL. Processes not driven by recent climate change, such as local subsidence caused by natural processes and human activities, are important to relative sea level changes at the coast (high confidence). While the relative importance of climate-driven sea level rise is projected to increase over time, local processes need to be considered for projections and impacts of sea level (high confidence).
Projected Changes and Risks
B3.3 The rate of global mean sea level rise is projected to reach 15 mm yr–1 (10–20 mm yr–1, likely range) under RCP8.5 in 2100, and to exceed several centimetres per year in the 22nd century. Under RCP2.6, the rate is projected to reach 4 mm yr-1 (2–6 mm yr–1, likely range) in 2100. Model studies indicate multi-meter rise in sea level by 2300 (2.3–5.4 m for RCP8.5 and 0.6–1.07 m under RCP2.6) (low confidence), indicating the importance of reduced emissions for limiting sea level rise. Processes controlling the timing of future ice-shelf loss and the extent of ice sheet instabilities could increase Antarctica’s contribution to sea level rise to values substantially higher than the likely range on century and longer time-scales (low confidence). Considering the consequences of sea level rise that a collapse of parts of the Antarctic Ice Sheet entails, this high impact risk merits attention.B3.4 Global mean sea level rise will cause the frequency of extreme sea level events at most locations to increase. Local sea levels that historically occurred once per century (historical centennial events) are projected to occur at least annually at most locations by 2100 under all RCP scenarios (high confidence). Many low-lying megacities and small islands (including SIDS) are projected to experience historical centennial events at least annually by 2050 under RCP2.6, RCP4.5 and RCP8.5. The year when the historical centennial event becomes an annual event in the mid-latitudes occurs soonest in RCP8.5, next in RCP4.5 and latest in RCP2.6. The increasing frequency of high water levels can have severe impacts in many locations depending on the level of exposure (high confidence).
B3.5 Significant wave heights (the average height from trough to crest of the highest one-third of waves) are projected to increase across the Southern Ocean and tropical eastern Pacific (high confidence) and Baltic Sea (medium confidence) and decrease over the North Atlantic and Mediterranean Sea under RCP8.5 (high confidence). Coastal tidal amplitudes and patterns are projected to change due to sea level rise and coastal adaptation measures (very likely). Projected changes in waves arising from changes in weather patterns, and changes in tides due to sea level rise, can locally enhance or ameliorate coastal hazards (medium confidence).
B3.6 The average intensity of tropical cyclones, the proportion of Category 4 and 5 tropical cyclones and the associated average precipitation rates are projected to increase for a 2°C global temperature rise above any baseline period (medium confidence). Rising mean sea levels will contribute to higher extreme sea levels associated with tropical cyclones (very high confidence). Coastal hazards will be exacerbated by an increase in the average intensity, magnitude of storm surge and precipitation rates of tropical cyclones. There are greater increases projected under RCP8.5 than under RCP2.6 from around mid-century to 2100 (medium confidence). There is low confidence in changes in the future frequency of tropical cyclones at the global scale.
Challenges
C3. Coastal communities face challenging choices in crafting context-specific and integrated responses to sea level rise that balance costs, benefits and trade-offs of available options and that can be adjusted over time (high confidence). All types of options, including protection, accommodation, ecosystem-based adaptation, coastal advance and retreat, wherever possible, can play important roles in such integrated responses (high confidence).C3.1. The higher the sea levels rise, the more challenging is coastal protection, mainly due to economic, financial and social barriers rather than due to technical limits (high confidence). In the coming decades, reducing local drivers of exposure and vulnerability such as coastal urbanization and human-induced subsidence constitute effective responses (high confidence). Where space is limited, and the value of exposed assets is high (e.g., in cities), hard protection (e.g., dikes) is likely to be a cost-efficient response option during the 21st century taking into account the specifics of the context (high confidence), but resource-limited areas may not be able to afford such investments. Where space is available, ecosystem-based adaptation can reduce coastal risk and provide multiple other benefits such as carbon storage, improved water quality, biodiversity conservation and livelihood support (medium confidence).
C3.2 Some coastal accommodation measures, such as early warning systems and flood-proofing of buildings, are often both low cost and highly cost-efficient under current sea levels (high confidence). Under projected sea level rise and increase in coastal hazards some of these measures become less effective unless combined with other measures (high confidence). All types of options, including protection, accommodation, ecosystem-based adaptation, coastal advance and planned relocation, if alternative localities are available, can play important roles in such integrated responses (high confidence). Where the community affected is small, or in the aftermath of a disaster, reducing risk by coastal planned relocations is worth considering if safe alternative localities are available. Such planned relocation can be socially, culturally, financially and politically constrained (very high confidence).
C3.3 Responses to sea-level rise and associated risk reduction present society with profound governance challenges, resulting from the uncertainty about the magnitude and rate of future sea level rise, vexing trade-offs between societal goals (e.g., safety, conservation, economic development, intra- and inter-generational equity), limited resources, and conflicting interests and values among diverse stakeholders (high confidence). These challenges can be eased using locally appropriate combinations of decision analysis, land-use planning, public participation, diverse knowledge systems and conflict resolution approaches that are adjusted over time as circumstances change (high confidence).
C3.4 Despite the large uncertainties about the magnitude and rate of post 2050 sea level rise, many coastal decisions with time horizons of decades to over a century are being made now (e.g., critical infrastructure, coastal protection works, city planning) and can be improved by taking relative sea-level rise into account, favouring flexible responses (i.e., those that can be adapted over time) supported by monitoring systems for early warning signals, periodically adjusting decisions (i.e., adaptive decision making), using robust decision-making approaches, expert judgement, scenario-building, and multiple knowledge systems (high confidence). The sea level rise range that needs to be considered for planning and implementing coastal responses depends on the risk tolerance of stakeholders. Stakeholders with higher risk tolerance (e.g., those planning for investments that can be very easily adapted to unforeseen conditions) often prefer to use the likely range of projections, while stakeholders with a lower risk tolerance (e.g., those deciding on critical infrastructure) also consider global and local mean sea level above the upper end of the likely range (globally 1.1 m under RCP8.5 by 2100) and from methods characterised by lower confidence such as from expert elicitation.
To sum:
1. Global sea levels continue to rise, with the rise itself accelerating (due to an acceleration in land-based ice sheet mass losses). This will continue, for beyond the lifespans of any now alive.
2. Beware of the eyecrometer. It will deceive you, if you allow it to.

SLR Components, from Cazenave et al 2018
- It's a 1500 year cycle
Philippe Chantreau at 06:07 AM on 10 November, 2019Since this whole pile of nonsense relies on a very exact timing and Rahmstorf's interpretation in the paper above of a rigid cyclicity with a 1470 years period, let's consider the state of the science following the Rahmstorf (2003) paper.
The timing of D.O. events has been in fact the subject of considerable debate. Obrochta, Miyahara, Yokoyama & Crowley (2012) injected much doubt as to the true cyclic nature of the events and the duration of the period. They have some pretty strong language:
"Our new results suggest that the “1500-year cycle” may be a transient phenomenon whose origin could be due, for example, to ice sheet boundary conditions for the interval in which it is observed. We therefore question whether it is necessary to invoke such exotic explanations as heterodyne frequencies or combination tones to explain a phenomenon of such fleeting occurrence that is potentially an artifact of arithmetic averaging."In addition, solar cycles are pretty good candidates to figure as the initial forcings in the events: "Results from the most well-dated, younger interval suggest that the original 1500 ± 500 year cycle may actually be an admixture of the ∼1000 and ∼2000 cycles that are observed within the Holocene at multiple locations. In Holocene sections these variations are coherent with 14C and 10Be estimates of solar variability."
Another European team 5 years earlier came to even stronger conclusions about the timing and cyclicty of the events. P. D. Ditlevsen, K. K. Andersen, and A. Svensson (2007) state:
"Here we present statistical significance tests of this periodicity. The detection of a periodicity relies strongly on the accuracy of the dating of the DO events. Here we use both the new NGRIP GICC05 time scale based on multi-parameter annual layer counting and the GISP2 time scale where the periodicity is most pronounced. For the NGRIP dating the recurrence times are indistinguishable from a random occurrence." So, in other words, when dating is refined in the ice core, the periodicity evaporates.
It should be furthermore noted that D.O. events belong in a rather ancient past, as there has not been any since the last one observable in the GRIP/GISP cores, about 25,000 years ago.
The Holocene shows another cycle of Bond events, of much smaller magnitude, most of them without a clear climate signal. The periodicity of the Bond events is closer to 1,000 years. Perhaps Alan's creative gravity maths can take us from 1800 to 1500 to 1000. All this can be found through a quick search of D.O. events, Heinrich events and Bond events.
- CO2 was higher in the past
nyood at 05:28 AM on 5 November, 2019"(1) The total climate forcing from 6000ppm CO2 is very roughly 40Wm^-2. There is no evidence
to suggest that climate was impacted by such forcings (from any source) during the Ordovician."(1) The first sentence is axiomaticly using an estimated forcing of CO2 and therefore is a statement, though the consequences you state are true (none).
I state that CO2 forcing is max 1°C, reaching saturation with roughly PAL levels, pretty much always or already.The Second sentence is true, the forcings that Do determine climate Temperature (T) are the two equilibrium forces
hothouse effect (HHE) and high landmass ratio within polar circles (LPC).
The faint sun paradox (FSP) underlines the strength and dominance of the terrestial forcings by allowing
the orrdovician-silurian events, HHE - LPC - HHE, to happen within the same T amplitude of all compareable HHE and LPC events untill today.
Neglecting CO2 and reducing the FPS or -4% TPI, in its forcings.On top of that you devaluate some of your own arguments brought up in the coming sections. According to (1) you do not allow yourself any comparison from there on.
"(2) According to your cited reference (slides 11 & 14), the period with elevated CO2 significantly above 4000ppm
coincides with the Katian, a period of warming."(2)This sentence has no expressiveness. HHE is happening anyways before and after the LPC.
The Katian documents the late transition state towards an LPC, in fact it doubts CO2 as a driver.
The discrepancy between assumed CO2 forcing and T is underlined by the general high CO2 level in the atmosphere, the planet will reach a glaciation from here on, to develop extreme ice shields despite CO2 levels this high. The FPS is solved as mentioned.
Furthermore forces mentioned in the Schwarck study explain the Katian warming already:
" Bodaevent:
Continental Flood Basalt Province.Alternatively to a bolide impact, LIPs have been postulated as warming triggers."The forcing here that matters is Ice albedo reduction due to dust and ashes.
We can see this again when younger impacts and events causie warming rather then cooling.
An accumulation of dust and ashes at the poles are the result of a rather quickly cleanse of the atmosphere."(3) The period following the Katian sees falling CO2 and falling temperature.
The period of high glaciation during the Himantian sees CO2 estimates
dropping to perhaps 1500ppm. Relative to our recent ice ages with 180ppm CO2,
the Himantian CO2 forcing would thus be perhaps +11Wm^-2 while the relative solar forcing would be -8Wm^-2."(3) "dropping to perhaps 1500ppm". The Schwarck study claims PAL up to x6 till x20. Please specify "perhaps"
and clarify why it is not PAL but minimum PAL x3 according to you. Where are Schwank et.al wrong ?Reminding here that the level of CO2 does not matter in the first place unless it is below PAL (max -1°C), using my axioms.
Again you apply axiomatical values, which are not needed to explain temperatures, you are still using the FSP as a theory support, or to bring it in an equilibrium with
CO2 forcing, by trying to "ramp up" CO2 to a minimum of 1500ppm. Ironically this opposites many attempts
that try to lower CO2 to explain why a glaciation happens, despite ~6000ppm before and after the glaciation, in the first place. These views higlight the needs to explain CO2 forcings as assumed (too high)."(4) Your assertion @89 is that the major forcing of climate is the tectonic positioning of land over polar regions.
Yet there was such land over polar regions throughout the Ordovician when these great swings of climate appear suggesting
the climate was being forced by entirely different mechnisms.I would therefore suggest you have failed to provide any support for your assertion "CO2 is no driver at all." "
(4)This is partly true, as strong as it is the Ice has to build up, which happens very quickly in the hirnation, after the Bodaevent.
The middle to late ordovician is in transition, the continental drift towards the pole is remarkable.
Which is documented with the Silurian:Furthermore one has to take in account the varying lengths of time periods. The ordovician has been added historicaly,
it was included in the silurian before, therefore this interesting periods are "staunched".Antarctica shows a trend towards having a "drop back" to the south pole, mentioned in the devonian and possible in the jurassic.
Maybe this happened here too and we need more accurate paleogeorgraphic data.Answering two other comments here made by other users:
89.Moderator response:
"[PS] This is heading way into sloganeering territory. You are selecting only observations that support your ideas and ignoring completely all others. Science does not operate that like.
You cannot ignore measured increase in downwelling radiation, conservation of energy, nor explain past climate change with hand-wavy statements that violate physics.
If you have a theory that can match all observations, simpler and with better precision than current theory and concordant with laws of physics then by all means publish. Meanwhile,
current climate theory is the one that matches Occams razor. No more half-baked sophistry please."My theory already has a better explanation with its radical attempt, that is the whole point. This is not "sloganeering" it is just a very radical attempt so it asks for situations where we have evidence that show CO2 as a significant driver, relating to topic.
I understand that my radical attempt makes it easy for me but i have to insist on the fairness that i am allowed to show that radical assumptions that i made, make more sense then your axiomatical assumptions.
There is the inherit problem that we eventualy go off topic but i have to ask you at this point which laws and forcings (radiation, energy conservation) are ignored by me in which way ?
I ignore factors as far as they allow me, hence ockham.
I insinuate that your axioms make less sence then mine. Your critisicsm lacks precission at this stage, when it comes to why my radical assumptions are not allowed and where they are not concordant with laws of physics.90. Eclectic:
"Nyood, the importance of CO2 as a driver of climate, is supported by (A) theoretical calculations [Arrhenius and later scientists]; is supported by (B) experimental evidence; is supported by
(C) observational evidence; and is supported by (D) geological evidence. In other words, the mainstream science developed during the past 200 years.The principle of Occam's Razor is a often a helpful guide to thinking : it is not in itself evidence and it is not in itself a method of proof.
Ockham (or Occam) did not support the cutting off or ignoring of evidence. Newton and Einstein did not ignore evidence. Nyood, why do you choose to ignore evidence?"
(A) Arrhenius,Planck Feldmann et.al give a frame, it is known that we can not apply CO2 with a clear value (uncertainty). This leads to a Saturation and or Lindzen et.al and therefore inevitable offtopic, as much as i am willing to discuss it.
(B) same as (A)
(C) I clame that observational evidence support my theory today: Dramatic CO2 increase with a moderate warming trend. My initial post was rightfully snipped of modern time references as offtopic.
(D) Geological evidence is the core of the LPC theory.
- CO2 was higher in the past
MA Rodger at 17:45 PM on 4 November, 2019Nyood @89,
You ask that we roll back to your initial comment here, up-thread @83 where you begin by quoting from a talk by Schwark & Bauersachs [slides] quoting from its summary:-
"Massive perturbations of the atmospheric and hydrospheric carbon cycle occurred with CO2 concentration varying between 8-16 x PAL and near PAL over short periods of time." (PAL = Present Atmospheric Level.)
From this you conclude the following:-
"This is quite remarkable, it tells us that a glaciation is capable to absorb even CO2 ammounts of 6000ppm. It does not matter how high CO2 Levels are, a glaciation will happen when the following event occurs:"
Your conclusion is incorrect on a number of levels.
(1) The total climate forcing from 6000ppm CO2 is very roughly 40Wm^-2. There is no evidence to suggest that climate was impacted by such forcings (from any source) during the Ordovician.
(2) According to your cited reference (slides 11 & 14), the period with elevated CO2 significantly above 4000ppm coincides with the Katian, a period of warming.
(3) The period following the Katian sees falling CO2 and falling temperature. The period of high glaciation during the Himantian sees CO2 estimates dropping to perhaps 1500ppm. Relative to our recent ice ages with 180ppm CO2, the Himantian CO2 forcing would thus be perhaps +11Wm^-2 while the relative solar forcing would be -8Wm^-2.
(4) Your assertion @89 is that the major forcing of climate is the tectonic positioning of land over polar regions. Yet there was such land over polar regions throughout the Ordovician when these great swings of climate appear suggesting the climate was being forced by entirely different mechnisms.
I would therefore suggest you have failed to provide any support for your assertion "CO2 is no driver at all."
- It's not us
scaddenp at 06:47 AM on 2 October, 2019For a purely empirical fit of ENSO, Volcano, solar to temps since 1950, try here. Unlike other curve-fitting exercises which try to show warming is due orbit of jupiter, rise of irrigation etc, this uses half the data as training set and then uses the result to model the other half.
Benestad & Schmidt 2009 challenged Scafetta nonsense with naive empirical analysis of effects of forcing which I think may be closer to what you want.
- CO2 effect is saturated
MA Rodger at 01:25 AM on 4 September, 2019GwsB @525,
You ask if that Wiki graph you show @525 is misleading. It certainly is!!
That Wiki graph simply shows the chance of a photon travelling vertically through today's atmosphere without a particular species of GHG absorbing it en route. It shows nothing of how many such photons would be travelling at each wavelength or even in what direction. The CO2 absorption band at 2.7μm is stopping solar radiation coming in from the sun not IR going out. The CO2 absorption band at 4.3μm sits in the gap between incoming solar radiation and outgoing IR - there are effectively no photons to be absorbed so it has no relevance to climate. And the inability of a photon to travel un-absorbed by GHGs out through the atmosphere does not prevent the mechanisms of the greenhouse effect from gaining strength through additonal levels of GHG. And I should add that the Wiki page you took the graph from provides a woeful attempt to describe the mechanisms of the GH effect.
You say "The basic physics is simple: A photon of light at a wavelength of 14 μm [15μm] is passed from one CO2 molecule to the next performing a kind of random walk until it exits the atmosphere. There are two exits, outer space and the earth. Saturation means that a photon starting from the earth has very little chance of exiting to outer space." The effect of this 'saturation' is solely that there will be a random walk as all photons will be absopbed. This does not of itself make the chances of IR resulting from that absorption exiting into space small.
Interestingly, you cite Zhong & Haig (2013) 'The greenhouse effect and carbon dioxide' yet you fail to acknowledge the finding of that paper which is "We conclude that as the concentration of CO2 in the Earth’s atmosphere continues to rise there will be no saturation in its absorption of radiation and thus there can be no complacency with regards to its potential to further warm the climate."
Instead you set out contradictory conclusions of your own - "The total negative impact is almost cancelled by the positive impact around 15 μm."
The GH-effect works because the emission & re-emission of IR from the atmosphere containing GHGs will only occur at those same wavebands which subject to are absorption. But the rate of re-emission is set by air temperature. As the temperature drops through the troposphere, the point where emissions will get out into space through the thinner upper atmosphere; that point in the troposphere will be colder. Thus the GHG at that higher altitude will re-emit less IR because it is colder. The more the GHG in the atmosphere, the higher the altitude and the bit of troposphere which emits into space and thus the less IR is emited.
Of course, as the graphics in Zhong & Haig show, that mechanism will go into reverse as the altitude becomes high enough to reach the stratosphere. In the stratosphere, temperature rises with altitude and so the more GHG the greater the IR emissions into space. This is the mechanism which you mention being apparent in their Fig5b which you say results in the increasing GH-effect being "almost cancelled." However, the extra GHG effect of CO2, although reduced with increasing CO2 concentrations in the well-konwn logathithmic relationship, does not peak even if the 15μm band is taken in isolation. It keeps on increasing. And at CO2 levels above 2500ppm(v), the 15μm band is boosted by a compound absorption band at 10μm.
The climate forcing of CO2 does not hit an upper limit. In the words of Zong & Haig (2013), "as the concentration of CO2 in the Earth’s atmosphere continues to rise, there will be no saturation in its absorption of radiation."
- Medieval Warm Period was warmer
scaddenp at 08:10 AM on 27 August, 2019yes. Where no temperature measurements exist, then proxies are all you have.
Dont let a denier take you down the path of believing that climate theory depending on paleoclimate studies. Paleoclimate studies are useful testing grounds - if our current understanding of climate cannot reproduce measurements of temperature given the uncertaintites in the temperature measurement and our understanding of the forcings operating at the time, then the theory would be in trouble. Not the case. Paleoclimate is also useful in constraining climate sensitivity. However, uncertainties in estimating solar output, aerosols, albedo and temperature all create significant limits compared to analysing the physics of the climate system today.
- Models are unreliable
MA Rodger at 20:09 PM on 15 August, 2019rupisnark @1151,
The basic message is as Eclectic @1152 says, Christy is trying to pull the wool over your eyes. It may be he has managed to pull the wool over his own eyes as well. That would square with him being in denial over climate change.
And Eclectic @1152 is correct to say that AGW is a phenomenon at the TOA but Christy is not discussing TOA. He is indeed obfuscating.Your first point, that global evaporation can vary by large amounts month-to-month (Christy quoted examples of 24 and 27 'units' in his talk, a variation peak-to-peak of some 12%, a little more variation than his words in GWPF Note 17 - "In other words, evaporation might be 24 one month, but it might be 26 the next."), looking at actual monthly variation, the maximum variation of measured global monthly precipitation over decads (there's a graph of it 1980-2011 on this web-page) is about 12% peak-to-peak. Thus to say such a variation could occur "one month" to "the next" is pure exaggeration. The typical variation month-to-month is far far smaller.
And it is far far smaller doubly-so. Your point that 12% is a big value is twice incorrect. As they say '100% of naff-all is still naff-all.' And the typical variation month-to-month in surface heat flux due to precipitation is naff-all relative to the total precipitation which in turn is a small component of the total surface heat flux.
And your inference that such variation in precipitation would be even larger at longer timescales, "annual, let alone centennial fluctuation" is not correct. Over longer timescales the variations will tend to average out, although there will be trends caused by the likes of AGW.
You also suggest that longer term fluctuation could exist in "the many other variables of both inut (eg amount of solar radiation) and output." The solar cycle resilts in TSI wobbling by 1Wm^-2 peak-to-peak. In Christy-units that would be 0.07 units peak-to-peak (of the 11-year cycle) but when averaged out over longer periods the measure would be far far smaller. That this is a minor effect climate-wise is evinced by the absence of any noticable 11-year climate cycle.Your second point is that "Christy’s diagram does NOT imply 0.5 units is retained." I don't know why you would suggest such an implication. In GWPF Note 17 Christy states "The extra carbon dioxide we have added to the atmosphere amounts to about an extra 0.5 of a unit of the 100 downwelling from the air." So if the CO2 is there, surely the 0.5 units are there. I see no evidence of any implication that the forcing is not permanent.
You further suggest that there is "extra heat being lost in the troposphere" which might provide "one possible reason," this proposal "backed up" by an area of the upper troposphere that has not warmed in line with modelled projections. I don't follow the logic. By what mechanism would a cooler part of the upper troposphere constitute a sink for a heat flux of 0.5 Christy-units? - CO2 lags temperature
scaddenp at 08:08 AM on 14 August, 2019"Great question. Also an intellegent question. It's something that many Climate Scientists have tried to brush off with a "yes, but CO2 then becomes the forcing agent" as if autocorrelation is only done at the beginning of each interglacial phase. It isn't. It's done over the entire time series, including when CO2 is suppose to become the forcing factor."
Let's break this down. Firstly, do you accept that glacial cycle is orbitally forced? Further discussion makes no sense if this is not the case.
Assuming you accept orbital forcing, how do you explain why SH glaciation is synchronous with NH (since orbital forcing is anti-phased). Its easy if you accept known physics (GHE included) but you apparently want to deny that increasing CO2 will warm the planet.
Secondly, how about linking to some more actual detail about your "autocorrelation" stuff. I dont get your point and I certainly not clear to me what you think you are proving. The relationship between T and CO2 is still somewhat unconstrained but is clearly non-linear and involves multiple mechanisms operating on scales from years to millenia.
What is the basis for your understanding of "their ever decreasing estimates of how much CO2 impact climate". I certainly do not get that from successive IPCC reports.
You seem to be implying that papers on direct observation were arguments from correlation. This is not the case. The arguments in those are of the form, "fundimental physics allows us to predict what observations done by this method would show. Let compare model results with observation".
So from this, you compute how much much the radiation at the surface will change with GHG concentration change - and measure it. You look at how GHG changes would change the spectrum of outgoing or incoming radiation - and measure them. That is what those papers do. Hansen and Sato compute forcing from change in GHG using ice core bubbles as proxy for atmospheric concentration, and compute the change in albedo based on sealevel etc, and finally the global solar irradiation change from milankovitch. Climate theory would expect icecore temperature to be related to that forcing calculation extremely closely and that is what is observed. A failure to observe that would be evidence against.
Can I ask whether you accept Planck Law? ie, if irradiation of surface increases, then it temperature must rise.
Finally, climate change at present appears to be forced by GHG change. The feedback mechanisms that apply during ice ages wont cut in any significant way for 100s of years. The natural system is still moping up about half of our emissions which make 616 invalid (actually so many issues with this, its hard to know where to start. You need 30 year averages remove the internally variability, especially ENSO.)
- There is no consensus
Rob Honeycutt at 09:21 AM on 10 August, 2019cstrouss...
"That the AGW hypothesis is true and it will have increasing implications on global weather patterns? Or that there it is a catastrophic situation and human must immediately and completely restructure our social and economic systems if the species is to survive?
Why is this an either/or question? Can they not both be true?
Think of climate change impacts as a sliding scale that vary based on our total emissions. Within a reasonable range of uncertainty, probably the best understood elements of AGW are the basics of radiative forcing and the response in global mean temperature. The concensus is that we'll likely see about 2.8°C of warming for each doubling of CO2 over preindustrial levels. I think almost every scientist working in the field would agree with that statement.
We also know for certain, the more we push the system, the more damage we're ultimately going to see. Again, that's not a controversial statement for scientists.
What you're doing, though, is running off into hyperbole. I don't think many scientists would agree that we must "...immediately and completely restructure our social and economic systems if the species is to survive." Our species is likely to survive whatever happens. We're extraordinarily adaptable. But, most of the natural world that we rely on to sustain 7+ billion people on the planet is not nearly as adaptable as we are.
Therein lay the problem. Yes, if we continue to burn everything we can get dig out of the earth, most scientists will likely agree that would probably mean a total collapse of modern civilization. Lots of death, destruction and suffering.
Can we avoid that? Yes, of course. We are going to see significant challenges and costs due to our emissions so far. We are already seeing very good signs of progress with the cost of wind and solar continuing to fall. But there are so many more challenges we're going to see.
Nothing I'm saying here is controversial, and I believe this would all fall within the definition of the "scientific consensus on AGW."
Here's what should give you the most concern about all this: thermal inertia.
I hope you agree that we are now seeing many of the impacts of climate change starting to emerge. Melting ice sheets, extreme weather events, heat waves, etc. Now, consider that there is a 30 year lag in the climate system since most of the heat goes into the world's oceans. That heat takes time to come into equilibrium with the land, ice and atmosphere. Thus the impacts we're seeing today are the result of where CO2 levels were some 30 years ago.
If we were to stop all carbon emissions tomorrow the planet would continue to warm through the middle of this century. If we're seeing impacts already you can bet your bottom dollar they're going to start getting a lot worse over the coming three decades. Best case scenario says we'll be able to bring emissions to zero by ~2050. That means continued warming through 2080 at a minimum.
Also consider that, in the past at 450ppmv CO2 levels, there were no ice sheets on this planet. The planet was too warm to sustain them. It'll take another 1000 years to melt them entirely, but we're talking about sea levels rising to up to 70m over the coming centuries. That's a completely different planet than we currently live on. No Florida at all. It's gone. LA, SF, NYC, Tokyo, and 100's of other cities. All under water.
It's not the end of our species but replacing entire cities ain't gonna be cheap. The better investment is to reduce our carbon emissions as quickly as we can and keep CO2 levels as low as we possibly can. That's an enormous task. It's one that needs to happen fast.
Again, none of this is controversial. Gore, DiCaprio and Thunberg are not scientists but they are doing their level best to help convey to the world what is overwhelmingly agreed in the scientific community.
- 'No doubt left' about scientific consensus on global warming, say experts
Bob Loblaw at 11:26 AM on 31 July, 2019For a less intense introduction to climate change, I often suggest the first IPCC report from 1990. It covers a lot more basics that are simply assumed in later reports.
https://www.ipcc.ch/report/ar1/wg1/
In the contents of the Executive Summary, the first section lists:
What factors determine global climate?
What natural factors are important?
How do we know that the natural greenhouse effect is real?
How might human activities change global climate?
In the main table of contents, Chapter 1 is titled "Greehouse gases and Aerosols". It covers five specific gases, plus ozone and related trace gases, and then aerosols.
Chapter 2 is titled "Radiative Forcing of Climate". Its sections cover greenhouse gases, solar radiation, direct aerosol effects, indirect aerosol effects, and surface characteristics.
So much for the idea that the IPCC does not consider other factors besides fossil fuel emissions. This is so easy to look up.
- 'No doubt left' about scientific consensus on global warming, say experts
Rob Honeycutt at 04:45 AM on 31 July, 2019Hoipolloi... I get the idea that you've never read the IPCC reports because they most certainly do not claim that FF's are the "sole reason" for climate change. There are extensive sections on urbanization and deforestation as well as dozens of other related issues, including changes in solar forcing, volcanic influences, etc, etc.
You also seem to be under the mistaken assumption that the IPCC does computer modeling. They don't. The IPCC only does a report on all the published science related to climate change. The science cuts across a very wide range of fields of research and their purposes is to pull all that disperate information together into a single report.
My suggestion for you would be to spend at least an hour purusing through the IPCC reports. I don't even need to post a link. They're very easy to find and they've updated the website to make the reports very easy to navigate.
Have fun!
- 2019 SkS Weekly Climate Change & Global Warming News Roundup #27
scaddenp at 08:06 AM on 24 July, 2019I would add two things.
1/ The actual surface temperature year to year is strongly affected by internal variation. ie heat sloshing around in a wet, unevenly heated planet. ENSO is the dominant component of this. For this reason, climate is defined as 30 year average. Arguably, Ocean Heat Content is a better metric than surface because most of the heat goes into the ocean and the total energy varies less (the little wobbles are ocean/atmosphere exchange). However, we have only been able to measure this with confidence relatively recently.
2/ Climate changes in response to net forcing. Changes GHGs are only one element (though the dominant one in recent history), but aerosols either man made or from volcanoes are also important (especially mid 20th century, and after really big tropical volcano eruptions). Changes in solar input and albedo are the other important inputs into calculation of forcings.
- We're heading into an ice age
Daniel Bailey at 02:23 AM on 25 June, 2019The change in solar forcing is about -0.1W/m2, which would be made up in just 3 years of current CO2 concentration growth:
https://www.nature.com/articles/ncomms8535
https://agupubs.onlinelibrary.wiley.com/doi/full/10.1002/2014JD022022
https://agupubs.onlinelibrary.wiley.com/doi/full/10.1002/2013EF000205
https://agupubs.onlinelibrary.wiley.com/doi/abs/10.1029/2018JD028922
- Holocene Optimum was warmer
Phaedrus1 at 21:29 PM on 21 June, 2019From the National Climate Data Center:
Paleoclimatologists have long suspected that the "middle Holocene," a period roughly from 7,000 to 5,000 years ago, was warmer than the present day. Terms like the Altithermal or Hypsithermal or Climatic Optimum have all been used to refer to this warm period that marked the middle of the current interglacial period. Today, however, we know that these terms are obsolete and that the truth of the Holocene is more complicated than originally believed.
What is most remarkable about the mid-Holocene is that we now have a good understanding of both the global patterns of temperature change during that period and what caused them. It appears clear that changes in Earth's orbit have operated slowly over thousands and millions of years to change the amount of solar radiation reaching each latitudinal band of Earth during each month. These orbital changes can be easily calculated and predict that the Northern Hemisphere should have been warmer than today during the mid-Holocene in the summer and colder in the winter. The combination of warmer summers and colder winters is apparent for some regions in the proxy records and model simulations. There are some important exceptions to this pattern, however, including colder summers in the monsoon regions of Africa and Asia due to stronger monsoons with associated increased cloud cover during the mid-Holocene, and warmer winters at high latitudes due to reduction of winter sea ice cover caused by more summer melting.
In summary, the mid-Holocene, roughly 6,000 years ago, was generally warmer than today during summer in the Northern Hemisphere. In some locations, this could be true for winter as well. Moreover, we clearly know the cause of this natural warming, and we know without doubt that this proven "astronomical" climate forcing mechanism cannot be responsible for the warming over the last 100 years.
https://www.ncdc.noaa.gov/global-warming/mid-holocene-warm-period
- Climate's changed before
Daniel Bailey at 00:37 AM on 13 June, 2019Agreed with MA Rodger.
No Venus-syndrome for the Earth:
"With the more realistic physics in the Russell model the runaway water vapor feedback that exists with idealized concepts does not occur. However, the high climate sensitivity has implications for the habitability of the planet, should all fossil fuels actually be burned.
Furthermore, we show that the calculated climate sensitivity is consistent with global temperature and CO2 amounts that are estimated to have existed at earlier times in Earth's history when the planet was ice-free.
One implication is that if we should "succeed" in digging up and burning all fossil fuels, some parts of the planet would become literally uninhabitable, with some time in the year having wet bulb temperature exceeding 35°C.
At such temperatures, for reasons of physiology and physics, humans cannot survive, because even under ideal conditions of rest and ventilation, it is physically impossible for the environment to carry away the 100 W of metabolic heat that a human body generates when it is at rest. Thus even a person lying quietly naked in hurricane force winds would be unable to survive.
Temperatures even several degrees below this extreme limit would be sufficient to make a region practically uninhabitable for living and working.
The picture that emerges for Earth sometime in the distant future, if we should dig up and burn every fossil fuel, is thus consistent with that depicted in "Storms" — an ice-free Antarctica and a desolate planet without human inhabitants"
So no runaway. But Hansen notes that it won't take a runaway to basically completely eradicate civilization as we know it. Supported by this:
"While dominated by anthropogenic forcing in these recent times, solar variability in prior eras caused much larger relative influences.
The early Sun was approximately 70% as bright as at the present when it joined the main sequence about 4.6 billion years ago with a current rate of increase in luminosity of 0.009% per million year (Hecht 1994). At this rate, it will take 10 million years for the background solar brightness to increase by the 0.1% typical of a solar-cycle variation, and another 3.5 billion years for heating from the Sun to create Earth-surface conditions similar to those of the present-day Venus; although additional effects, such as feedback from enhanced ocean evaporation, may accelerate this warming and make the Earth uninhabitable (at least to present-day complex lifeforms) in about one-billion years."
- Humans and volcanoes caused nearly all of global heating in past 140 years
scaddenp at 08:37 AM on 4 June, 2019Just one other further point. The milankovitch forcing for ice ages is very slow. At 65N (where the changes in solar insolation make the difference between summer melt or not), the change is of order of 0.01W/century. By contrast, injecting GHG into the atmosphere at the current rate is producing a forcing of order 4W/century over the entire globe.
I am always suspicious of statement like "The climate system is a very compelex system that nobody fully understands. " You will be hard pressed to find a scientist that would claim to "fully understand" any physical system. We do however understand a great deal about physical systems including climate. For instance, we can say with enormous confidence that if you change the incoming energy reaching the surface than the climate will change in response and furthermore, the amount of change will be positively (not necessarily linearly) related to the amount of change in that incoming energy. Scientists are a skeptical bunch butthey are extremely wedded to concept of conservation of energy.
- Humans and volcanoes caused nearly all of global heating in past 140 years
Eclectic at 07:24 AM on 1 June, 2019Higgijh @post5 ,
If I have correctly understood your thoughts : your are basically concerned by the low time-resolution of past temperature (proxy) records & what may be inferred from them.
Certainly, the time-resolution becomes fuzzier, the farther back in time we explore. We can delineate the past 1000 - 2000 years of climate changes rather more exactly than the past 10,000 years or the 800,000 years (of the ice-core records) or the past 500 million years (with very low time-resolution in say the Ordovician period).
Yet the laws of physics haven't changed during all that time, and we can see [for example] that Newtonian Laws of Motion must have applied just as well during the Ordovician as during the current Holocene.
How does that apply to world temperature changes? If we look at the past 10,000 years (of the Holocene interglacial) we see a flat plateau of about 5,000 years [the "Optimum"] followed by the latest 5.000 years showing a gradual decline in temperature, which would eventually have triggered a new glaciation in about 20,000 or 30,000 years' time or more (an "abnormally" long interglacial, owing to the current low-ellipticity of Earth orbit). Or at least, that is what would happen, without the human [CO2] intervention of the past century or two.
The temperature record of recent centuries shows that the reaction to a major volcanic eruption is a very brief world temperature dip (less than 5 years). And the reaction to a major diminution of insolation (a Grand Solar Minimum) is a much more prolonged dip ~ but only about 0.3 degrees. These sorts of excursions explain why the "shape" of the Holocene resembles a relatively smooth plateau. The "wiggles" of temperature (such as the Medieval Warm Period or the Little Ice Age) are very minor indeed, against the general background.
Higgijh ~ going farther back in time, if you had been alive during the time of the Younger Dryas (and miraculously you lived for twice Methuselah's age! ) you would have seen a large excursion of world temperature during a 1000 years. But that change was gradual, compared with the rocket-like rise in temperature of the immediate 50 - 100 years past. And the cause of the Younger Dryas would have been very obvious to you (to you and your team of observer-scientists). The point being, that "low time-resolution" is not a problem in seeing the results of major climate factors.
Similarly, going back through 800,000 years, you see the climate alter in a cyclic way (Milankovitch insolation "forcing changes" of up to 0.7 watts/m2 , triggering a CO2 greenhouse change much larger than that). Again, the "smoothing" of the time-resolution record is not a problem for understanding the history.
For a separate additional effect to produce a rapid spike (up or down), there would have to be some large & powerful short-term causation for temperature change. Just as in Newtonian terms, a mass does not change velocity unless it is acted upon by a force ~ so too for climate : climate does not change unless something causes it to change.
Which is why - in the observed absence of major climate factor changes - it does not matter that the (proxy) climate record has a resolution far worse i.e. far fuzzier than annual / decadal / or centennial, as the case may be.
Higgijh, I hope I have addressed your basic concern. But perhaps you have deeper unexpressed concerns?
- Climate Adam reacts to Bill Nye: "The planet's on f@*&ing fire!"
scaddenp at 13:31 PM on 21 May, 2019Nope, radiative heat loss from earth surface is much larger conductive or convective heat loss. This is simple measurement. I gave you a couple of examples where you could test your theory versus mainline physics.
If you want to test a theory against data, then can I suggest the Desert Rock archive? Not only does it have basic met dat like humidity, temp, wind speed etc, but it has also got instruments measuring incoming and outgoing radiation in various parts of the spectra.
"Climatologists believe that ALL past climate change events were caused by greenhouse gases scares the hell out of me. "
That is a ridiculous claim with no basis at all. A simple read of just the Paleoclimate chapter of any the IPCC WG1 reports would contradict that. You could summarise climate change theory as being that climate (30 year meteorological averages) changes in response to NET forcings. The principal source of forcings are change in solar input (or distribution); change in albedo; or change atmospheric composition. These are not independent variables. I strongly suggest you acquaint yourself with the science by at least looking at an IPCC WG1 report.
PS, also a geologist/geophysicist. I look after a model for thermal evolution of sedimatary basins and the consequent oil/gas generation. Actually mostly past tense - my country has more or less ended petroleum exploration and as from June I am reassigned.
- CO2 was higher in the past
MA Rodger at 18:56 PM on 17 May, 2019Warend @81,
You state that published solar luminosities show "the solar intensity was 11% less during the start of the glaciation event." That seems very high. Are we talking about the same "glaciation event"? Perhaps you could point to the publications you cite. A simple Wikithing reference gives Fig 1 from Ribas (2009) below which suggests a reduction of slightly under 4% in solar intensity for the Late Ordovician.
I also fail to follow your assessment of that 11% reduction of solar forcing. Perhaps you could set out a more detailed assessment.
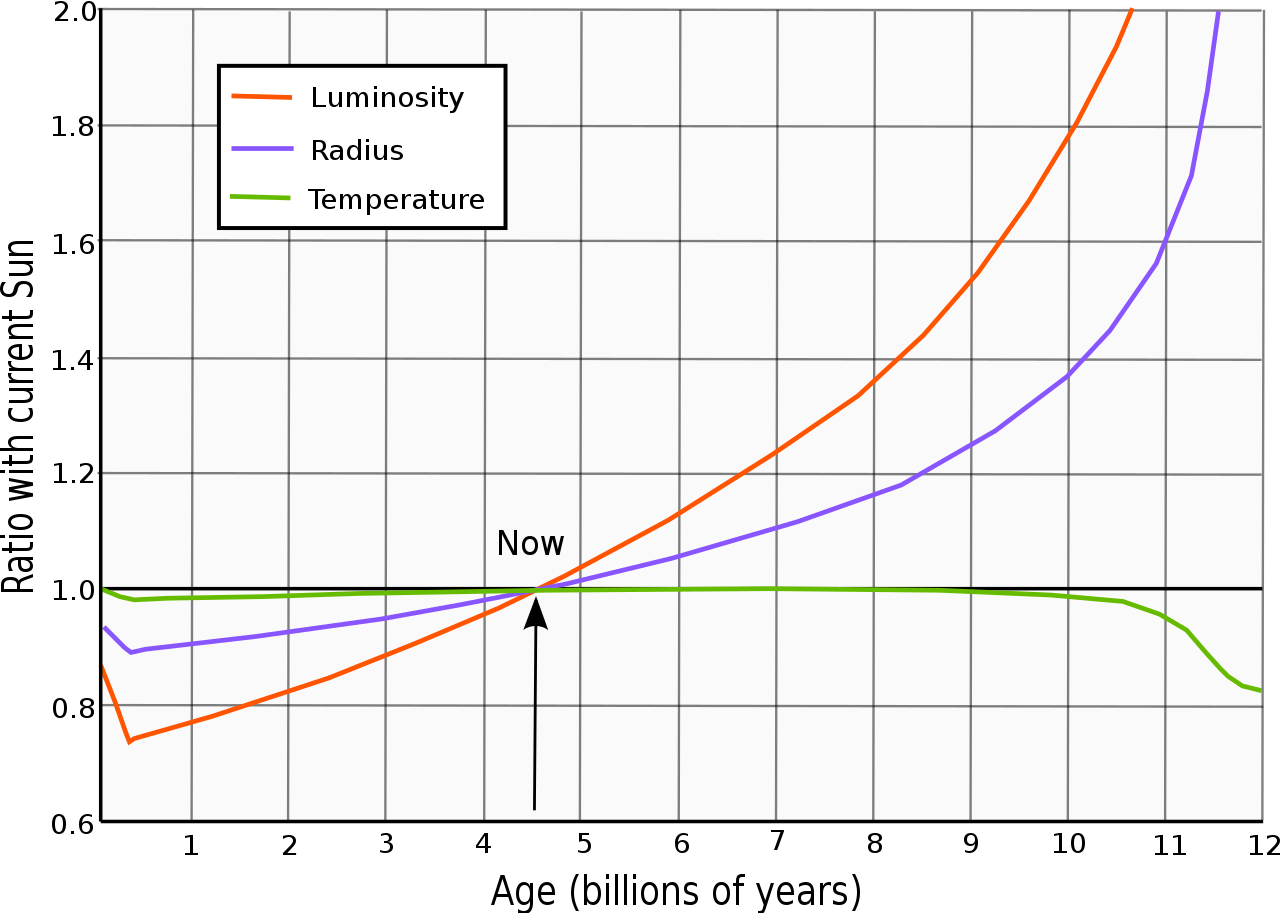
- CO2 was higher in the past
Warend at 17:15 PM on 17 May, 2019I am not challanging the theory or formulations that compose stellar evolution models. But what are the degrees of uncertainty or variance between calculated model results and actual stellar luminosities over time. Because of the time scales this cannot be done directly with observations over time. Looking at published solar luminosities the solar intensity was 11% less during the start of the glaciation event...assuming a 25% forcing contribution due to solar radiation this yields a nominal forcing effect of ~3%. But again what's the uncertainty...I so far have not found a published value. This is understandable given the time frames and the current impossibility to conduct validating experiments. There was some mention of errors in the range of 10 to 15%. If that is the degree of uncertainty in the stellar model results, that would say that there is too much uncertainty relative to the nominal effect. Perhaps there are similar uncertainties, and effect level magnitudes, with the other coincidental conditions/effects?
- It's the sun
TVC15 at 06:42 AM on 25 April, 2019Hi Again,
I shared the "Sun & climate: moving in opposite directions" link on a public forum with the snipet: In the last 35 years of global warming, the sun has shown a slight cooling trend. Sun and climate have been going in opposite directions. In the past century, the Sun can explain some of the increase in global temperatures, but a relatively small amount.
A climate denier swooped in all angry and made these comments: As for that 35 year cooling trend, a child can see the fallacy in that arguement.
Cooling trend from what? The highest cycle in the 400 years observed. Yet this is followed, in your 35 years of "cooling" by the 2nd and 3rd highest cycles is it not? So against the 400 year average output is still greatly higher- why would we expect cooling of any kind, which could only happen if output was LOWER than the 400 year average? (Solar output is still far higher during the entire 35 years than it was for 400 prior so the sun is still forcing warming, not cooling as you claim).
I am not quite sure how to respond.
- The temperature evolution after 2016 suggests hotter future
scaddenp at 08:36 AM on 23 March, 2019thinkingman - I appreciate your question. It is always good to clarify so we dont talk past each other. It is also worth clarifying "cooling".
By "natural cooling forces" I understand you to mean things that would affect the temperature trend as opposed to year by year or even decadal average variation. On scale of 3-10 years, then the natural, chaotic, ENSO cycle is dominant. The upper ocean exchanges heat with atmosphere. A series of La Nina can look like cooling; a series of El Nino can look like warming. However on climatic scales (or even scales of decade), these do not affect the temperature trend. I mention this because you asked "since 1998" which immediately rings alarm bells. A lot of pseudo-skeptic arguments are based on cherry picking a big El nino event and then comparing trend after that. You can expect "since 2016" to become popular on certain websites.
Assuming you mean temperature trend and actual forcing, I can be more definitive. You could say that AGW is countering some external forcings. The Milankovich cycle has been slowly cooling for some time, though the effect is so slow that its impact on climate even over a century would be hard to determine. You could also argue that total solar irradience trends since 1990s has been slightly negative. The change in forcing again is incredibly minor comparied to measured AGW-driven changes in surface radiation. I dont see volcanic aerosols having any particular trend.
I do not see any convincing evidence for some magical 60 year/80 year cycles, especially when proponents struggle to identify a physical source.
- The temperature evolution after 2016 suggests hotter future
scaddenp at 07:13 AM on 21 March, 2019Invoking unspecified "natural cycles" does not further understanding. There are certainly natural "cycles" or more likely quasi-periodic variations at work. It is important to distinquish between internal variability (energy moving around in an unevenly heated water-covered planet) and variability in climate forcing (eg milankovich cycles, solar output variation, volcanic aerosols). Internal variability is things like the ENSO cycle which is dominate cause of intra-decadal variability. These are unpredictable, (chaotic) and affect climate largely by heat exchange between ocean and atmosphere. Climate models have no skill in predicting these variations. When you see a graph like:
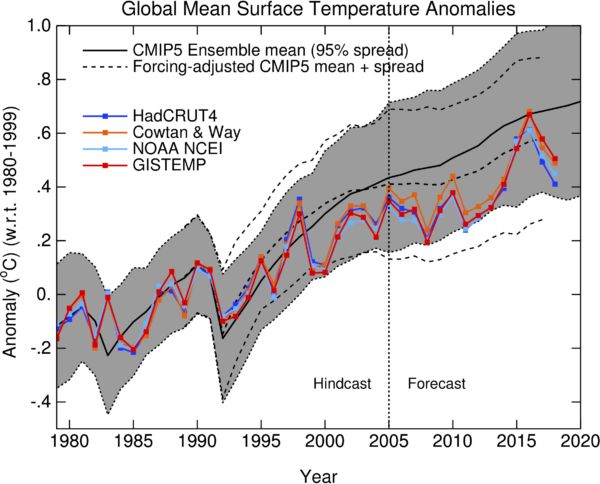
then the grey area is the space defined by multiple individual model runs. Any observational line within the grey area is compatiable with the model output. If you look at individual runs of the climate models, then you see the many possible outcomes. This post covers what the models are actually telling you. There is no skill expected at decadal predictions, but the model mean does a pretty good job at prediction the 30-year (climate) trends.
While small amounts of heat transfer from oceans affect temperature, blaming warming on heat coming from the ocean while ocean heat content is increasing is "voodoo economics". If some unknown ocean "cycle" is providing the heat, then how come the ocean is getting hotter?

Variation in external forcings is another story. The milankovich forcing is readily calculated and we are warming despite a very slow negative orbital forcing. Solar has quasi-periodic cycles but we can directly measure solar input at top of atmosphere. You cannot claim a solar cause when solar input is flat or declining. Volcanoes of cource are unpredictable but models must put in a "average" changes to aerosol forcings or the models would run too hot. You can always re-run models with actual forcings for solar, volcanic etc and this is done.
- Climate's changed before
scaddenp at 11:44 AM on 20 March, 2019Artemsis, the proposition is puzzling and it would help if you could get more information on what informs your denier. Estimating a global mean temperature through the Quarternary is not a simple proposition and it looks to me as if a no. of data sources have been mis-interpreted. The temperature of Greenland at LIG cf present might also be confused about what is "now" (The meaning of 0BP in ice core records). In short, we need the references used by the denier that back the above claims.
Beyond that there is some sleight-of-hand in the argument. Climate does not change on its own. It changes in response to changes in net forcings and the ice ages are no different. The ice age cycle is due to orbitally-driven changes in the distribution of solar insolation in the northern hemisphere, which are amplified into global change by CO2 and albedo feedbacks. Temperatures in NH polar regions can indeed be warmer in interglacials with lower CO2 because the incoming insolation for that region is much higher than today. This is not a global change however. More importantly, the milankovich forcing is now decreasing. Without our anthropogenic CO2 we should be slowly cooling. It is important to realize however that this change is very slow - milliwatts per century - compared to emission CO2 forcing which is more like 1W per century. Even without our emissions, the next glacial would have been 50k into future. (Berger and Loutre 2002)
- Next self-paced run of Denial101x starts on March 5
MA Rodger at 18:58 PM on 10 March, 2019Alonerock @46,
As nigelj @47/48, I too have not seen the need to watch the whole video (or actually listen - I was multi-tasking). I managed 9 minutes of the forty.
The speaker sets out that Total Slar Irradiance dips by up to 0.3% during a solar storm and also that this is not a good measure of the Climate Forcing for such an event. Indeed, it is argued the dip is likely the opposite - an increase in Climate Forcing. Further, this 0.3% dip in TSI is of the same magnitude as AGW and the only way we can assess AGW is by subtracting the natural Climate Forcings. Thus we have a problem if the natural Climate Forcing is so poorly accounted.
The speaker seems to be on the path of attributing recent global warming, not to AGW, but to the 0.3% dips in TSI which are not dips at all.
And the problems with such a proposal are:-
(1) The 0.3% occurs for just a day or two every few years (that is the major ones - the biggest by far was 0.3% or 4Wm^-2 and occurred once for three days back in 2003) while the assumption (which would make the 0.3% significant) is that such events are working 24/7/365, as is AGW.
(2) If such events were being mis-accounted by climatology (as claimed) and they were significant (as claimed), it would have to be demonstrated that such events are coincidental with the global warming. Thus these storms must be absent prior to 1970. And the warming must appear in the weeks months following these occasional events. The pre-satellite era has no such data but satellite data shows no indication of a post-1970 phenomenon having just started in 1976. And the best of luck matching the magnitude and timing of these big solar flares with climate warming. (The 2003 flare was followed by nothing of note bar several 2004 months that were rather cooler than previous.)
- New research, January 21-27, 2019
Swayseeker at 00:58 AM on 3 February, 2019Regarding your "forcings and feedaback" section, with polar air cooling down large areas of the USA there is a huge net gain in radiation heat transfer to cold surfaces. The cold surfaces are radiating far less and, if the strength of solar energy is the same, then the overall radiation gain by these cold surfaces can be 50% higher (say they gain 200 W/m^2 at 20 deg C, then they could be gaining 300W/m^2 at 0 deg C). Earth would lose its highest percentage of heat via the 8 to 14 micron atmospheric window with surface temperatures of 79 deg C. At 0 deg C we are losing the battle when it comes to overall radiation heat transfer (huge overall gain).
- Other planets are warming
MA Rodger at 19:53 PM on 25 January, 2019S0urce @53,
There is usually no dispute that the strength of the Sun has increased over the eons. (So says the Standard Solar Model although the 'weak early sun paradox' does occasionally throw up some contradictary ideas, eg Graedel et al 1991). Yet an increase of 200K in the Sun's temperature over periods of a century or even centuries is in a different league. A rise in temperature from 5800K to 6000K (with theSun unchanged in size) would result in a 14% increase in solar radiation, boosting Earth's insolation from 1366Wm^-2 to 1442Wm^-2. Solar insolation has been accurately measured for 40 years with no sign of such a rise.
 And actually, we wouldn't have required such measurements to notice an increase of that size. A rise of 200K in the Sun's temperature would have applied a ~12Wm^-2 forcing to Earth's climate, enough to boost Earth's global temperature by ~10ºC, a bit of a game changer if it happened over a period of a century or so.
 - Climate Carbon Bookkeeping
scaddenp at 06:17 AM on 17 January, 2019Dan, you do realize that multi-decade temperature oscillations occur because of changes to net forcing? They are not internal variability. The forcings at work during previous warm and cold periods are not at play now. You must look at all the factors affecting climate (solar, albedo, aerosols and GHG) when attempting attribution.
- It's the sun
AFT at 11:29 AM on 5 January, 2019I discovered this site about a month ago and have been working my way through several of the articles and thousands of comments. The comment traffic on this article has been quite light since mid 2017. Have the skeptics given up this argument?
My layman's absorption of all this is the following (expressed in my layman's language) — it seems that any argument along the lines of "it's current solar activity (of some variety)" is devastated by the broad array of evidence... less incoming radiation being measured, less outgoing radiation measured, nights warming faster than days, winters warming faster than summers. I think I get that, let me know if I missed or mistated something.
Does this array of evidence Is also work against the varieties of "it's past solar activity stored up and now being released", or could such forcings be consistent with the previously stated evidence? Or does that devolve into a war of statistics?
Thanks in advance.
- Arctic sea ice has recovered
Philippe Chantreau at 12:49 PM on 4 January, 2019https://www.nature.com/articles/s41467-017-00552-1 is where the acutal Stein paper is located.
I'll elaborate on the Stein et al (2017) paper since it is relevant to Arctic sea ice. Lowisss13 did not refer to the paper itself but to a blog post about the paper. A few things are surpsising in the blog post. There is a graph of sea ice that I could not locate anywhere in the paper. The blog post mentions solar activity but the paper has very little about that, only a mention of obliquity in the conclusion section. It uses a fairly novel proxy analysis and ther eare inconsitencies with already existing work. The authors are very careful to qualify the scope of the results. They point to summer sea ice coverage in conditions significantly warmer than today and ascribe it to major differences in the AMOC, not solar activity.
Here is part of their conclusion:
"Finally, we have compared the Arctic sea ice conditions of the LIG and simulated future climate projections for 2100 and 2300, based on two different IPCC scenarios2, the RCP4.5 (583 ppm CO2eq) and the RCP6 (808 ppm CO2eq) (Fig. 8). Both scenarios show a severe reduction in sea ice coverage in the late summer, i.e., summer sea ice concentrations are significantly lower than those of the LIG. With increasing atmospheric CO2, however, the reduction of sea ice in the central Arctic Ocean is more rapid and disproportionately high in comparison to its margin. Whereas the mid-LIG summer sea ice concentrations were still around 60 to 75% in the central Arctic Ocean, but only around 20% or less along the Atlantic-Water influenced Barents Sea continental margin, nearly ice-free conditions might be reached in the entire Arctic Ocean in 2300. The number of ice-free summer months is increasing with higher atmospheric CO2. Under these high CO2 concentrations, the winter sea ice may start to melt as well (Fig. 8). Furthermore, the higher obliquity during the LIG (Supplementary Table 6) may suggest an insolation forcing during the LIG, whereas for the climate scenarios RCP4.5 and RCP6 the additional heat fluxes are induced by increased greenhouse gas concentrations in the atmosphere."
Not much ground for optimism there.
- Climate's changed before
scaddenp at 12:03 PM on 20 December, 2018"This myth-busting deals with natural climate variability, yes? Isn't the uncertainty about ECS exactly directly related to that?"
Um, no? Using past climate to estimate ECS is plagued by the uncertainties in both estimates of past global temperature and past forcings. Naive estimates of TCR from short-term measurement do suffer from internal variability (not to be confused with natural climate variability in forcings).
Model estimates of ECS must deal with feedback - and the range there is largely due to the difficulties with clouds in current hardware. Ie not only how much does cloudiness change with a change in temperature but also change in high-level versus low level cloud (one is a positive feedback, the other is a negative feedback). Again, all of this is discusssed at length, with references in the IPCC WG1, (see table 9.5 for instance).
"Natural variability" is of two kinds - one is the internal variability due to uneven heating of wet planet. This is essentially weather and evens out over a 30 year time scale (hence climate being 30 year averages).
The other is natural climate variability due to changes in natural forcings - predominantly solar (both in strength and orbitally-induced variations in latitudinal distribution), and volcano aerosols.
- Little Ice Age? No. Big Warming Age? Yes.
Doug_C at 06:32 AM on 19 December, 2018It all comes down to relative radiative forcings and right now the positive radiative forcing by rapidly increasing the atmospheric concentration of carbon dioxide with the continued emissions of billions of tons of the gas a year overwhelms whatever negative forcing there may be from solar and other activities.
This is what denial is all about, pretending this forcing simply doesn't exist.
Unless someone comes up with a way to invalidate the Standard Model of how particles behave and interact then carbon dioxide is still going to absorb the EM radiation that is constantly being emitted by the Earth's surface and re-radiate about half of that intercepted heat back to the Earth's surface. The more CO2 we put into the air the warmer the Earth is going to get.
But because of the amount of money that is still tied up in the fossil fuel sector there are still some major palyers who will try and pull any rabbit they can from the hat to magically make this dynamic go away. And they just love the "The next Ice Age is Coming!!!" rabbit for the drama it evokes.
Climate change is not going away and every year we get closer to tipping points that are truly nasty in ecological, social and financial terms.
- Climate's changed before
Ed the Skeptic at 08:08 AM on 16 December, 2018I've read the other myth-busting pages. Lots of good information on many of them. I hope to engage on some that appear deficient from my semi-informed perspective. I have no dog in this hunt other than truth and scientific integrity. I'm disappointed by the personal commentary that some se fit to include.
Defendping consensus scientific orthodoxy ought be done with humility, lest you join the ranks of the scoffers and naysayers who pilloried the likes of Copernicus, Galileo, Einstein, and LeMaitre.
I'm not seeing lots of hard scientific evidence here on this myth-buster topic, just mostly declarations. Thus my posting.
This myth-busting deals with natural climate variability, yes? Isn't the uncertainty about ECS exactly directly related to that? It's wide range informed by some decadeal to millennial scale proxy temperature records—GISP2 stands out—would seem to indicate a significant uncertainty related to this topic, no? That's the only intended point.
Can anyone engaged hereing please explain the apparent certainty on the issue offered here on SKS relative to figure 8.14 and 8.15 of AR4 WG1?
Has anyone seen the NASA data showing significant decadal reduction in global cloudiness from around the 1980-2000 time frame, dropping from roughly 70% to 65% in two decades? That drop in cloudiness corresponds with an apparent increase in global surface solar radiation of roughly 4 W/m^2.
Where is that addressed in the AR4 WG1 tally of radiative forcing information included in the aforementioned figures 8.14 amd 8.15?
- Solar cycles cause global warming
Daniel Bailey at 10:59 AM on 21 November, 2018NASA tracks the solar forcing and compares it to global temperatures over time, here.

- Solar cycles cause global warming
michael sweet at 08:33 AM on 21 November, 2018Ed,
Googling "Solar Cycle Activity" gives a number of hits that describe solar cycle 24 as the weakest in a century. That means that you would expect the solar forcing would be smaller than usual, probably around 0.1C (my estimate). The peak was in 2014.
We observe that 2014 was the hottest year recorded at that time and was the hottest year without an El Nino (now 2017 holds that record). The effect of the sun is often delayed for a year or two. 2015 and 2016 also set heat records.
It seems to me that it was fortunate the solar cycle was so low or we would have roasted even more than we did 2014-2016. Hopefully politicians will do something before it is too late.
- New research, October 15-21, 2018
Lewis Carlson at 13:04 PM on 29 October, 2018I don't doubt CO2 plays a significant role, yet I've heard nothing in the news of how global broadcast transmitters could play a role in climate change by stimulating an ozone depletion mechanism called Relativistic Electron Precipitation. Is anybody aware of this?
Our climate is changing as many of us are aware and many have dedicated their lives and time to doing our best to set right the challenges we face so that our children and generations ahead may have a healthy ecosystem to grow in and thrive upon. About ten years ago I dove deep into the climate change issue and learned about many facets of this astronomical challenge we face, most importantly the problem that rising CO2 levels pose from man made sources. In my process of learning about various climate forcing mechanisms I became aware of another mechanism and have wondered for years of its potential significance in climate change. Through discourse with friends and others it seems little are aware of this other factor that could potentially play a role in the dynamics we’re seeing and I’m hoping to connect with you in hopes that you or one of your colleagues may be able to shed light on these curiosities should there be more to this other climate forcing mechanism, or good reasons to dismiss it. If we truly wish to solve this incredibly difficult task it seems to me that we should leave no stone unturned. So here I am doing my part and due diligence as best I know how. I hope it is well received with an open mind and an open heart.In 2007 I learned of a phenomenon known as Relativistic Electron Precipitation - REP and that some of the leading researchers of ionospheric physics, such as Michal Parrot of CNRS France head of DEMETER micro-satellite mission and VERSIM (VLF/ELF Remote Sensing of Ionospheres and Magnetospheres 96’ - 05’) who said in a research paper that using scientific transmitters it was becoming clear that it stimulates REP and could have a potential impact on “the global warming of the earth”.
“At VLF frequencies between 10 and 20 kHz, the ground-based transmitters are used for radio-navigation and communications. Their ionospheric perturbations include: the triggering of new waves, ionospheric heating, wave-electron interactions, and particle precipitation. At HF frequencies, the broadcasting stations utilise powerful transmitters which can heat the ionosphere and change the temperature and the density. All these wave dissipations in the ionosphere could participate to the global warming of the Earth because the change in global temperature increases the number of natural lightning discharges in the atmosphere. Then the supplementary lightning discharges produce more magnetospheric whistlers which could produce heating and ionization in the lower ionosphere.
Furthermore, it is a feedback mechanism because two different processes could be involved. First, lightning is a source of NOx, and NOx affects the concentration of ozone in the atmosphere which contributes to the greenhouse effect. Second, precipitation of energetic electrons by man?made waves may trigger other lightning discharges. It explains the importance of the study of such man-made waves [7]. Ionospheric perturbations by natural geophysical activities have been made evident by two methods: the study of the electromagnetic waves, and the measurement of the electron density.” LINK
Since learning of REP and its potential role in climate change we’ve seen more and more research coming out that could potentially support the possibility that REP, along with increasing CO2, play a significant role in the climate change we are seeing. For example REP is potentially linked to the most notable region of climate warming in the entire Southern Hemisphere. “In this report we attract attention to a fact that the global maximum of the outer belt energetic electron precipitation is localized in a narrow longitudinal belt centered in the Weddell Sea i.e. in the area of climate warming in the Southern hemisphere. It was shown by several explorers that energetic resources of this electron precipitation are sufficient to change temperature regime of the stratosphere and troposphere.”
As you may well know the stratospheric ozone level is at an altitude above the carbon from man made sources and acts as a valve for UV rays coming into our atmosphere heating these greenhouse gasses. While most of the scientific community has been focused on rising CO2 levels, we’ve heard very little about how our potential use of broadcast energy on a global scale could be stimulating this REP ~ ozone depletion mechanism.
Though we hear more about the potential healing of the ozone holes in polar regions, we’ve heard little about how ozone levels over most populated areas are thinning increasing UV rays: "The potential for harm in lower latitudes may actually be worse than at the poles..The decreases in ozone are less than we saw at the poles before the Montreal Protocol was enacted, but UV radiation is more intense in these regions and more people live there."
A 2016 scientific report first coined the term Anthropogenic Space Weather and discussed the effect our output of electromagnetic energy specifically in the VLF range has been directly observed by NASA satellites to radically alter our magnetosphere creating an artificial bubble of energy around the planet capable of blocking high energy particles from space. This article frames the energetic bubble as being beneficial to blocking radiation from space, but could it also be playing a role in stimulating ozone depletion through Relativistic Electron Precipitation?
First-time evidence shows electrons precipitating or 'raining' from Earth’s magnetosphere are destroying ozone in the upper atmosphere: NASA/Goddard Space Flight Center—
In 2002 Bo Thide from the Swedish Institute of Space Physics wrote a paper titled, “Atmosphere-Ionosphere-Mission, an Elaborate Science Case” in which he put out a call for ideas regarding this REP climate forcing mechanism saying that the public should be concerned. Bo Thide is one of the world’s leading ionospheric physicists. He wrote the book on Electromagnetic Field Theory and single handedly revolutionized our understanding of ionospheric research with multi channel ionospheric probing; awarding him the Edlund Prize of the Royal Swedish Academy of Sciences in 1991. If he’s saying “the public should be concerned”.. why aren’t we even aware of this?:
So after looking at all this I’m left wondering how significant our use of broadcast energy could be in climate change given these new findings? Are NASA and other scientists looking into this possibility and do they deem it potentially significant in climate change? If not.. Why not? Perhaps there is indeed a good reason I’m not aware of.
According the the IPCC, REP was discounted as a potential player in climate change because it’s variability was too closely linked to solar proton events which are unpredictable and REP is seen as “natural”, but if we’ve been outputting EM energy into the ionosphere longer than we’ve been able to measure it, then how can we know what is or isn’t “natural”? “Nevertheless, VLF transmissions of anthropogenic origin may constitute a key space weather influence on pathways that fundamentally alter the storm-time radiation belt. Under these assumptions, it is interesting for the reader to consider what the terrestrial radiation belt environment might have been in the pre-transmitter, and pre-observation, era.”
Anthropogenic Space Weather 2016 -It has taken our scientific community a long time to realize the dire effects man made CO2 plays as a climate forcing mechanism. I don’t doubt its significance and am left wondering if it will take another 50 years before we see there’s potentially another part in the wholistic equation of our complex climate system.
If we’re truly dedicating our time, careers and lives to solving this monumental problem for generations ahead.. are we looking at the potential significance of how our global broadcast may be stimulating an ozone depletion mechanism allowing more UV rays to heat increasing levels of greenhouse gasses most of all CO2 from man made sources? How do we determine what is or isn’t worth our time when looking for answers?
I really appreciate all the energy and effort you and others are dedicating to solving the issues of climate change and appreciate your time and consideration around this letter.
Thank you sincerely, Professor Lewis Carlson PhD ~ RelativisticElectronPrecipitation@protonmail.com
- Climate's changed before
scaddenp at 13:58 PM on 10 July, 2018Responding to jesscars from here:
Sigh, "OK, so you are saying that the effect of CO2 on the temperature is only minor. "
No, he was saying the CO2 direct contribution to ice ages is 0.5C. Mostly it is an amplifier (feedback) converting a change in northern NH albedo into global event.
Historically CO2 can change for many reasons, depending on which events you are talking about. Volcanoes, change to sea temperature (CO2 solubility), changes to vegatation cover, long term carbon sequestration in rock, freeze/thaw of tundra swamps, operating on time periods of seasons to eons. The pliestocene ice-age cycle is driven by milankovich.
Climate is always a response to sum of all forcings. (solar input, albedo, aerosols, GHGs). Past climates are considered by looking at what changes to all of them. Complicating matters is that temperature change triggers feedbacks - you cant change temperature without also changing CO2, CH4, water vapour and albedo.
- American conservatives are still clueless about the 97% expert climate consensus
michael sweet at 20:54 PM on 11 April, 2018Norrism:
From the 2017 US Climate Change Report:
"The likely range of the human contribution to the global mean temperature increase over the period 1951–2010 is 1.1° to 1.4°F (0.6° to 0.8°C), and the central estimate of the observed warming of 1.2°F (0.65°C) lies within this range (high confidence). This translates to a likely human contribution of 93%–123% of the observed 1951–2010 change. It is extremely likely that more than half of the global mean temperature increase since 1951 was caused by human influence on climate (high confidence). The likely contributions of natural forcing and internal variability to global temperature change over that period are minor (high confidence)."
The estimated warming from human sources is 93-123% of the warming. The central estimate is that humans cause about 110% of the warming. Natural processes would cause cooling on their own. That is the consensus. You have been given this information before.
All of sea level rise and all of warming is caused by humans.
If you wasted less time chasing Curries references to geothermal heat in the Antarctic you would be more informed. The critical issue with any geothermal heat is has it changed? Deniers claim any finding of heat causes warming. That is false, the source of heat must have changed to cause warming. There is no evidence of any geothermal, solar or other natural source of heat increasing.
In 1850 scientists predicted on the basis of the properties of carbon dioxide that the globe would warm and the sea would rise. In 1896 Arhennius projected the amount of warming accurately. Why is it so hard for you to accept what experts measure?
- Murry Salby finds CO2 rise is natural
MA Rodger at 19:14 PM on 10 April, 2018sailrick @25,
Further to Eclectric @26, the egregious CO2 cycle nonsense in Harde (2017) has been rebutted at RealClimate and in the literature by Köhler et al (2017). The paper itself still sits for unsuspecting fools to feed from courtesy of the heatland of fiction-creation the Heartland Institute which pretty-much says it all.
The solar radiation claim cites five papers to suggest that the increase in solar heating of the surface is far more significant to climate than levels of GHG forcing.
It is good to see that the papers provided give a similar answer (although they may not be considering similar periods). Yet they certainly do not provide some AGW-busting finding. Without setting out the findings of all five papers, consider here just the first - Hatzianastassiou et al (2005). This paper models surface short-wave radiation with reanalysis and concludes:-
"Significant increasing trends in DSR and net DSR fluxes were found, equal to 4.1 and 3.7 Wm−2, respectively, over the 1984–2000 period , ... indicating an increasing surface solar radiative heating. This surface SW radiative heating is primarily attributed to clouds, especially low-level, and secondarily to other parameters such as total precipitable water. The surface solar heating occurs mainly in the period starting from the early 1990s, in contrast to decreasing trend in DSR through the late 1980s." (DSR = SW downward surface radiation)
Thus the finding is that DSR was increased through a certain period through a reduced level of cloudiness. The paper does not address wider implications of that change in cloudiness, for instance the impact of that loss of cloud on LW radiation transfers. Hatzianastassiou et al. are surely happy that this conforms with other papers as they make no mention of any controversy (although their estimate for surface albedo is different enough to be worth a mention). In any of these five papers, if their findings were AGW-busting stuff, would they not be saying so?
The changes in energy flux quoted by these papers are large but the actual values for global warming are measured at the top of the atmosphere and such large levels of warming are not present. The more-reliable measure of Ocean Heat Content supports such measurements, levels that are those to be expected from AGW.
All the denialist is doing is picking a large change within the climate system and arbitrarily attributing it to his preferred non-AGW fantasy.
- Murry Salby finds CO2 rise is natural
sailrick at 16:51 PM on 10 April, 2018I've been engaged in debate at a Discovery article, with someone called RealOldOne2, who is made the following claim today, in response to a comment by me.
["Peer reviewed science says that only 15% of the increased CO2 since the Industrial era is human, and 85% is natural:"The anthropogenic contribution to the actual CO2 concentration is found to be 4.3%, its fraction to the CO2 increase over the Industrial Era is 15%" - Harde(2017) "Scrutinizing the carbon cycle and CO2 residence time in the atmosphere"]
I don't have the resources or know how to research the subject enough to counter his claim. Anyone want to take a shot at it?
He also makes claims (in another comment) about short wave energy striking the earth increasing due to cloud changes effecting albedo, and cites published papers, to back his claim that this effect is stronger radiative forcing than human CO2 emissions.
He said.
"And the amount of solar radiation reaching the earth's surface increased by 2.7W/m² to 6.8W/m² during the late 20th century warming. This is documented in the following peer reviewed science:"
Here's the link
LINK - Explainer: The polar vortex, climate change and the ‘Beast from the East’
scaddenp at 14:29 PM on 31 March, 2018Alchemyst, given your earlier comments expressing doubts about modelling, I am surprized at you pushing a modelling paper. I am a little curious as to how you found it but yet missed any the 2014 reviews of arctic influence. No matter – the paper in question (Ineson et al, 2011) was written showing some modelling support for hypothesis of low solar activity contributing to the then recent cold winters. The corollary of this view is that anomalous jet stream behaviour (present in those events) should have eased when the sun returned to active mode. It did not – anomalies continued right up to this year. Furthermore, if the solar is the dominant influence, (as opposed to a contributing factor), then the 2018 tree ring study of jet stream behaviour should be also revealing the link – it does not.
Overland et al 2015 has a discussion of arctic – jet stream linkages which I found very helpful. It notes solar (citing Ineson et al) among other possible influences (ENSO, QBO, AMO etc). However, the evidence is increasing pointing towards the loss of ice in the arctic basins as the dominant cause of recent anomalous jet stream variability. The tree ring study by itself put any "Its just a natural cycle" explanation in doubt.
Interestingly, the model effect from solar changes in Ineson et al affecting the jet stream variability is the decrease in equator-polar temperate gradient.
"This temperature change is directly attributable to the decrease
in ozone heating associated with ultraviolet irradiance, which
is important at these levels11. This signal peaks in the tropics
and corresponds to a relative decrease in the pole-to-equator
temperature gradient. This response is reproduced in our model
(Supplementary Fig. S1) with significant cooling of about 2 K near
the tropical stratopause. Geostrophic balance requires that the
diminished polewards temperature gradient is matched by a weak
easterly wind anomaly in the subtropical zonal mean circulation
in the upper stratosphere"Sea-ice loss does exactly the same thing.
As this article clearly states, the science is still young but it certainly cannot be dismissed.
- Flaws of Lüdecke & Weiss
Doug_C at 09:48 AM on 18 January, 2018It's a question of relative radiative forcings acting on the Earth's land surface, oceans and atmosphere.
The periods of deep glaciation in recent geological times that have covered a large part of the Northern Hemisphere in thick ice sheets and dropped global temperatures for thousands of years are likely the result of the Milanchovitch Cycles which can reduce the amount of Solar irradiation at northern latitude. These are on the order of a few tenths of a watt per meter squared and act over thousands of years in a dry process of more snow and ice cover lasting longer and reflecting more sunlight back into space dropping temperatures and drawing down more carbon dioxide cooling things even more creating more snow and ice cover which reflect more sunlight cooling things further. It's a feedback loop than when most of the continents are near the Equator can cover almost all of the Earth in ice.
The radiative forcing from the changes we have made in atmospheric CO2 alone are almost +2 watts per meter squared, we have totally swamped the natural focrings that have resulted deep glaciation periods.
There almost certainly will be no transition to a glaciation period due to the human release of CO2 alone. The Solar Cycles are also not that significant in relation to the forcings of atmospheric CO2 in recent times, once again in the range of a few tenths of a watt per meter squared.
Even a prolonged Solar Minimum is not going to result in a cooling trend on the Earth's surface now, it will only result in a slowing of global warming as long as the positive radiative forcing from carbon dioxide emissions and other human activities greatly exceed the possible negative forcings from Solar Cycles.
And the overall trend in Solar activity is not a decrease in Solar irradiance, it is an increase. The Sun puts out far more energy now than it did say 500 Mya for instance.
Appealing to the Sun to save us as papers like LW17 do seem far more religious to me than scientific.
- The 'imminent mini ice age' myth is back, and it's still wrong
Doug_C at 02:35 AM on 11 January, 2018@JH
The "this" I was referring to is the belief that we can predict the long term changes in Solar output and then base policy on that.
Which seems to be the focus on a lot of these attempts to create doubt of whether we are in a warming phase - almost all the evidence says so - or at the edge of a cooling phase.
Based on the relative radiative forcings even a short term cooling phase is highly unlikely, the positive radiative forcing of the additional carbon dioxide alone we've added to the Earth's atmosphere is many times the negative forcings that result in full blown ice ages. The relative minor negative forcing of a prolonged Solar minimum would result in a slowing of global warming, not a cooling of the Earth. As the article above states.
- The 'imminent mini ice age' myth is back, and it's still wrong
Doug_C at 16:31 PM on 10 January, 2018This sounds more like economic predictions than hard science to me.
Guessing how the interactions of a massive ball of plasma under the influence of gravity, intense magnetic fields and incredible heat at the core where fusion is taking place constantly is not like a pendulum over long periods of time. The Sun is a dynamic evolving system which means that it is not the same as it was even hundreds of years ago and it is much different now than it was millions of years ago. At some point it will not even be recognizable as our Sun.
And its output is progressively increasing, though over the scale of hundreds and thousands of years this is not that significant.
It is just as valid to assume that we could see a period of increased solar activity and a positive radiative forcing of the Earth than a deep minimum.
Ice ages do not come about as a result of radiative forcings of the Sun, they are the result of long term changes in the orbital dynamics of the Earth, the eccentricity of the eliptical orbit, the axial tilt and precession of the earth as it wobbles on its axis.
These forcings are tiny compared to what human created forcings have done in the last 150 years and require thousands of years to take a mostly ice free Northern Hemisphere and turn it into one covered by thick ice sheets that reached as far as south of the Great Lakes in North America.
This has been completely swamped by the effects alone of hundreds of billions of tons of carbon dioxide being introduced into the carbon cycle by human activity. There will be no ice age as long as we burn fossil fuels and if we keep burning as much as we are now even a record solar minimum like the one we just had will only slow the process of global warming as the article states.
With the coincidence of a deep solar minimum and a strong La Nina a few years ago the Earth should have seen a record low average yearly temperatures. We did not, they were still in the upper levels of temperature records.
This seems to me to be just one more attempt to deny valid evidence of global warming.
- The 'imminent mini ice age' myth is back, and it's still wrong
nigelj at 08:15 AM on 10 January, 2018So in other words we know that a certain level of change in solar irradiance causes a certain change in temperature, and its quite small compared to CO2. So a solar minimum would be weak.
But the predicted so called coming "grand solar minimum" is just a guess. We don't really know the exact causes and periodicity of these cycles, and they appear random, so we are guessing that because solar activity increased from about 1600 to the 1970s, it 'might' be time for a decline of some sort, - like an economic downturn. This is just pure presumption. It could equally stay flat for decades to come, or even increase reinforcing agw.
- CO2 limits won't cool the planet
MA Rodger at 19:33 PM on 31 December, 2017Aaron Davis @27,
I assume you have not carried out even the most simplistic of calculations to support you assertion "So, if anything albedo and CO2 combination, should overstate the seasonal effect over CO2 alone." If you had, you would have noticed that, while the impact of surface albedo will accentuate your elusive little CO2 effect, if you calculated it properly even for that pair of two-month-periods, you would see that during the periods and zones in question, insolation & albedo are far bigger effects than your teeny weeny dip in CO2. The insolation works against the CO2 effect and is about 100 x bigger (+13Wm^-2 compared with -0.14Wm^-2). The Surface Albedo effect is bigger still being about 300 x teeny weeny CO2 effect but additional to it. So the combination of Insolation and Surface Albedo sits 200 x bigger than the teeny weeny effect you attempt to measure (-27Wm^-2). Of course the atmospheric albedo is still to be accounted as has the imbalances in preceeding months. And there is still a whole pile of other factors beyond solar energy input.
I must stress that the reason your teeny weeny CO2 effect is so insignificant is not because CO2 forcing is insignificant or even that 15ppm CO2 is entirely insignificant. It is because the 15ppm CO2 dip you attempt to measure is only operating for a couple of months before you attempt to measure its impact.
The 9e18j value you ask about reflects the size of the zone impacted by the dip and its accumulative impact by the time of your temperature measurement. It is not a global figure. Why would it be? (The annual global forcing from -15ppm ΔCO2 would today amount to 2,250e18j, an effect that is far from insignificant.) That you apparently see some notion mirroring your own denialism in my comments is entirely illusory on your part.
- CO2 limits won't cool the planet
MA Rodger at 04:10 AM on 27 December, 2017Aaron Davis @3,
Whilst being off topic, it is probably appropriate to address here the deficiencies in your "facts" analysis.
The level of CO2 in the terrestrial atmosphere is today about 620 ppm by weight or 0.062%. Martian CO2 levels are perhaps 98% by weight. These are the figures that should be used if you wish to calculate kg of CO2, rather than your ppm-by-volume values. With the Martian atmosphere 0.6% the pressure of the terrestrial atmosphere and gravity 38%, the number of CO2 molecules a photon has to negotiate within the Martian atmosphere, relative to the terrestrian one, is thus about 25 times, or there abouts.However, the direct comparison of Martial temperatures with terrestrial ones is dependent on more than just the presence of GHGs. As a first approximation, Mars is 151% further from the sun than Earth but has 82% of the albedo, so Earth absorbs 1.51^2 x 0.82 = 187% (1/53%) more warming. If we accept the widely quoted average terrestrial temperture of 288 K and GHG effect of 33 K, the non-GHG temperatures would be 255 K for Earth and 218 K for Mars.
The comparison of noon-day equatorial temperatures on Earth & Mars is a poor measure of global temperature given the terrestrial diurnal range is perhaps 10 K (or less at Manta )while the Martial equivalent diurnal range has been measured at 125 K. Even in the middle of the Sahara Desert, far from the moderating effect of oceans and with H20 and cloud greatly reduced, the terrestrial dirurnal range is shown as 15 K, a level of magnitude smaller than for Mars.
A fuller account is perhaps required. The actual average Martian temperature is still not accurately measured. Results from modelling variously quote values roughly 218 K suggesting a minimal Martian GHG effect, and even the surface temperature lower than the effective radiative temperature (Covey et al 2012), although only when simplistically calculated (Haberle 2012). The 25 times Martian CO2 levels should not be seen as providing a large GHG effect.
A simplisitc calculation for the direct CO2 impact on terrestrial climate CO2 levels increased 25 times today's would suggest (from 4.5 doublings) a direct temperature increase of 4.5 K to which should be added the CO2 contribution from today's CO2 levels. Today's full GHG effect is widely quoted as 33K and CO2 has been calculated would provide 26% of this in the absence of other GHGs (as the situation on Mars). Thus the 25x CO2 effect would total 4.5 + 8.6 = 13.1 K from a total of 58Wm^-2 forcing.
At first glance, this 13.1 K/58Wm^-2 GHG effect for the terrestrial atmosphere on Mars appears entirely absent. (The 218 K Martian temperature as a black body would roughly radiate equal to the Martian solar warming of 53% terrestrial as set out above.) However there are three adjustments required for such a finding.
Firstly, the effect occurs in a cooler climate with less radiation flying about. This reduces the warming to 12 K with 31Wm^-2 forcing when the total radiative spectrum is considered pro rata. There is further reduction as the radiation in the region impacted by CO2 is less significant overall at such temperatures. Thus the full less-radiation-about adjustemnt results in roughly 10 K with 26Wm^-2 forcing.
Secondly, the effectiveness of the GHG effect on Mars will not be equally efficient as on Earth. Indeed more serious calculations (eg Clive Best) suggest the thin and cold Martian atmosphere would be warmed by perhaps just 12 Wm^-2 of foring which calculates as just 4 k additional to a 218 K planet. (I assume the 2 K value set out by Clive Best is a a mistake.)
Thirdly, with no oceans and only a thin whispy atmosphere, a warming Mars has naff-all to heat up except the rocks (just like on the moon). So not only is there very little thermal mass in the atmosphere (1% of the terrestrial atmospheric thermal mass), Mars also lacks having two-thirds of the planet kept at a constant temperature throughout the diurnal cycle due to 4km-deep oceans. As a result, Martian day-time temperatures skyrocket and leak significant energy away as a result. And come night-time, temperatures plummet. The full night-time atmospheric temperature drop experienced in Earth over 12-hour is equalled in just 8 minutes on Mars. This is thus large diurnal range and is significant for the global average temperature as maintaining a constant temperature is radiatively more efficient than having big diurnal temperture ranges. The moon's diurnal range, for instance (although an extreme example with zero GHGs & month-long days) has an average temperature 50 K lower than the temperature that could be maintained as a black body with the same radiative losses (this calculated using the data presented in Williams et al (2017) Fig 9a ). On Mars, such 'radiative inefficiency' is much less but still bigger than the GHG effect of 4 K (seemingly) calculated by Clive Best.
Subject to any mistakes of my own, this accounts fully for the lack of GHG effect warming Mars apparent from simplistic analysis.
- CO2 limits won't cool the planet
Aaron Davis at 01:59 AM on 27 December, 2017Thank you again for your patience and quick response, and your suggestion that I comment on other articles you suggest is good.
If you could, please help me correct my post on the "secondary waste heat" article since I appear to have flipped the division at the end. Heat loading from inefficiency of human consumption of heat energy (50% at best per Carnot's Law) is only 4% of the earth's reported heat accumulation not 20x. Please delete that post, I will repost to the linked discussion.
Also please send me the link to instructions on posting images. The graph of power flux vs temperature and humidity I posted to IMGUR, and linked here apparently was not effective.
I sincerely appreciate your "sloganeering" policy. But, what is the term for stating flatly a concept "wildly incorrect", and subsequently miss-quoting a contributor?
Using your perfectly acceptable car analogy, would have people believe that it is the glass that generates heat (analogous to CO2) rather than the cars inside surfaces. As I've tried to explain, a better analogy is that GHGs act as a valve, not a heat source like the solar radiation, or surface temperature or waste heat from a heat engine. To me, push the concept that CO2 is a forcing factor is more "sloganering" than accepting that GHG has a better analogy as a valve in a Rate Process illustration.
Also, I believe you miss-quoted me "CO2 blocks as much energy coming from the Sun as it blocks leaving the Earth". What I said was that emissivity is a multiplying factor for black body radiaton. Downward solar and upward earth radiation have different spectras, but in both cases humidity and clouds (a reflective component) are principle effects felt on the day to day cycle, while CO2, methane are minor compnents felt on decade/century scales. On a seasonal basis, even a 15 ppm seasonal variation of CO2, caused by the gowth/decay cycle of the Boreal Forest is not a perceptible contributor to Arctic temperatures relative to the Antarctic at similar latitudes, but without the levels of CO2 variation on a seasonal time frame. If this is not the main point of this argument [CO2 limits won't {this century} cool the planet] please excuse me.
Mr. [TD], it may not be your fault that you cannot accept my claims. You may not have the background to do much more that than point to articles that may or may not support your position. That's okay. I've been told that without dozens of peer reviewed Journal articles, even well trained scientists will back off of their stongly held beliefs. It seems the smarter one is, the better they are capable of rebutting serious challenges, even if they're wrong.
- CO2 limits won't cool the planet
Philippe Chantreau at 05:43 AM on 21 December, 2017Mods; I'm having problems losing comments when using the link insert function, hence the non embedded links at the end.
Aaron: Your Mars/Earth trick ignores the facts that Mars does have some GH effect that raises its average temp by approximately 5 deg K compared to no GH effect at all. Mars remains cold because of the very low atmospheric mass, the lack of other GH gases in sufficient quantity, the low solar irradiance and low outgoing IR radiation to be captured. You did not mention any of these facts, and your little mars/Earth comparison is irrelevant to the point of being misleading. The shame is on you for that.
MODTRAN and HITRAN are sophisticated models using physics. I'm not sure what you are trying to say with the predictive/descriptive thing. The values predicted by HI/MODTRAN have been verified for many conditions and show close agreement with observations. This was especially important from early on when developing the model and was the subject of abundant research. There is an entire body of litterature on this aspect of validation. These models superseded simple models such as the Swinbank many years ago, and allow for far more accurate and refined representations of atmospheric radiative processes. The tutorial that you linked only claims to be useful for cloudless vs cloudy night comparisons. It states to be valid for a surface "isolated from its environment."
The reason why CO2 receives emphasis in IPCC works is because all the research compiled continues to point to it as the forcing responsible for the changes observed. No other forcing fits the bill, no matter how hard we look. Furthermore, paleo evidence also points to CO2 as the major control knob. That is why it is necessary to accomplish a carbon free energy transition, then decarbonize as much of the World economy as possible. I do not advocate for geo-engineering, but if it comes to that, large scale carbon capture is likely the least risky option. Not only it will just reverse the recent trend, but it will also mimic what has happened naturally in the past.
In contrast, the geo-engineering schemes that you propose are among the least realistic I've ever seen. Paleo evidence suggests that the closing of the Panama isthmus was associated with the onset of the glaciation/deglaciation cycles. Forcing large amounts of sea water to do anything could lead to the mother of all unintended consequences and would require to transform the entire planet in some sort of gigantic engineering project.
As of now, airplanes emit CO2, H2O and various particulates. Although the altitude of release poses its own problems, the quantities involved make them far less of a priority than coal fueled electricity production. Recruiting commercial air traffic for the purpose you suggest would imply that they're equipped with carbon/water free propulsion, and then loaded with equipment decreasing their payload, while they already have the problem of energy density to contend with. That is nowhere near realistic.
Your remark on moving thermal and nuclear plants seem to allude to waste heat. This has been discussed on this site and shown to be an order of magnitude too small to be a significant factor. In addition, large industrial facilities of any kind can not be "moved." They would have to be dismantled (expensive process) then rebuilt somehwere else (even more expensive). In the case of electricity producing facilities, relocating far away from consumption sites also carries innumerable other problems.
I don't see that you've shown to understand atmospheric radiative processes anywhere near as well as you claim, and certainly not in a way to turn current understanding by experts on its head; it would be a euphemism to call your geo-engineering ideas far fecthed.
About Mars:
http://marsnews.com/the-planet-mars
One (among many) relatively recent MODTRAN validation study:
https://www.ncbi.nlm.nih.gov/pubmed/22614400
About moving sea water:
http://www.sciencedirect.com/science/article/pii/S0012821X05004048
- Battered by extreme weather, Americans are more worried about climate change
nigelj at 04:32 AM on 23 November, 2017Tom13 @9
The natural variation line in the global warming index graph is flat overall, if by that you mean it shows no upwards trend over the whole period, but it is clearly not flat as a graph. It clearly shows small increase from 1920 to approx 1980. This is consistent with increasing solar irradiance over this period. The reason the slope is small is because solar irradiance is not as powerful a driver as CO2. Solar irradiance was flat as a trend from 1980 - 2016, so obviously would not be represented in the graph other than as a flat line.
Things like le nino and la nina are short term repeating cycles that show no long term trend upwards or downwards. When you put that information in the index the el ninos and la ninas cancel out and you get a straight line. That is why you dont see them in the index. Remember its an index not a temperature trend, in laymans terms its a composite index. The PDO cycle is the same basically.
There are no natural forcings known that would cause the index to slope up over the entire period. Thats just the way it is. If you believe otherwise theres nothing stopping you publishing a research paper.
- Reflections on the politics of climate change
RedBaron at 08:57 AM on 12 November, 2017Well Chris,
Interesting smattering of almost every denialist talking point known! You certainly came to the right place though! Because here we have very detailed rebuttles to all of them!
I will just point you to the most important and what just happens to be last on your list; your claim that we don't know the warming is human caused. The evidence is here. To give you the cheap and easy explanation though, basically follows like this:
- By the Natural cycles and natural trends like obital wobbles and solar activity combined with ocean currents, volcanos etc.... We should be cooling
- We are warming instead
- The factors causing the warming are either directly human caused like CO2 emissions or reinforcing feedback loops we started like water vapor increases and reduced albedo due to melting ice.
- Thus you are right. We are not 100% responcible for global warming. The actual % is higher than 100%, because otherwise we would be on the long slow decrease in temperatures towards a gaciation period.
- The F13 files, part 1 - the copy/paste job
Bob Loblaw at 01:37 AM on 21 October, 2017Derek:
Geothermal heat flow is, on average, pretty small. It is tiny compared to the radiative forcing from added CO2. To quote this Wikipedia page:
Mean heat flow is 65 mW/m2 over continental crust and 101 mW/m2 over oceanic crust. This is 0.087 watt/square meter on average (0.03 percent of solar power absorbed by the Earth[15] ), but is much more concentrated in areas where thermal energy is transported toward the crust by convection such as along mid-ocean ridges and mantle plumes.
To contribute to global warming, you would have to have a significant increase in this quantity - like 10x more globally-averaged, which means probably 1000s time more in local areas. It ain't happening.
[I would try to defend classifying "geographers", as that is my background, buit "geographer" varies an awful lot and some of them are awfully ignorant on climate - such as TIm Ball.]
- Carbon Dioxide the Dominant Control on Global Temperature and Sea Level Over the Last 40 Million Years
MA Rodger at 20:31 PM on 6 October, 2017citizenschallenge @89.
Having now read Lightfoot & Mamer (2017), I can report that it is total nonsense. It is not the first nonsense from these authors which include Lightfoot (2010) 'Nomenclature, Radiative Forcing and Temperature Projections in IPCC Climate Change 2007: The Physical Science Basis (AR4)' [ABRTRACT] and Lightfoot & Mamer (2014) 'Calculation of Atmospheric Radiative Forcing (Warming Effect) of Carbon Dioxide at Any Concentration ' [PDF], this last setting out much of the argument now presented in Lightfoot & Mamer (2017) (although strangely this ealrier work is unmentioned in the later). Yet the bold and revolutionary assertions on AGW within this earlier work have not set the world alight since publication, a telling result. Instead it has gone un-noticed into the oblivion of nonsense-filled literature.
And Lightfoot & Mamer (2017) will follow. It says nothing other than there is on average for any location and month much more H2O at the bottom of the atmsphere than there is CO2, and that the hotter the location/month the greater the disparity. They also arrive at the astounding finding that it is hotter in the tropics and in summer months than it is in the polar regions and winter. Further, they identify a general correlation (which they fail to actually calculate) between temperature and the angle of the sun up in the sky. (I recall noting in prevoius days that the sun is not static in the sky but appears to vary in angle through the day. Thinks - would this Lightfoot&Mamer correlation still hold for time-of-day?).
Lightfoot&Mamer fail to comprehend the concept Radiative Forcing (RF). They would greatly benefit from a quick read of UN IPCC AR5 Chapter 8 section 8.1 (which they do not cite in their paper) or a proper read of UN IPCC TAR Chapter 6 (which they do cite but somehow fail to understand). Not the least of this ignorance is their use of surface back-radiation as though it were RF when by definition RF concerns the imbalance at the tropopause (with adjustment for stratospheric influences) and has nothing to do with surface back-radiation.
"The radiative forcing of the surface-troposphere system due to the perturbation in or the introduction of an agent (say, a change in greenhouse gas concentrations) is the change in net (down minus up) irradiance (solar plus long-wave; in Wm-2) at the tropopause AFTER allowing for stratospheric temperatures to readjust to radiative equilibrium, but with surface and tropo-spheric temperatures and state held fixed at the unperturbed values." UN IPCC TAR (2001) Section 6.1.1
Their fraught calculations of the H2O/CO2 ratio do not apply to the tropopause. Their discussion concerns the properties of back-radiation which result from surface air temperature (SAT) but they rather overlook the physical mechanisms that maintain the SAT which are all to do with the atmosphere above, all the way up to the tropopause.
Whichever way you cut it, Lightfoot&Mamer(2017) is a rich vein of total nonsense.
- The Mail's censure shows which media outlets are biased on climate change
NorrisM at 16:14 PM on 1 October, 2017nigelj @ 46
I see that the thrust of the one question you asked that I did not answer relates to how much certainty do we need before we make significant decisions. You state:
" We certainly have a good idea of global temperatures plus or minus a small discrepency (sic)"
After me commenting on the Millar et al paper that has recently been published, one of the other participants suggested that I read the blog following the McKitrick article on the Judith Curry website. In fact, I found the discussion very interesting and civil between McKitrick and Hausfather but it was too technical for me to come to any conclusions on where they ended up.
But reading further, I came to an answer to your question regarding how much "certainty" I need or, more to the point, how much uncertainty there is there with the models?
First, Benjamin Webster came up with what I thought was a reasonable explanation for the differences in what the observations show and what the models have predicted and how they have been "adjusted" to correspond with actual observations so that they are very close:
"With regard to forcing, this is apples-to-apples.
For the past, we generally know the real-world forcings that went into the hindcasts.
For the present simulations, they can get off if we don’t use the real-world forcings.
That’s part of the cause of the 1998-2014 temperature “slowdown”. Solar and volcanic forcings were a little cooler than expected. But running a hindcast with the real-world forcings still gives pretty good estimate of the resulting surface temperatures."Just at a point when I thought, "gee" is that all there is in differences, David Springer highlighted exactly what Steve Koonin said in the APS panel that I have reference before:
"Sorry Benjamin but estimated ECS is still 1.5C – 4.5C @ 95% confidence. By definition that’s a constant forcing. That range hasn’t been improved in 60 years of climate “science”. The low end of that range is yawn-worthy and the high side is alarming. Observed ECS is near or below the low number."
I will not add the balance of his remark.
If we are still at this range, we are not talking 100% certainty, are we? We are no where near the certainty we require before we undertake massive changes in our society.
This is not the place to discuss the massive changes required.
- New research, September 11-17, 2017
Paul Pukite at 09:16 AM on 23 September, 2017Lots of new research results at the upcoming AGU meeting. I will present forcing models for ENSO and QBO. The model forcing uses precise lunisolar data to match the behavior for cross-validated intervals over the instrumental record. The general model was derived from Laplace's Tidal Equations, which form the basis of all GCMs.
See you there!
- We're heading into an ice age
Daniel Bailey at 23:14 PM on 3 September, 2017No guesswork needed. The Earth's climate doesn't change significantly without a change in factors capable of forcing it to change. When climate is in balance, seasons come and go at their usual times and polar ice cover stays within range of natural variations. As do ocean pH and global temps. If global temps and ocean pH are changing, which we can measure and verify that they are, then there must be a change in the composition of those gross factors which can affect climate.
The gross factors affecting climate are: Milankovitch cycles (orbital factors), solar output, volcanoes (typically a negative forcing), aerosols, surface albedo and non-condensable greenhouse gases (water vapor plays the role of feedback). Orbital forcing has been negative for the past 5,000 years (since the end of the Holocene Climate Optimum), solar output during the past 40+ years has been flat/negative, volcanoes exert a short-term (up to several years) negative forcing (but none of note since Pinatubo), aerosols (natural and manmade) are a net negative forcing over that time period. Albedo is a net positive forcing due to the ongoing loss of Arctic sea ice; cloud albedo effects are thought to be in general a net zero forcing.
Which leaves the non-condensable greenhouse gases, primary of which are carbon dioxide (CO2) and methane (CH4). Atmospheric levels of both are rising, and have been for literally centuries now, so they are a net warming. While the concentration of CH4 is rising, and it is a potent GHG, the warming from it is overall less than that of CO2 due to the much more massive injection of previously-sequestered, fossil-fuel-derived bolus of CO2 humans are re-introducing back into the carbon cycle.
Still no guesswork neded. Scientists have researched that very subject. What they've found is that the next ice age has been postponed indefinitely.
Per Tzedakis et al 2012,
"glacial inception would require CO2 concentrations below preindustrial levels of 280 ppmv"
For reference, we are at about 400 right now and climbing, so we can be relatively sure the next glacial epoch won't be happening in our lifetimes.
But what about further down the road? What happens then? Per Dr Toby Tyrrell (Tyrrell 2007) of the University of Southampton's School of Ocean and Earth Science at the National Oceanography Centre, Southampton:
"Our research shows why atmospheric CO2 will not return to pre-industrial levels after we stop burning fossil fuels. It shows that it if we use up all known fossil fuels it doesn't matter at what rate we burn them.
The result would be the same if we burned them at present rates or at more moderate rates; we would still get the same eventual ice-age-prevention result."
and
"Burning all recoverable fossil fuels could lead to avoidance of the next five ice ages."
So no ice ages and no Arctic sea ice recovery the next million years...
Also covered by Stoat, hereThis Nature article offers an interesting summary
- 2017 is so far the second-hottest year on record thanks to global warming
chriskoz at 15:48 PM on 1 August, 2017TSI value changes from the solar charts by Tom13, reveal the increase from pre-1700 (Maunder minimum the main reason for LIA) and today is 2W/m2 from 1364 to 1366 (1990s studies), or 1.5W/m2 from 1360 to 1361.5 (AR5 - more reliable source). Attenuating this figure of 1.5W/m2 by 4 (sphere vs. disk surface), and by further 30% for average Earth albedo, you get 1.5/4*70% = about +0.3W/m2 solar forcing on Earth surface between LIA and today.
At the same time, human induced forcing reached 2.29W/m2 according to AR5, and upgraded few months ago to 2.5W/m2.
So if you should have a feeling how AGW signal relates to long term natural signals such as "recovering from the effects of little ice age", you have the answer in the numbers above. AGW signal is at least 8 times (would be more perhaps 10 times - 3W/m2 - if we removed temporary effects of aerosols) stronger than "recovery from LIA" signal.
If LIA was so "dramatically cold" according to legendary tales, and natural cycles are to blame for GW we're experiencing according to the deniers, then the numbers above tell a scary story: the AGW is already 10 times stronger than "LIA recovery", although it did not reach equilibrium T yet. Wait for our childern to experience equilibium conditions, and it grows stronger and stronger as we keep burning FF.
- 2017 is so far the second-hottest year on record thanks to global warming
scaddenp at 13:50 PM on 1 August, 2017Sigh, this is about difference between precision and accuracy. Precision is 0.01, accuracy 0.2. The question around basis, calibration have been around for a while. Good article here about it and what it does or doesnt matter. When looking for a forcing on climate, then what matters is the change, rather than absolute value.
If you get your information from appinsys and the badly named "friends of science" you will never want for moonshine.
- Water vapor is the most powerful greenhouse gas
Daniel Bailey at 09:39 AM on 15 July, 2017
"If we take the earth and atmosphere as is, and made every atmospheric CO2 molecule vanish, we would certainly lose the greenhouse effect contribution from CO2, but remember that H2O is the stronger and more abundant greenhouse gas. Therefore, we would expect a small reduction in greenhouse heating possibly causing temperatures to drop by a few degrees C, but not at all like the "frozen world" you describe."
Real scientists have examined exactly that. FYI, Water vapor is a condensible GHG. As such, and by definition, it cannot be a driver of temperature changes but can only serve as a feedback to them.
Carbon dioxide, on the other hand, is the most important temperature control knob on the planetary thermostat.


"Ample physical evidence shows that carbon dioxide (CO2) is the single most important climate-relevant greenhouse gas in Earth's atmosphere. This is because CO2, like ozone, N2O, CH4, and chlorofluorocarbons, does not condense and precipitate from the atmosphere at current climate temperatures, whereas water vapor can, and does.
Non-condensing greenhouse gases, which account for 25% of the total terrestrial greenhouse effect, thus serve to provide the stable temperature structure that sustains the current levels of atmospheric water vapor and clouds via feedback processes that account for the remaining 75% of the greenhouse effect.
Without the radiative forcing supplied by CO2 and the other non-condensing greenhouse gases, the terrestrial greenhouse would collapse, plunging the global climate into an icebound Earth state."
"The climate system of the Earth is endowed with a moderately strong greenhouse effect that is characterized by non-condensing greenhouse gases (GHGs) that provide the core radiative forcing. Of these, the most important is atmospheric CO2. There is a strong feedback contribution to the greenhouse effect by water vapor and clouds that is unique in the solar system, exceeding the core radiative forcing due to the non-condensing GHGs by a factor of three. The significance of the non-condensing GHGs is that once they have been injected into the atmosphere, they remain there virtually indefinitely because they do not condense and precipitate from the atmosphere, their chemical removal time ranging from decades to millennia. Water vapor and clouds have only a short lifespan, with their distribution determined by the locally prevailing meteorological conditions, subject to Clausius-Clapeyron constraint.
Although solar irradiance is the ultimate energy source that powers the terrestrial greenhouse effect, there has been no discernible long-term trend in solar irradiance since precise monitoring began in the late 1970s. This leaves atmospheric CO2 as the effective control knob driving the current global warming trend.
Over geologic time scales, volcanoes are the principal source of atmospheric CO2, and the weathering of rocks is the principal sink, with the biosphere participating as both a source and a sink. The problem at hand is that human industrial activity is causing atmospheric CO2 to increase by 2 ppm/yr, whereas the interglacial rate has been 0.005 ppm/yr. This is a geologically unprecedented rate to turn the CO2 climate control knob. This is causing the global warming that threatens the global environment."
And:
"If there had been no increase in the amounts of non-condensable greenhouse gases, the amount of water vapor in the atmosphere would not have changed with all other variables remaining the same.
The addition of the non-condensable gases causes the temperature to increase and this leads to an increase in water vapor that further increases the temperature.
This is an example of a positive feedback effect. The warming due to increasing non-condensable gases causes more water vapor to enter the atmosphere, which adds to the effect of the non-condensables."
More than 100 comments found. Only the most recent 100 have been displayed.

More than 100 comments found. Only the most recent 100 have been displayed.


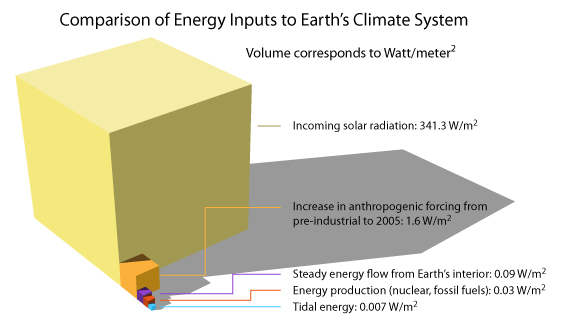
THE ESCALATOR

(free to republish)